The Distance to the Perseus Spiral Arm in the Milky Way
††slugcomment: Version: 8 December 2005We have measured the distance to the massive star-forming region W3OH in the Perseus spiral arm of the Milky Way to be 1.95 0.04 kilo-parsecs ( km). This distance was determined by triangulation, with the Earth’s orbit as one segment of a triangle, using the Very Long Baseline Array. This resolves a long-standing problem of a factor of two discrepancy between different techniques to determine distances. The reason for the discrepancy is that this portion of the Perseus arm has anomalous motions. The orientation of the anomalous motion agrees with spiral density-wave theory, but the magnitude is somewhat larger than most models predict.
Massive stars and their associated bright regions of ionized hydrogen trace the spiral arms of galaxies. However, for our galaxy, the Milky Way, our view from the interior makes it difficult to determine its spiral structure. In principle, one can construct a simple model of the rotation speed of stars and gas as a function of distance from the center of the Milky Way. Then, if one measures the line-of-sight component of the velocity of a star or interstellar gas, one can determine its distance by matching the observation with the model prediction (i.e., a kinematic distance). Knowing distances to star forming regions, one can then locate them in 3-dimensions and construct a “plan view”–a view from above the plane–of the Milky Way. Unfortunately, many problems arise when constructing a plan view of the Milky Way, including 1) difficulties in determining an accurate rotation model (which requires the distance and orbital speed of the Sun from the center of the Milky Way), 2) distance ambiguities in some portions of the Milky Way (where an observed velocity can occur at two distances), and 3) departures from circular rotation (as might be expected for spiral structure). Progress has been made on the first two problems. For example, many kinematic distance ambiguities can be resolved by interferometric studies of hydrogen absorption in the radio, since distant sources will show a greater velocity range for hydrogen absorption than near sources [1]. However, the third problem, non-circular motions, is fundamentally much harder to address.
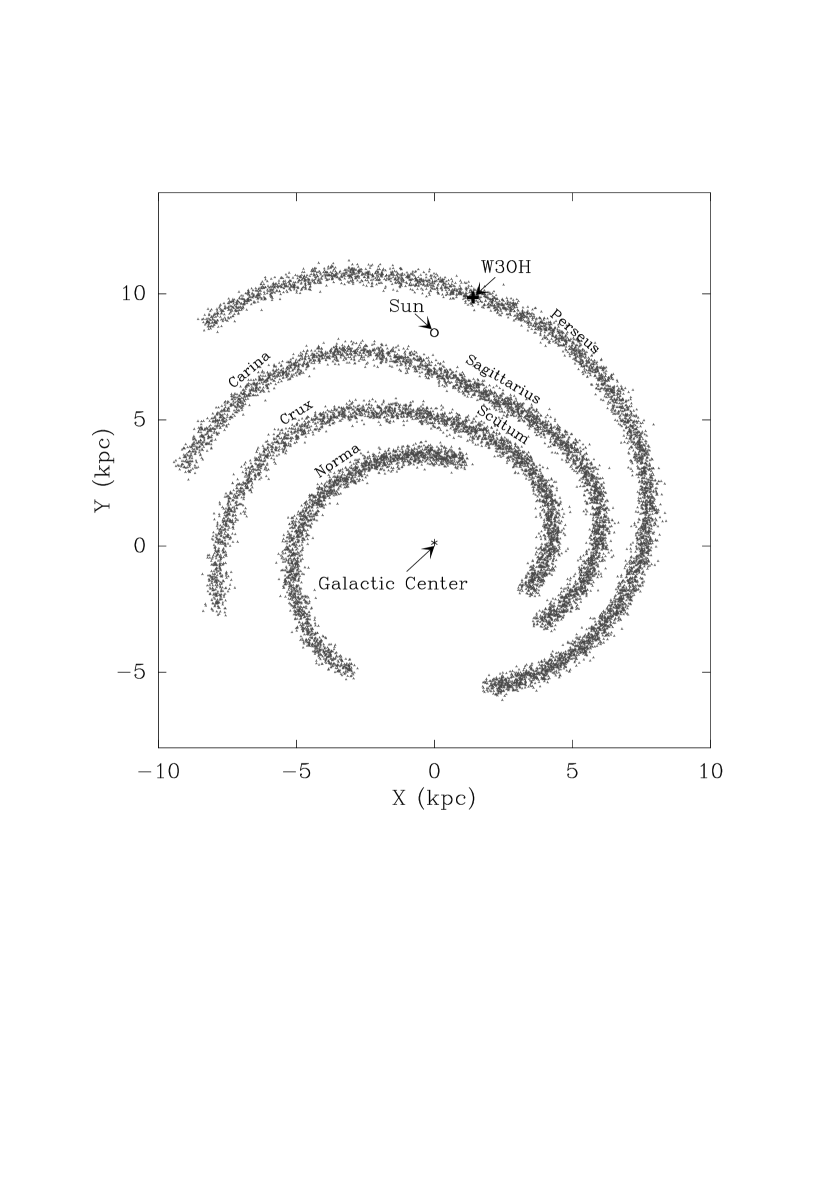
The Perseus arm is the nearest spiral arm outward from the Sun, as shown in Fig. 1 [2, 3]. There are many star-forming regions in the Perseus arm for which distances have been estimated from the difference between the observed and intrinsic luminosities of massive, young (O-type) stars. Toward Galactic longitudes 132 – 138∘, such luminosity distance estimates are kpc [4]. However, kinematic distances for these regions are much greater. Stars and gas in this region of the Perseus arm are observed to move with line-of-sight velocities of about km s-1, relative to the Local Standard of Rest (LSR) [5]. Assuming that the Milky Way rotates at 220 km s-1, independent of distance from its center, and that the Sun is at a distance of 8.5 kpc from the center [6], the observed Perseus arm velocities occur at distances of kpc. The discrepancy between distances based on stellar luminosities and velocities has never been resolved.
The problem of the distance to the Perseus arm can be resolved by determining an accurate distance to a massive star-forming region in the arm. The best and most reliable method for measuring distance in astronomy is called a trigonometric parallax. A trigonometric parallax is determined by observing the change in position of star, relative to very distant objects such as quasars, as the Earth moves in its orbit about the Sun. The parallax is simply the maximum angular deviation of the apparent position from its average position over a year. The deviation in position of a source over a year is very small. For example, the parallax for a source at a distance of 2 kpc, or about one-quarter of the distance to the center of the Milky Way, is only 0.5 milli-arcsecond (mas).
The distance, , to a source is easily calculated from its parallax, , by triangulation: . Thus, one needs a measurement accuracy of 0.05 milli-arcseconds (mas) to achieve 10% accuracy for a source at 2 kpc distance, which would be sufficient to resolve the Perseus arm discrepancy. By comparison, trigonometric parallaxes obtained by the Hipparcos satellite [7] typically have uncertainties of only mas, which is inadequate for our purposes.
An ideal candidate for a trigonometric parallax measurement is the massive star forming region W3OH, located at Galactic longitude and near O-type star associations. W3OH has strong methanol masers [8], which can serve as bright, relatively stable, beacons for astrometric observations at radio wavelengths. In this paper, we describe observations with the Very Long Baseline Array (VLBA), consisting of ten radio telescopes spanning the Earth from Hawaii to New England to the Virgin Islands and operated by the National Radio Astronomy Observatory [9], which allowed us to achieve an extraordinarily accurate (0.01 mas) parallax for W3OH and to resolve the long-standing problem of the distance to the Perseus arm. Our results also provide valuable information to test spiral density-wave models of the Milky Way.
We observed W3OH and three compact extragalactic radio sources for 8 hours on each of five epochs in order to measure the position of W3OH (using its methanol masers as astrometric targets) relative to extragalactic radio sources. The dates of observation were 2003 July 30 and October 21, and 2004 January 30, April 23, and July 25. These dates well sample the peaks and nulls of the sinusoidal trigonometric parallax signature, caused by observing the source at different positions in the Earth’s orbit about the Sun. This sampling ensures that we can separate the linear proper motion (caused by projections of Galactic rotation, as well as the peculiar motion of W3OH and the Sun) from the sinusoidal parallax effect.
We switched rapidly among W3OH and the background sources, repeating the following pattern: W3OH, J0235+622, W3OH, J0231+628, W3OH, J0230+621. Sources were changed every 40 s, typically achieving 30 s of on-source data each time. We used a methanol maser as the phase-reference source, because it is considerably stronger than the background sources and could be detected on individual interferometer baselines with signal-to-noise ratios exceeding in the available on-source time.
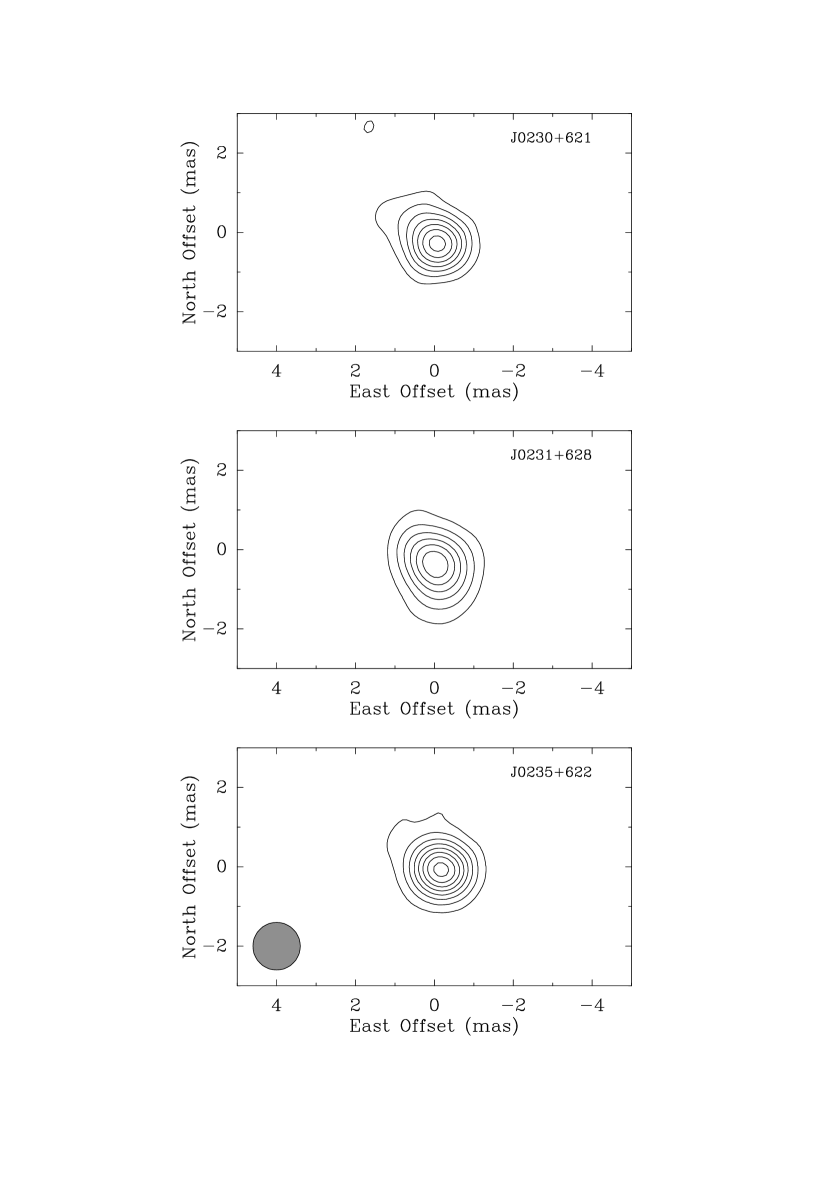
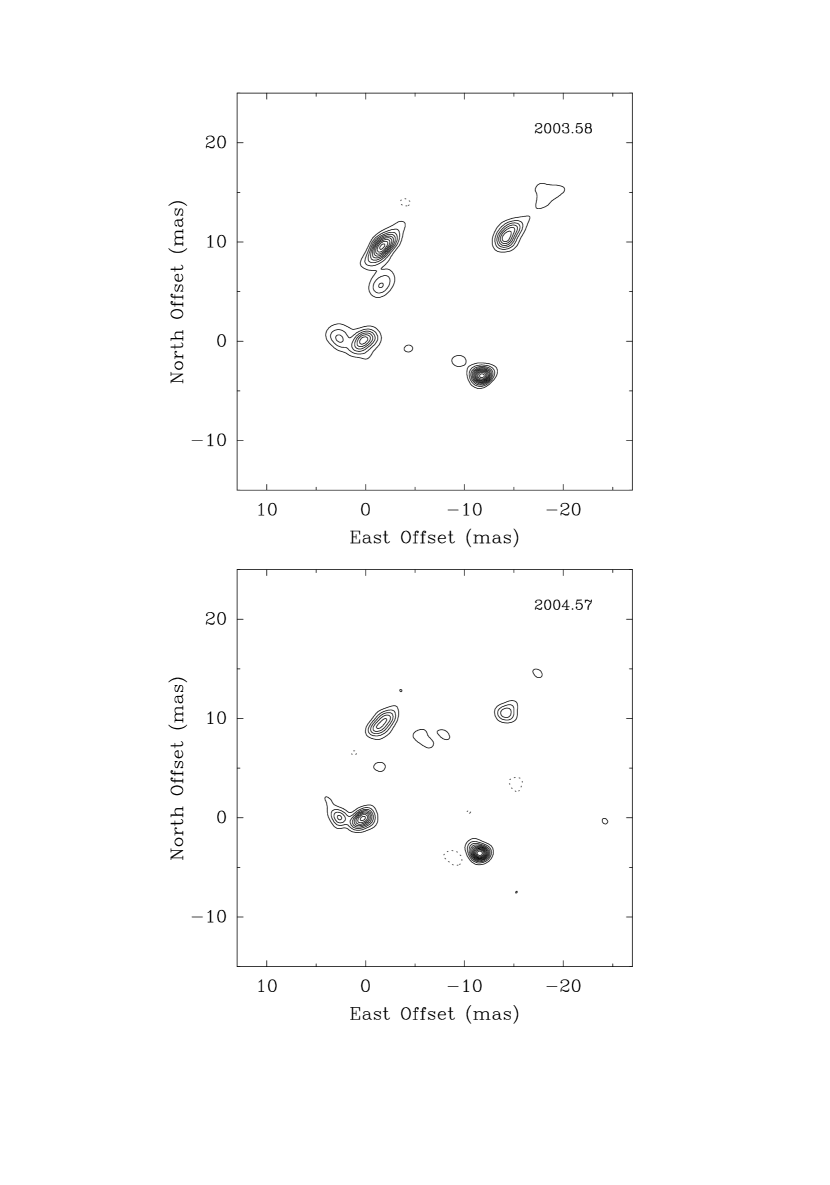
We discuss details of the calibration procedures in supporting online material. After calibration, we made an image of a strong reference maser channel. We show the first and last epoch images of the reference spectral channel at a LSR velocity, , of km s-1 in Fig. 2. One can see that there is little change in the masers over a year. In Fig. S1 we show an image at one epoch of each of the background radio sources. All three background sources are compact ( mas) and dominated by a single component.
In order to provide the data needed to measure the parallax and proper motion (on the plane of the sky), we fitted 2-dimensional Gaussian brightness distributions to the nine brightest maser spots and the three background radio sources for all five epochs. In Fig. 3 we plot the positions of one maser spot in W3OH relative to the three background radio sources. The change in position of a maser spot relative to a background radio source was then modeled by the parallax sinusoid in each coordinate, completely determined by one parameter (the parallax), and a linear proper motion in each coordinate. Tables 1 and 2 list the parameters of the fits.
An unweighted average parallax for the nine maser spots of W3OH measured against each of the background sources yields parallax estimates of mas using J0230+621, mas using J0231+628, and mas using J0235+622. These results are consistent within their formal errors, and a weighted average of these three parallaxes yields mas.
The parallaxes from the three calibrators increase slightly with increasing maser–calibrator separation, suggesting that atmospheric systematics may not have been entirely removed. However, with only three calibrators it is difficult to assess the significance of this effect. In order to allow for the possibility of some uncompensated atmospheric systematics, we estimate a systematic component of the parallax uncertainty of 0.007 mas. Thus, our final parallax estimate is mas. The statistical and systematic uncertainties are independent and combining them quadratically yields a parallax of and, hence, a distance of kpc.
Our trigonometric parallax estimate is consistent with a similar measurement of kpc using H2O masers associated with the Turner-Welch (TW) object, a proto-stellar object projected 5 arcsec from W3OH [15]. These distances for W3OH in the Perseus spiral arm conclusively resolve the long-standing discrepancy between its kinematic distance of 4.3 kpc and a luminosity distance of kpc, based on O-type stars nearby in the same spiral arm, [4]. The luminosity distance is consistent with the trigonometric parallaxes, and W3OH must have a large kinematic anomaly.

Table 2 presents the proper motion results. The individual proper motions span a range of about 0.3 and 0.2 mas y-1 (or 3 and 2 km s-1) in the eastward and northward directions. This is comparable to the spread in hydroxyl (OH) maser proper motions from the same region of W3OH [10]. Thus, the dispersion in the proper motions is likely to come both from small internal motions of the maser spots of a few km s-1 and from measurement error of mas y-1( km s-1). Because of the limited number of methanol masers mapped and the small velocity spread expected for methanol masers (based on the close correspondence with OH masers), we make no attempt to fit an expanding model to the data.
The mean proper motion in the eastward and northward directions, obtained from an unweighted average of all the data, is and mas y-1, respectively, where the uncertainties are standard errors of the mean. Thus, the uncertainty in the mean proper motion translates to an impressive 0.2 km s-1 at a distance of 1.95 kpc. Allowing for a spread of km s-1 for the internal motions of the masers, we adopt a uncertainty of 1 km s-1 in each component of the average of our motions.
In order to study the 3-dimensional motion of W3OH in the Galaxy, we converted its radial and proper motion from the equatorial, heliocentric, reference frame in which they are measured into a Galactic reference frame. A convenient Galactic frame is one moving with a circular velocity about the center of the Galaxy at the position of W3OH, i.e., a “local standard of rest” for W3OH. We followed published methods [11], adopting the International Astronomical Union standard values for the distance from the Sun to the Galactic Center of 8.5 kpc and for the rotation speed of the LSR about the Galactic Center of 220 km s-1. When removing the peculiar motion of the Sun relative to the LSR, we adopted solar motion values determined by Hipparcos [12].
The Galactocentric distance of W3OH is 9.95 kpc, and its rotation velocity about the Galactic Center is km s-1. This velocity uncertainty is far above our measurement error and is dominated by an uncertainty of about km s-1 for the rotation speed of the Galaxy. However, the difference in the rotation velocities of the Sun and W3OH is largely insensitive to the value adopted for Galaxy’s rotation speed. Assuming a constant rotation speed in the Galaxy between the 8.5 and 9.95 kpc (the Galactocentric radii of the Sun and W3OH), the difference between the rotation speed of W3OH and the Galaxy is km s-1 in the sense that W3OH is orbiting slower than the Galaxy spins. The motion of W3OH toward the Galactic Center is km s-1. The motion of W3OH toward the north Galactic pole is km s-1. Combining the three components, the total peculiar motion of W3OH is 22 km s-1. Essentially all of the peculiar motion is in the plane of the Galaxy, as expected for a massive star-forming region.
Note that for an axially symmetric distribution of mass in the Galaxy, rotational velocities cannot fall more rapidly with Galactocentric radius, , than . The 14 km s-1 slower rotation of W3OH, compared to its local standard of rest, would therefore require essentially no mass between the Galactocentric radius of the Sun (8.5 kpc) and W3OH (9.95 kpc). This seems unlikely and provides motivation for a non-axisymmetric mass distribution, such as provided by spiral density-wave theory.
Spiral density waves might be able to account for some of the peculiar motion of W3OH. In order to maintain a spiral density wave, material flowing into a trailing arm would be expected to acquire motion components inward and counter to Galactic rotation [13] as we have observed. However, for density contrasts between arm and interarm regions of %, peculiar velocity components of only km s-1 are expected. This is smaller than we observe for W3OH. However, calculations suggest that a spiral shock embedded in a background density wave might lead to velocity jumps in molecular material of the magnitude that we observe for W3OH [14].
Gravitational forces from nearby forming stars, such as the TW object, and massive molecular clouds should contribute km s-1 to the motion of W3OH. Indeed, the TW object has been observed to move at km s-1 with respect to W3OH [15]. Depending on the relative masses of these and other stars and gas in the region, some of the 22 km s-1 peculiar motion of W3OH might be explained by local gravitational effects. Additionally, the giant molecular cloud material that existed prior to the formation of the stars in the W3OH region could have been accelerated by shocks associated with supernovae in the region [16-18]. Overall, it remains to be seen if one can account for the peculiar motion of W3OH in the context of the spiral density-wave paradigm.
We have established that the VLBA can achieve a parallax accuracy of 0.01 mas and proper motion accuracy of better than 1 km s-1 for Galactic sources with only 5 observations spanning one year. With this accuracy, the VLBA can be used to measure distances to 10 kpc with better than 10% accuracy, approximately a factor of 100 better than the Hipparcos satellite. Based on these results, we believe that the VLBA, and ultimately the Japanese Very Long Baseline Interferometric project VERA (VLBI Exploration of Radio Astrometry, [19]), can map the spiral structure and full kinematics of massive star forming regions in the Milky Way.
References and Notes
1. V. L. Fish, M. J. Reid, D. J. Wilner, E. Churchwell, 587, 701 (2003)
2. Y. M. Georgelin, Y. P. Georgelin, 49, 57 (1976)
3. J. H. Taylor, J. M. Cordes, 411, 674 (1993)
4. R. M. Humphreys, 38, 309 (1978)
5. The LSR is a reference frame at the position of the Sun and
moving in a circle about the center of the Milky Way; in practice this
frame is determined from the average motion of large numbers of stars in
the solar neighborhood.
6. F. J. Kerr, D. Lynden-Bell, 221, 1023 (1986)
7. M. A. C. Perryman, et al. 323, L49 (1997)
8. K. M. Menten, M. J. Reid, J. M. Moran, T. L. Wilson, K. J. Johnston,
W. Batrla, 333, L83 (1988);
L. Moscadelli, K. M. Menten, C. M. Walmsley, M. J. Reid, 519, 244 (1999)
9. The National Radio Astronomy Observatory is operated by Associated
Universities Inc., under cooperative agreement with the National Science
Foundation.
10. near the origin in the maps of E. E. Bloemhof, M. J. Reid, J. M. Moran,
397, 500 (1992)
11. D. R. H. Johnson, D. R. Soderblom, 93, 864 (1987)
12. W.Dehnen, J. J. Binney, 298,387 (1998)
13. C. C. Lin, C. Yuan, F. H. Shu, 155, 721 (1969)
14. W. W. Roberts, 259, 283 (1972)
15. K. Hachisuka, et al. to appear in (2006)
16. B. Dennison, G. A. Topasna, J. H. Simonetti, 474, L31 (1997)
17. R. J. Reynolds, N. C. Sterling, L. M. Haffner, 558, L101 (2001)
18. M. S. Oey, A. M. Watson, K. Kern, G. L. Walth, 129, 393 (2005)
19. M. Honma, N. Kawaguchi, T. Sasao, in Proc. SPIE Vol.4015 Radio
Telescope, ed H. R. Butcher, p624 - p631 (2001)
20. YX and XWZ thank the Smithsonian Institution for support through its
visiting scientist program. Research on the structure of the Milky Way
at Nanjing University is supported by the National Science Foundation of
China under grants 10133020 and 10373025.
| Spot | Offset | Offset | VLSR | W3OH/J0230+621 | W3OH/J0231+628 | W3OH/J0235+622 |
|---|---|---|---|---|---|---|
| East | North | Parallax | Parallax | Parallax | ||
| (mas) | (mas) | (km/s) | (mas) | (mas) | (mas) | |
| 1 | -16.502 | -1.317 | -43.5 | |||
| 2 | -0.145 | 0.163 | -43.8 | |||
| 3 | -11.760 | -3.456 | -44.2 | |||
| 4 | 0.179 | 0.113 | -44.2 | |||
| 5 | -7.683 | 8.925 | -44.6 | |||
| 6 | 70.958 | 60.077 | -45.8 | |||
| 7 | 69.766 | -59.651 | -42.3 | |||
| 8 | 69.500 | -59.703 | -42.7 | |||
| 9 | 20.957 | -126.030 | -43.1 |
Note. — Columns 1–4 give the maser spot number, the East and North position offsets (relative to and ), and the LSR velocity, respectively. Columns 5–7 give the parallax estimates for W3OH relative to the three extragalactic sources J0230+621, J0231+628 and J0235+622. Spot 4 is the reference maser; emission from spots 3–5 can be seen in Fig. 2, which displays emission in a single spectral channel centered at km s-1. Positions and parallaxes for other maser spots were determined from images in other spectral channels.
| Spot | W3OH/J0230+621 | W3OH/J0231+628 | W3OH/J0235+622 | |||||
|---|---|---|---|---|---|---|---|---|
| (mas y-1) | (mas y-1) | (mas y-1) | (mas y-1) | (mas y-1) | (mas y-1) | |||
| 1 | ||||||||
| 2 | ||||||||
| 3 | ||||||||
| 4 | ||||||||
| 5 | ||||||||
| 6 | ||||||||
| 7 | ||||||||
| 8 | ||||||||
| 9 | ||||||||
Note. — Column 1 gives the maser spot number. Columns 2 & 3 give the motion on the plane of the sky in the eastward and northward directions, respectively, of a maser relative to the extragalactic source J0230+621. Columns 3 & 4 and 5 & 6 give motions relative to extragalactic sources J0231+628 and J0235+622. Typical uncertainties for individual proper motions are mas y-1. The unweighted mean proper motion for W3OH is mas y-1 ( km s-1) eastward and mas y-1 ( km s-1) northward.
Supporting Online Material
The data were analyzed using the NRAO Astronomical Image
Processing System (AIPS). The calibration sequence included: 1)
parallactic angle, reference source position, and atmospheric
delay error correction (see below); 2) sampler bias, system
temperature and gain curve corrections; 3) electronic
phase-calibration, phase referencing, and self-calibration.
The main source of systematic error for such observations is delays introduced to the signals as they propagate through the Earth’s atmosphere and ionosphere [S1]. Most of the atmospheric delays are removed when the signals recorded at each telescope are cross-correlated in the VLBA processor. However, the model used in the VLBA processor is a seasonally-averaged calculation that does not take into account variations in atmospheric pressure, total water-vapor content, nor the delay induced by the ionosphere. At a frequency of 12 GHz, the processor model will typically be in error by about 0.3 nano-seconds (nsec), corresponding to 10 cm of propagation path length, for sources at high elevation angles.
Following procedures developed recently [S2], we observed about 15 strong extragalactic radio sources from the International Celestial Reference Frame catalog [S3] in rapid succession over a period of about 45 min at the beginning, middle, and end of the observing periods. The positions of these sources are known to better than 1 mas, so as to avoid position errors contributing significantly to the residual interferometric delays. These data were taken at 12 GHz with eight 8-MHz bands that spanned 470 MHz of bandwidth, and residual multi-band delays and fringe rates were calculated for all sources. These data were modeled as resulting from a vertical atmospheric delay and delay-rate, as well as a clock offset and clock drift rate, at each antenna. We estimated the zenith atmospheric delay to an accuracy of about 0.01 nsec, corresponding to 0.3 cm () of path length. Since we placed these observing blocks throughout our observations, we monitored slow changes in the total atmosphere above each telescope. Correcting for these atmospheric/ionospheric delays can result in about a factor of five improvement in relative positions, compared to those obtained by ignoring atmospheric mis-modeling.
When conducting phase-referenced observations, it is important that the position of the reference source is well determined. Since the 12 GHz methanol masers in W3OH are spread over a region of about 1 arcsec, we needed to determine the absolute position of the chosen maser spot. We accomplished this by making a map of the spectral channel containing the maser spot by simply Fourier transforming the data following amplitude calibration and atmospheric model correction, but without phase referencing. This produces a very crude image, which resembles optical speckles, owing to the large phase excursions introduced mostly by short-term fluctuations in the atmospheric/ionospheric path. For our data, the brighter speckles were concentrated in a region of about 30 mas radius, and we were able to estimate the center of the speckles to an accuracy of about 10 mas. We then shifted the maser data to remove the position offset of the reference spot relative to the position used in correlation. After this correction, the absolute position of the reference phase center was at and .
The background sources were selected in two ways. First, we searched the on-line VLBA calibrator database and found two candidates (from the Jodrell Bank–VLA Astrometric Survey), J0235+622 and J0231+628, which were reasonably strong ( mJy and 60 mJy, respectively) and near in angle to W3OH ( and ). Second, we mapped the region within of W3OH with the VLA at wavelengths of 21 and 6 cm in the A-configuration and found a weak compact, flat-spectrum, source (J0230+621) only from W3OH.
Since our three calibrators had position uncertainties larger than about 10 mas, we used the absolute position of the maser reference spot, coupled with our very accurate maser–calibrator offsets, to determine the absolute position of the calibrators. The absolute positions of the calibrators determined in this manner are and for J0230+621, and for J0231+628, and and for J0235+622.
Images of the three extragalactic sources are shown in Fig. S1. All sources are compact ( mas) and dominated by a single component.
References and Notes
S1. M. J. Reid, A. C. S. Readhead, R. C. Vermeulen, R. N. Treuhaft, 524, 816 (1999)
S2. M. J. Reid, A. Brunthaler, 616, 872 (2004)
S3. C. Ma, et al. , 116, 516 (1998)