IRS spectra of two ultraluminous infrared galaxies at
Abstract
We present low-resolution () mid-infrared (8–38 ) spectra of two ultraluminous infrared galaxies with : MIPS J142824.0+352619 and SST24 J142827.19+354127.71. The spectra were taken with the Infrared Spectrograph (IRS) on board the Spitzer Space Telescope. Both objects were discovered in a Spitzer/MIPS survey of the Boötes field of the NOAO Deep Wide-Field Survey (NDWFS).
MIPS J142824.0+352619 is a bright 160 source with a large infrared-to-optical flux density ratio. Previous authors provide evidence for a foreground lens and estimate an amplification of 10, although this factor is presently poorly constrained. The 6.2, 7.7, 11.3, and 12.8 PAH emission bands in its IRS spectrum indicate a redshift of . The large equivalent width of the 6.2 PAH feature indicates that at least 50% of the mid-infrared energy is generated in a starburst, an interpretation that is supported by a large [Ne II]/[Ne III] ratio and a low upper limit on the X-ray luminosity.
SST24 J142827.19+354127.71 has the brightest 24 flux (10.55 mJy) among optically faint () galaxies in the NDWFS. Its mid-infrared spectrum lacks emission features, but the broad 9.7 silicate absorption band places this source at . Optical spectroscopy confirms a redshift of . Given this redshift, SST24 J142827.19+354127.71 has among the largest rest-frame 5 luminosities known. The similarity of its SED to those of known AGN-dominated ULIRGs and its lack of either PAH features or large amounts of cool dust indicate that the powerful mid-infrared emission is dominated by an active nucleus rather than a starburst.
Our results illustrate the power of the IRS in identifying massive galaxies in the well-known “redshift desert” between and in discerning their power sources. Because they are bright, MIPS J142824.0+352619 (pending future observations to constrain its lensing amplification) and SST24 J142827.19+354127.71 are useful templates of a high luminosity starburst and AGN, respectively.
Subject headings:
galaxies: formation — galaxies: evolution — galaxies: starburst — galaxies: active1. Introduction
Observations at long wavelengths, particularly those made by the Infrared Astronomical Satellite (IRAS) and the Infrared Space Observatory (ISO), have revealed a low-redshift population of galaxies which emit most of their luminosity in the far infrared. Ultraluminous infrared galaxies (ULIRGs; Soifer et al. 1984; Sanders et al. 1988; Sanders & Mirabel 1996), which have far-infrared luminosities greater than , represent the luminous tail of this population. Infrared number counts and the cosmic infrared background provide strong evidence that the ULIRG population becomes progressively more important at high redshift (Dole et al. 2001; Elbaz et al. 2002; Le Floc’h et al. 2004). In addition, submillimeter galaxies (SMGs) have been revealed as likely ULIRG analogs at high redshift (Smail et al. 1997; Barger et al. 1998; Hughes et al. 1998; Ivison et al. 1998; Eales et al. 2000; Scott et al. 2002). However, although the energy generation mechanisms of these extremely luminous objects have been a topic of great interest and study, the relative fraction of high redshift SMGs powered by buried AGN is still a matter of debate, as are the relative contributions of AGN and starbursts to the energy output of ULIRGs at low redshift.
Mid-infrared diagnostics of the energetics of galaxies have been developed using ground-based (Roche et al. 1991) and space-based (Genzel et al. 1998; Lutz 2000; Laurent et al. 2000) observations. In general, the mid-infrared spectra of starbursts are characterized by low-excitation fine structure lines, polycyclic aromatic hydrocarbon (PAH) features, and a weak 3–6 rest-frame continuum. In contrast, the mid-infrared spectra of AGN exhibit high-excitation emission lines, very weak or absent PAHs, and a strong 3–6 rest-frame continuum. Until recently, the sensitivity of available spectrometers has limited the application of these diagnostics to the brightest galaxies at low redshift. The highly sensitive instruments aboard the Spitzer Space Telescope (Werner et al. 2004a), especially the Infrared Spectrograph (IRS; Houck et al. 2004), are powerful tools for performing detailed studies of ULIRGs at higher redshifts than were previously possible with IRAS or ISO.
In order to identify high-redshift ULIRGs for detailed study, the IRS and MIPS instrument teams have completed a mid-infrared imaging survey of the 9 deg2 Boötes region of the NOAO Deep Wide-Field Survey (NDWFS; Jannuzi et al., in preparation). The NDWFS is a imaging survey reaching 3 point-source depths of approximately 27.7, 26.7, 26.0, and 19.6 Vega magnitudes, respectively. In particular, we used the NDWFS Data Release 3 catalog. The mid-infrared imaging was carried out with the Multiband Imaging Photometer for Spitzer (MIPS; Rieke et al. 2004) and reaches 5 limits of 0.28, 35, and 100 mJy at 24, 70, and 160 , respectively. Most (8.5 deg2) of this field has also been surveyed using the Infrared Array Camera (IRAC; Fazio et al. 2004), also aboard Spitzer, to 5 sensitivities of 6.4, 8.8, 51, and 50 Jy at wavelengths of 3.6, 4.5, 5.8, and 8.0 , respectively (Eisenhardt et al. 2004). The ACIS-I instrument (Garmire et al. 2003) aboard the Chandra X-ray Observatory was also used to map the entire Boötes field down to a limiting sensitivity of erg cm-2 s-1 in the energy range 0.5–7 keV (Murray et al. 2005). The Boötes field also overlaps with the 20 cm FIRST Survey, which has a limiting sensitivity of approximately 1 mJy (White et al. 1997).
The NDWFS Boötes field was chosen for the MIPS imaging survey because of its low infrared background and high-quality, deep imaging. These properties allow the selection of mid-infrared sources which are bright enough for IRS spectroscopy but which have very faint optical counterparts, and are therefore likely at high redshift. Houck et al. (2005) describe the results of IRS observations of 30 extreme ( mJy; mag) sources identified in Boötes. The vast majority of the 17 objects for which the mid-infrared spectra yielded redshifts are probably obscured AGN at . We present here a detailed analysis of two objects which were also selected from the Boötes field, but which have unique infrared and optical properties. In particular, we present IRS and optical spectroscopy, and constrain the spectral energy distributions of these objects using data from the previously described multiwavelength Boötes surveys, as well as new submillimeter data.
MIPS J142824.0+352619 (hereafter Source 1) was selected from a catalog of objects that were detected in all three MIPS bands (thus the prefix “MIPS”). Following the naming scheme of Borys et al. (2005), we use the NDWFS -band coordinates111For completeness, the 24 coordinates are , +35261914 (J2000). to form the name of this object. Source 1 was chosen for follow-up because it is bright at 160 ( mJy), has red optical–near-infrared colors (), and is unresolved in the optical. The large 160 flux indicates that Source 1 contains large amounts of cold dust. The red optical–near-infrared colors and compact morphology suggest that it resides at . The combination of the 160 flux and the high redshift implies that Source 1 probably has a large far-infrared luminosity (). Borys et al. (2005) presented the spectral energy distribution (SED) of this object from the optical through the radio. They argued that while the emission shortward of 1 (observed frame) is likely dominated by a lens, the near-infrared emission is dominated by the 24 source. Based on a cool (43 K) dust temperature, adherence to the far-infrared–radio correlation, and the presence of a prominent 1.6 stellar bump, they argued that Source 1 is a dusty starburst. As discussed in §3.1, the IRS spectrum we present provides a rough redshift of . Borys et al. (2005) used this estimate to identify H in the near-infrared spectrum and obtained . In combination with their SED, this redshift confirms a high luminosity of . They also noted that the instrinsic luminosity may be up to a factor of 10 lower if lensing is important. Here we present additional diagnostics to determine the energetics of Source 1.
SST24 J142827.19+354127.71 (hereafter Source 2), was selected from a catalog of objects detected at 24 (thus the prefix “SST24”). Following the convention of Houck et al. (2005), we use the 24 position to derive the name of this object. Source 2 has the brightest 24 flux ( mJy) among mid-infrared sources with faint optical counterparts (). The faint -band magnitude () implies that Source 2 is at high redshift, and the 24 flux indicates a large luminosity.
The plan of this paper is as follows: §2 describes the mid-infrared IRS observations of both sources, as well as optical spectroscopy and submillimeter imaging of Source 2. The results for each object are presented in §3 and §4. Finally, our conclusions are discussed in §5. Throughout, we use the following cosmological parameters: , , and km s-1 Mpc-1.
2. Observations and Data Reduction
2.1. Infrared Spectrograph (IRS)
Both objects were observed with the IRS Short Low (SL) module in first order for a total of 480 seconds and with the Long Low (LL) module in first and second orders for a total of 1920 seconds each. Targets were placed on the slits by performing moderate-accuracy peak-ups on and offsetting from nearby 2MASS stars. Observed two dimensional spectra were processed with version S11.0 of the Spitzer Science Center pipeline. Further processing was carried out using the Basic Calibrated Data (BCD) products from the pipeline. Since the SL data were taken in first order only, a background image for each position (nod) was constructed from data taken in the other position. In contrast, the background images for each LL position were constructed from data taken when the object was in the other order. Extraction of one dimensional spectra corresponding to each position was accomplished with the SMART analysis package (Higdon et al. 2004). The data from each position were then averaged to produce the final spectra, which provide low resolution coverage from 8–38 .
2.2. DEIMOS
Optical spectra of both Source 1 and Source 2 were obtained with the Deep Imaging Multi-Object Spectrograph (DEIMOS; Faber et al. 2003) on the W. M. Keck II 10-meter telescope on the night of UT 2005 May 06. The observations, three 30 minute exposures, were obtained in 0.5” seeing through a 1.0” wide and 10” long slitlet oriented at PA=130. A 600 line mm-1 (7500Å blaze) grating setting with the GG400 blocking filter was used. The central wavelength was set to 7500Å. This corresponds to a 0.65Å per pixel mean spectral dispersion.
The DEEP2 data reduction pipeline222http://alamoana.keck.hawaii.edu/inst/deimos/pipeline.html was used to perform cosmic ray removal, flat-fielding, co-addition, sky-subtraction, and wavelength calibration. The one-dimensional spectra were extracted using standard IRAF routines. Relative spectrophotometric calibration was performed using observations of Wolf 1346 (Massey et al. 1988; Massey & Gronwall 1990; Oke 1990).
The optical spectrum of Source 1 is presented and discussed by Borys et al. (2005).
2.3. SHARC-II
Submillimeter images of Source 2 were taken on UT 2004 April 10–12 with the 350 filter on the SHARC-II camera at the Caltech Submillimeter Observatory. Pointing and flux calibration were performed on nearby Arp 220, and data were reduced using the CRUSH software package (Kovacs 2005). Weather conditions were not optimal, with an average opacity of . The total exposure time was roughly 1 hour. The object was not detected, though we derive a 3 upper limit of 150 mJy.
| MIPS J142824.0+352619 (Source 1) | SST24 J142827.19+354127.71 (Source 1) | |||
| Wavelength | Flux | InstrumentaaMOSAIC-I is an imager at the KPNO 4m, WIRC is the NIR camera at Palomar, SHARC-II is at the CSO, SCUBA is at the JCMT, and ONIS was previously available at the KPNO 2.1m. | FluxbbMissing values indicate that no data were taken at the given wavelength. In particular, although most of the Boötes field was imaged at 70 , Source 2 lies near the edge of the field, outside of the 70 coverage. Limits are provided where data were taken, but no source was detected. | InstrumentaaMOSAIC-I is an imager at the KPNO 4m, WIRC is the NIR camera at Palomar, SHARC-II is at the CSO, SCUBA is at the JCMT, and ONIS was previously available at the KPNO 2.1m. |
| 445 nm () | 0.25 0.03 Jy | MOSAIC-I | 0.98 0.03 Jy | MOSAIC-I |
| 658 nm () | 2.02 0.08 Jy | MOSAIC-I | 2.29 0.10 Jy | MOSAIC-I |
| 806 nm () | 6.21 0.11 Jy | MOSAIC-I | 5.21 0.13 Jy | MOSAIC-I |
| 1.22 () | 31.9 5.3 Jy | WIRC | ||
| 1.63 () | 38.4 5.2 Jy | WIRC | ||
| 2.19 () | 72.4 9.4 Jy | WIRC | 134.8 10.6 Jy | ONIS |
| 3.6 | 250.9 7.2 Jy | IRAC | 296.3 8.9 Jy | IRAC |
| 4.5 | 280.6 8.7 Jy | IRAC | 621.3 18.6 Jy | IRAC |
| 5.8 | 198.3 16.6 Jy | IRAC | 1600.9 48.0 Jy | IRAC |
| 8.0 | 211.1 14.2 Jy | IRAC | 3938.9 118.2 Jy | IRAC |
| 24 | 0.72 0.07 mJy | MIPS | 10.55 0.13 mJy | MIPS |
| 70 | 34 6 mJy | MIPS | ||
| 160 | 430 90 mJy | MIPS | 45 mJy (3) | MIPS |
| 350 | 226 45 mJy | SHARC-II | 150 mJy (3) | SHARC-II |
| 850 | 21.9 1.3 mJy | SCUBA | ||
| 20 cm | 0.937 0.039 mJy | VLAccHigdon et al. (2005) | 0.98 mJy (5) | VLAddFIRST Survey; White et al. (1997) |
Note. — The optical, NIR, and IRAC fluxes are measured in 5 diameter apertures. Total fluxes are reported for the longer wavelength bands. The fluxes for MIPS J142824.0+352619 were taken from Borys et al. (2005).
3. MIPS J142824.0+352619 (Source 1)
3.1. PAH Emission Bands
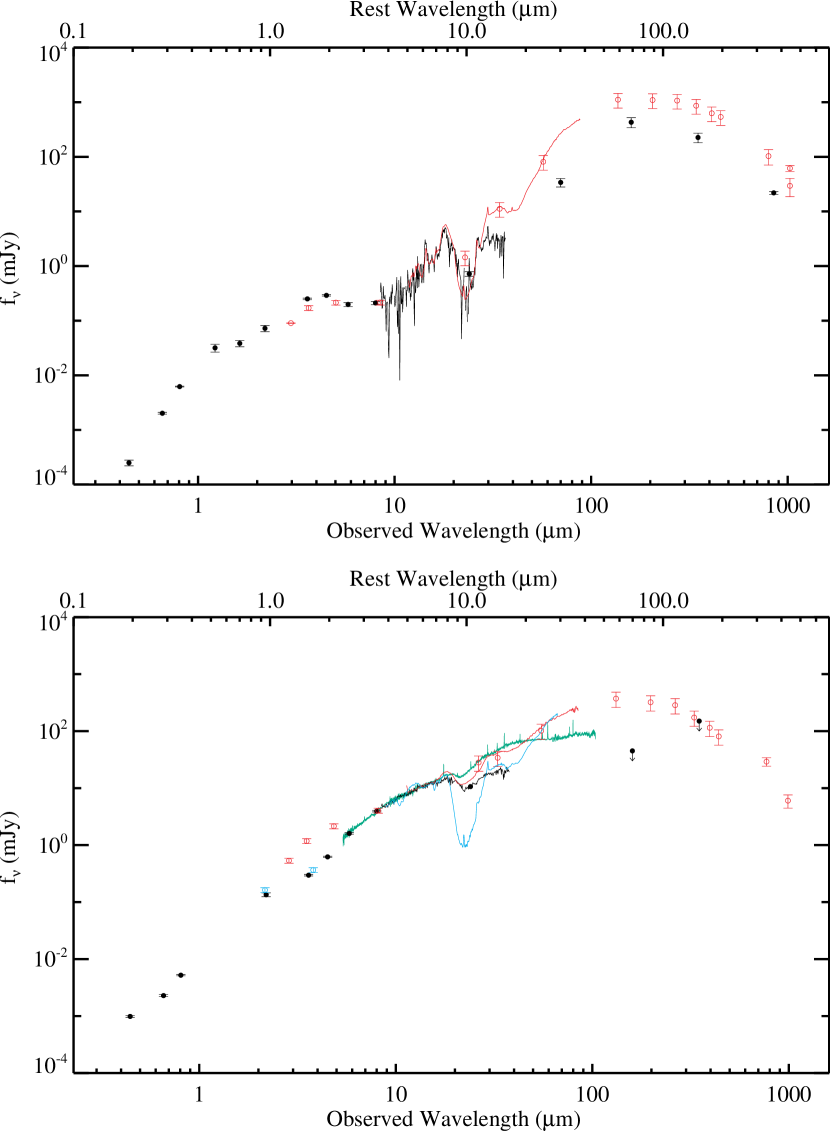
As seen in the top panel of Figure 1, the mid-infrared spectrum of Source 1 is rich in emission features, including the PAH bands at 6.2, 7.7, 11.3, and 12.7 . These features indicate a redshift of . Based on a preliminary reduction of the IRS data, Borys et al. (2005) identified the narrow H and adjacent [N II] lines in a near-infrared spectrum to determine a more accurate redshift of . All plots and calculations herein adopt this more accurate redshift. Based on the optical spectrum, Borys et al. (2005) also considered whether or not the mass of a foreground object in the field is significantly magnifying the background source. Luminosities have not been corrected, since the magnification is unknown.
The PAH features in the IRS spectrum of Source 1 not only provide its redshift, but are also clues to the source of its energy generation. The strength of PAH features roughly correlates with the starburst contribution to the mid-infrared flux (Genzel et al. 1998; Lutz et al. 1998; Rigopoulou et al. 1999; Laurent et al. 2000; Armus et al., in preparation). In the spectrum of Source 1, the 7.7 and 11.3 PAH features are adjacent to the broad 9.7 silicate absorption band, making the continuum at these wavelengths uncertain, while the 12.7 PAH feature is blended with the [Ne II] emission line at 12.8 . We therefore use the 6.2 PAH rest-frame equivalent width () as our primary diagnostic of the starburst contribution to the energy generation.
For Source 1, , 25–50% lower than the typical value measured for nearby starbursts (0.5 – 0.7 ; Brandl et al., in preparation), but much larger than that measured for nearby AGN (0.005 – 0.02 ; Weedman et al. 2005). The equivalent width diagnostic therefore indicates that the mid-infrared spectrum of Source 1 is starburst-dominated.
Compared to local ULIRGs (Armus et al., in preparation), Source 1 has a large 6.2 PAH luminosity of . However, the top panel of Figure 2 shows that this object has strong emission from large amounts of 43K dust. We therefore quantified the contribution of the PAH feature to the bolometric luminosity of the source. For Source 1, , where the error bar includes contributions from the uncertainties in both and . The latter was determined by Borys et al. (2005), and includes uncertainties associated with fitting a modified blackbody to the SED. It does not include an estimate of the range of alternate models that could be used for this fit. Since source structure depends on wavelength, differential magnification as a function of wavelength represents an added complication in measuring .
The value of measured for Source 1 is a factor of 2–3 smaller than that seen in other prototypical starbursts and starburst-dominated ULIRGs, including NGC7714, M82, and UGC5101, which have , , and , respectively. It is within a factor of 1.5 smaller than the values measured for the starburst-dominated ULIRGs recently discovered by Yan et al. (2005), which have and . Given the substantial uncertainties discussed above, the normalized PAH luminosity of Source 1 is consistent with all of these comparison objects.
Recently, Lutz et al. (2005) presented the IRS spectra of two SMGs at . They found that these SMGs appear to be scaled-up versions of local ULIRGs, based on a comparison of their PAH to far-infrared ratios333defined as the ratio of the peak flux density of the continuum-subtracted 7.7 PAH feature to the rest-frame 222 (observed-frame 850 at ) continuum flux density. Using the best-fitting modified blackbody derived for Source 1 by Borys et al. (2005), we find its PAH to far-infrared ratio is . This is very similar to the values reported for the SMGs and local ULIRGs.

3.2. Emission Lines
In addition to PAH features, the mid-infrared spectra of galaxies may contain additional emission features, such as [Ar II] at 6.9 , [Ar III] at 8.9 , [S IV] at 10.5 , [Ne II] at 12.8 , [Ne III] at 15.6 , [Ne VI] at 7.6 , and [Ne V] at 14.3 (all rest wavelengths). The expected positions of these features are marked in Figure 1. Due in part to the low signal-to-noise and resolution of our spectra, many of these lines are not detected. However, it is possible that a blend of [Ar II] and H2 S(5) is detected near 7 , and [Ne II] at 12.8 is clearly seen on top of the broader PAH feature, with a flux of W m-2. We measure a 3 lower limit of [Ne II]/[Ne III] 1.24, a high value which is consistent with those predicted and measured for starbursts (Spinoglio & Malkan 1992; Thornley et al. 2000). Because OB stars cannot ionize Ne IV, the detection of the 14.3 [Ne V] emission line would imply the presence of an AGN. Although we do not detect this line, our 3 upper limit ( W m-2) implies [Ne V] 14.3 / [Ne II] 12.8 . It is not uncommon for AGN to exhibit similar ratios (Weedman et al. 2005), so this limit cannot rule out the presence of an AGN in Source 1.
3.3. Absorption
The mid-infrared spectrum of Source 1 displays a broad silicate absorption trough near 9.7 . It is difficult to accurately estimate a silicate optical depth for a PAH-dominated spectrum because of the uncertainty in determining the continuum level. Using a simple procedure, we assume a power-law continuum between the measured flux densities at 5.5 and 14.5 (rest-frame). The 5.5 continuum anchor point lies sufficiently shortward of the 6.2 PAH feature to remain free of PAH emission. In addition, Source 1 shows no evidence of water ice or hydrocarbon absorption, which are sometimes seen in ULIRG spectra at these wavelengths. Our long wavelength continuum anchor is well beyond both the 12.7 PAH feature and the (unobserved) 12.8 [Ne II] emission line. At 14.5 , ULIRG spectra are dominated by thermal emission from warm, small grains (see §3.4). This procedure yields an optical depth of , presented as a lower limit because of the unknown extinction at the chosen continuum points. Adopting the extinction law of Draine (2003), our limit on implies mag. This large visual extinction may explain why the optical spectrum indicates a different redshift than the mid-infrared spectrum (Borys et al. 2005).
3.4. Continuum at
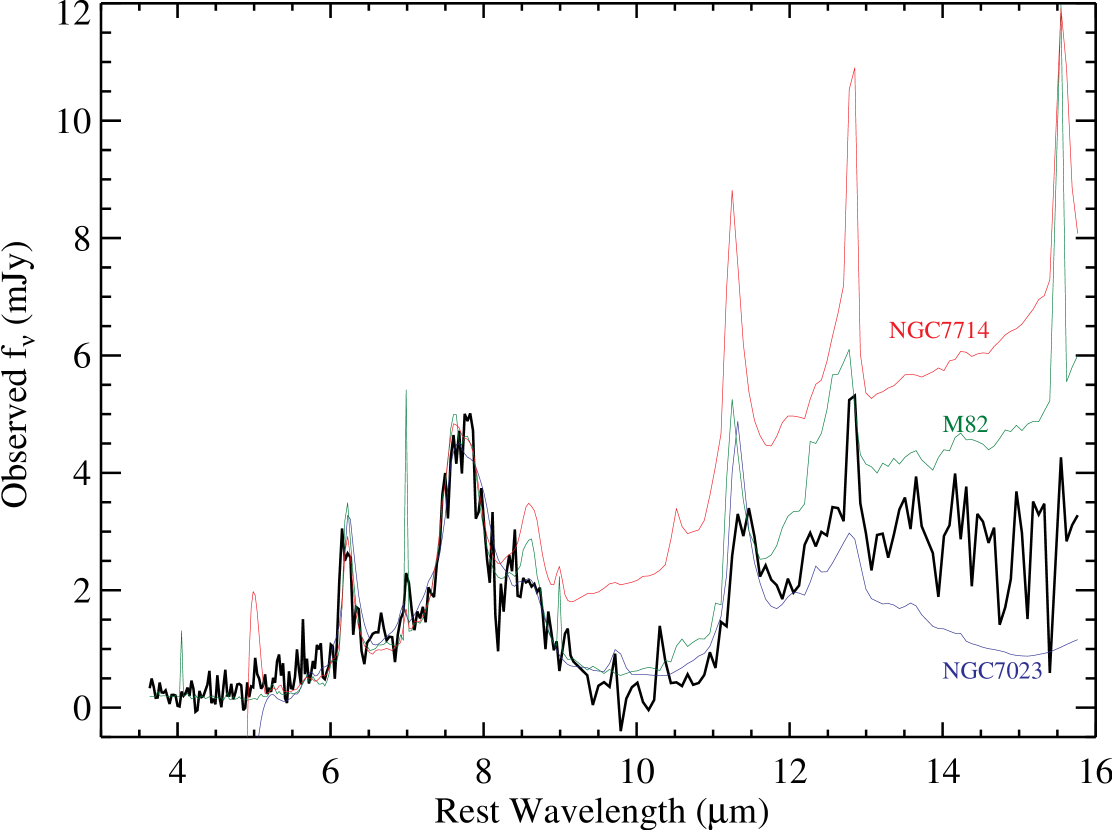
The mid-infrared spectra of galaxies can be modeled as combinations of the spectra of H II regions; the photo-dissociation regions (PDRs) around H II regions; and AGN-heated dust (Laurent et al. 2000). As we showed in §3.1, Source 1 is powered primarily by a starburst. Thus, we would expect its mid-infrared spectrum to be dominated by PAH-rich PDRs and H II regions, which typically exhibit steeply rising continua at 12–16 due to very small grains with radii less than 10 nm (VSGs; Desert et al. 1990). In Figure 3, we compare the mid-infrared spectrum of Source 1 with those of the unobscured Galactic reflection nebula NGC7023 (pure PDR; Werner et al. 2004b) and the prototypical starbursts NGC7714 (Brandl et al. 2004) and M82 (Sturm et al. 2000). All three spectra are similar at rest-wavelengths shortward of 8 . Like most starbursts, NGC7714 and M82 have strong VSG continua which set in longward of 8 . However, the mid-infrared spectrum of Source 1 has only a weak VSG continuum.
3.5. Multiwavelength Photometry
A large hard X-ray flux can indicate the presence of an AGN. Source 1 was not detected in a 5 ks Chandra survey of the Boötes field (Murray et al. 2005). This non-detection corresponds to an upper limit of for neutral Hydrogen column densities of cm-2, assuming a Galactic column density of cm-2 and a power law spectrum with photon index . This limit is consistent with the values of measured for starburst-dominated galaxies (Ptak et al. 2003). However, we cannot rule out the presence of a Seyfert-like nucleus behind neutral Hydrogen column densities of cm-2.
The shape of the SED also provides information on the power source. Borys et al. (2005) presented the optical to radio SED of Source 1, and argued that it is a starburst based upon its cool dust temperature, adherence to the far-infrared–radio correlation, and the prominence of the 1.6 stellar bump. Using a large spectroscopically-classified sample, Stern et al. (2005) have developed IRAC color criteria for identifying AGN. Interestingly, by these standards, Source 1 would be classified as an AGN. However, those authors point out that their criteria may result in contamination from ULIRGs.
4. SST24 J142827.19+354127.71 (Source 2)

The IRS spectrum of Source 2, shown in the bottom panel of Figure 1, differs dramatically from that of Source 1. The only obvious feature is the broad 9.7 silicate absorption band. Assuming a power-law continuum between 7.8 and 14.5 (rest-frame), we obtain an optical depth of . This corresponds to mag (Draine 2003). As with Source 1, these are lower limits due to the unknown extinction at the continuum points. The placement of the absorption feature also indicates a redshift of . We obtained a more accurate redshift of from the [O II]3727Å emission line in a Keck-DEIMOS optical spectrum (see Figure 4). Unfortunately, no optical spectroscopic diagnostics of the energetics of Source 2 could be identified.
Source 2 has an extremely large mid-infrared luminosity. At 5 (rest-frame), it has . Out of the 17 objects with redshifts from the Houck et al. (2005) sample, only one (SST24J143001.91+334538.4 at ) has a comparable 5 luminosity. The remainder were either not sampled at 5 (4 sources) or are at least a factor of 2 less luminous. The 5 luminosity of Source 2 is also over an order of magnitude brighter than any of the six ULIRGs observed with the IRS by Yan et al. (2005) and at least a factor of three brighter than even the most luminous local ULIRGs.
The powerful soft X-ray and ultraviolet radiation associated with an AGN may destroy PAH carriers (e.g. Aitken & Roche 1985; Voit 1992). The lack of PAH features in Source 2 ( ; 3) suggests that its luminosity is generated primarily by an AGN, since the PAH equivalent width is a factor of 30–40 lower than found in pure starbursts (Brandl et al., in preparation).
The SED of Source 2 is shown in black in the bottom panel of Figure 2. The 8–1000 luminosity is poorly constrained by the available data. However, given its extremely high mid-infrared luminosity, it is likely that Source 2 has . In addition, the optical and near-infrared data do not display a stellar bump, suggesting that this feature is swamped by a hot dust continuum produced by an AGN. For reference, we have overplotted the normalized spectra of F00183-7111 (Spoon et al. 2004), Mrk231 (Weedman et al. 2005; Armus et al., in preparation), and the nucleus of NGC1068 (Sturm et al. 2000). All three objects are probably AGN-dominated with energetically significant circumnuclear star formation, but the AGN-heated dust in F00183-7111 and Mrk231 is deeply obscured, and the NGC1068 spectrum is dominated by nuclear, rather than circumnuclear, emission. Source 2 shows a much smaller silicate absorption than F00183-7111, and its 160 and 350 limits indicate that it has smaller relative amounts of cool dust than either F00183-7111 or Mrk231. Its SED is most similar to that of the nucleus of NGC1068, where we have a direct line-of-sight to the hot dust heated by the AGN.
Source 2 was not detected in the 5 ks Chandra survey, but we are unable to put useful limits on because is poorly constrained. It was also undetected in the 20 cm FIRST Survey (White et al. 1997), providing a 5 upper limit of 0.98 mJy.
5. Conclusions
We have presented the IRS spectra of two ULIRGs selected from the Boötes region of the NDWFS.
Source 1 has a high 6.2 PAH equivalent width, high [Ne II]/[Ne III] ratio, and low . These properties, in combination with the prominent 1.6 stellar bump, cold (43 K) dust temperature, and concordance with the radio-FIR correlation noted by Borys et al. (2005), indicate that Source 1 is dominated by a starburst. With (modulo its unknown lensing amplification), Source 1 is extremely luminous compared to low-redshift starbursts. However, PAH-dominated spectra of comparably luminous objects are beginning to be discovered at (Lutz et al. 2005; Yan et al. 2005). Source 1 may be analogous to these more distant luminous starbursts, but is at a redshift where it is more easily studied in detail. Its use as a template for higher redshift populations rests on our ability to understand its lensing properties (Borys et al. 2005), which will require high-resolution imaging to separate out the contribution from the foreground object.
At a similar redshift, Source 2 is among the most luminous mid-infrared sources known (as measured at 5 , rest-frame). It appears to be powered mainly by an AGN: it has a very small 6.2 PAH equivalent width; exhibits a mid-infrared SED similar to those of AGN-dominated ULIRGs; and lacks large amounts of cool dust, as evidenced by its moderate silicate optical depth and non-detections at 160 and 350 .
The first sizable high-redshift samples of dusty sources observed with the IRS have focused on objects at (Houck et al. 2005; Yan et al. 2005). The submillimeter galaxies also lie at this redshift. Relatively less is known about the population of dusty sources at . This redshift range has been traditionally difficult to access through optical spectroscopy, and has come to be known as the “redshift desert”. Indeed, the optical spectra of both objects and the near-infrared spectrum of Source 1 show very few emission lines. A redshift identification for either source would have been dubious without its mid-infrared IRS spectrum. Nevertheless, a large fraction of the stars in local L∗ galaxies were likely formed in this redshift range (e.g. Dickinson et al. 2003; Drory et al. 2005). Objects such as Source 1 and Source 2 provide examples of how the IRS will allow the identification and detailed study of objects in this critical redshift range.
References
- Aitken & Roche (1985) Aitken, D. K., & Roche, P. F. 1985, MNRAS, 213, 777
- Barger et al. (1998) Barger, A. J. et al. 1998, ApJ, 501, 522
- Borys et al. (2005) Borys, C. et al. 2005, ApJ, submitted
- Brandl et al. (2004) Brandl, B. R. et al. 2004, ApJS, 154, 188
- Desert et al. (1990) Desert, F.-X., Boulanger, F., & Puget, J. L. 1990, A&A, 237, 215
- Dickinson et al. (2003) Dickinson, M., Papovich, C., Ferguson, H. C., & Budavári, T. 2003, ApJ, 587, 25
- Dole et al. (2001) Dole, H. et al. 2001, A&A, 372, 364
- Draine (2003) Draine, B. T. 2003, ARA&A, 41, 241
- Drory et al. (2005) Drory, N., Salvato, M., Gabasch, A., Bender, R., Hopp, U., Feulner, G., & Pannella, M. 2005, ApJ, 619, L131
- Eales et al. (2000) Eales, S., Lilly, S., Webb, T., Dunne, L., Gear, W., Clements, D., & Yun, M. 2000, AJ, 120, 2244
- Eisenhardt et al. (2004) Eisenhardt, P. R. et al. 2004, ApJS, 154, 48
- Elbaz et al. (2002) Elbaz, D., Cesarsky, C. J., Chanial, P., Aussel, H., Franceschini, A., Fadda, D., & Chary, R. R. 2002, A&A, 384, 848
- Faber et al. (2003) Faber, S. M. et al. 2003, in Instrument Design and Performance for Optical/Infrared Ground-based Telescopes. Edited by Iye, Masanori; Moorwood, Alan F. M. Proceedings of the SPIE, Volume 4841, pp. 1657-1669 (2003)., 1657–1669
- Fazio et al. (2004) Fazio, G. G. et al. 2004, ApJS, 154, 10
- Garmire et al. (2003) Garmire, G. P., Bautz, M. W., Ford, P. G., Nousek, J. A., & Ricker, G. R. 2003, in X-Ray and Gamma-Ray Telescopes and Instruments for Astronomy. Edited by Joachim E. Truemper, Harvey D. Tananbaum. Proceedings of the SPIE, Volume 4851, pp. 28-44 (2003)., 28–44
- Genzel et al. (1998) Genzel, R. et al. 1998, ApJ, 498, 579
- Higdon et al. (2005) Higdon, J. L. et al. 2005, ApJ, 626, 58
- Higdon et al. (2004) Higdon, S. J. U. et al. 2004, PASP, 116, 975
- Houck et al. (2004) Houck, J. R. et al. 2004, ApJS, 154, 18
- Houck et al. (2005) —. 2005, ApJ, 622, L105
- Hughes et al. (1998) Hughes, D. H. et al. 1998, Nature, 394, 241
- Ivison et al. (1998) Ivison, R. J., Smail, I., Le Borgne, J.-F., Blain, A. W., Kneib, J.-P., Bezecourt, J., Kerr, T. H., & Davies, J. K. 1998, MNRAS, 298, 583
- Jannuzi & Dey (1999) Jannuzi, B. T., & Dey, A. 1999, in Astronomical Society of the Pacific Conference Series, ed. A. J. Bunker & W. J. M. van Breugel, 111
- Kovacs (2005) Kovacs, A. 2005, Ph.D. Thesis
- Laurent et al. (2000) Laurent, O., Mirabel, I. F., Charmandaris, V., Gallais, P., Madden, S. C., Sauvage, M., Vigroux, L., & Cesarsky, C. 2000, A&A, 359, 887
- Le Floc’h et al. (2004) Le Floc’h, E. et al. 2004, ApJS, 154, 170
- Lutz (2000) Lutz, D. 2000, New Astronomy Review, 44, 241
- Lutz et al. (1998) Lutz, D., Spoon, H. W. W., Rigopoulou, D., Moorwood, A. F. M., & Genzel, R. 1998, ApJ, 505, L103
- Lutz et al. (2005) Lutz, D., Valiante, E., Sturm, E., Genzel, R., Tacconi, L. J., Lehnert, M. D., Sternberg, A., & Baker, A. J. 2005, ApJ, 625, L83
- Massey & Gronwall (1990) Massey, P., & Gronwall, C. 1990, ApJ, 358, 344
- Massey et al. (1988) Massey, P., Strobel, K., Barnes, J. V., & Anderson, E. 1988, ApJ, 328, 315
- Murray et al. (2005) Murray, S. S., et al. 2005
- Oke (1990) Oke, J. B. 1990, AJ, 99, 1621
- Ptak et al. (2003) Ptak, A., Heckman, T., Levenson, N. A., Weaver, K., & Strickland, D. 2003, ApJ, 592, 782
- Rieke et al. (2004) Rieke, G. H. et al. 2004, ApJS, 154, 25
- Rigopoulou et al. (1999) Rigopoulou, D., Spoon, H. W. W., Genzel, R., Lutz, D., Moorwood, A. F. M., & Tran, Q. D. 1999, AJ, 118, 2625
- Roche et al. (1991) Roche, P. F., Aitken, D. K., Smith, C. H., & Ward, M. J. 1991, MNRAS, 248, 606
- Sanders & Mirabel (1996) Sanders, D. B., & Mirabel, I. F. 1996, ARA&A, 34, 749
- Sanders et al. (1988) Sanders, D. B., Soifer, B. T., Elias, J. H., Madore, B. F., Matthews, K., Neugebauer, G., & Scoville, N. Z. 1988, ApJ, 325, 74
- Scott et al. (2002) Scott, S. E. et al. 2002, MNRAS, 331, 817
- Smail et al. (1997) Smail, I., Ivison, R. J., & Blain, A. W. 1997, ApJ, 490, L5+
- Soifer et al. (1984) Soifer, B. T. et al. 1984, ApJ, 278, L71
- Spinoglio & Malkan (1992) Spinoglio, L., & Malkan, M. A. 1992, ApJ, 399, 504
- Spoon et al. (2004) Spoon, H. W. W. et al. 2004, ApJS, 154, 184
- Stern et al. (2005) Stern, D. et al. 2005, ApJ, 631, 163
- Sturm et al. (2000) Sturm, E., Lutz, D., Tran, D., Feuchtgruber, H., Genzel, R., Kunze, D., Moorwood, A. F. M., & Thornley, M. D. 2000, A&A, 358, 481
- Thornley et al. (2000) Thornley, M. D., Schreiber, N. M. F., Lutz, D., Genzel, R., Spoon, H. W. W., Kunze, D., & Sternberg, A. 2000, ApJ, 539, 641
- Voit (1992) Voit, G. M. 1992, MNRAS, 258, 841
- Weedman et al. (2005) Weedman, D. W., Hao, L., Higdon, S. J. U., Wu, Y., Charmandaris, V., Brandl, B., Bass, E., & Houck, J. R. 2005, astro-ph/0507423
- Werner et al. (2004a) Werner, M. W. et al. 2004a, ApJS, 154, 1
- Werner et al. (2004b) Werner, M. W., Uchida, K. I., Sellgren, K., Marengo, M., Gordon, K. D., Morris, P. W., Houck, J. R., & Stansberry, J. A. 2004b, ApJS, 154, 309
- White et al. (1997) White, R. L., Becker, R. H., Helfand, D. J., & Gregg, M. D. 1997, ApJ, 475, 479
- Yan et al. (2005) Yan, L. et al. 2005, ApJ, 628, 604