Planets in Stellar Clusters Extensive Search. IV. A detection of a possible transiting planet candidate in the open cluster NGC 2158.11affiliation: Based on data from the FLWO 1.2m telescope
Abstract
We have undertaken a long-term project, Planets in Stellar Clusters Extensive Search (PISCES), to search for transiting planets in open clusters. In this paper we present the results for NGC 2158, an intermediate age, populous cluster. We have monitored the cluster for over 260 hours, spread over 59 nights. We have detected one candidate transiting low luminosity object, with eclipse depth of 3.7% in the -band. If the host star is a member of the cluster, the eclipse depth is consistent with a 1.7 object. Cluster membership of the host is supported by its location on the cluster main sequence (MS) and its close proximity to the cluster center (2′). We have discovered two other stars exhibiting low-amplitude (4-5%) transits, V64 and V70, but they are most likely blends or field stars. Given the photometric precision and temporal coverage of our observations, and current best estimates for the frequency and radii of short-period planets, the expected number of detectable transiting planets in our sample is 0.13. We have observed four outbursts for the candidate cataclysmic variable V57. We have discovered 40 new variable stars in the cluster, bringing the total number of identified variables to 97, and present for them high precision light curves, spanning 13 months.
1 Introduction
We have undertaken a long-term project, Planets in Stellar Clusters Extensive Search (PISCES), to search for transiting planets in open clusters. To date we have published a feasibility study based on one season of data for NGC 6791 (Mochejska et al. 2002, hereafter Paper I) and a catalog of 57 variable stars for our second target, NGC 2158, based on the data from the first observing season (Mochejska et al. 2004, hereafter Paper II). We have also published the results of an extensive search for transiting planets in NGC 6791, based on over 300 hours of observations, spread over 84 nights (Mochejska et al. 2005, hereafter Paper III). We have not detected any promising candidates, and derived an estimate of 1.7 expected transiting planets.
In this paper we present the results of a search for transiting planets in the open cluster NGC 2158 . It is a very populous, intermediate age (=2-3 Gyr), rather metal poor ([Fe/H]=-0.46) open cluster, located at a distance of 3.6 kpc (Carraro et al. 2002, hereafter Ca02; Christian, Heasley and Janes 1985).
Searching for planets in open clusters eliminates the problem of false detections due to blended eclipsing binary stars, which are a significant contaminant in the Galactic field searches (over 90% of all candidates; Konacki et al. 2003; Udalski et al. 2002a, 2002b). Blending causes a large decrease of the depth of the eclipses and mimics the transit of a much smaller object, such as a planet. As opposed to dense star fields in the disk of our Galaxy, open clusters located away from the galactic plane are sparse enough for blending to be negligible.
There are two key elements in a survey for transiting planets. The most commonly emphasized requirement is the high photometric precision, at the 1% level. The more often overlooked factor is the need for very extensive temporal coverage.
Extensive temporal coverage is important because even for planets with periods between 1 and 2 days, the fractional transit length is only 5% of the period, and it drops to 2% for periods 2-10 days. During the remaining 95-98% of the period the system is photometrically indistinguishable from stars without transiting planets. To our best knowledge, PISCES is the most extensive search for transiting planets in open clusters in terms of temporal coverage with a 1 m telescope.
The paper is arranged as follows: §2 describes the observations, §3 summarizes the reduction procedure, §4 outlines the search strategy for transiting planets, §5 gives an estimate of the expected number of transiting planet detections and §6 contains the variable star catalog. Concluding remarks are found in §7.
2 Observations
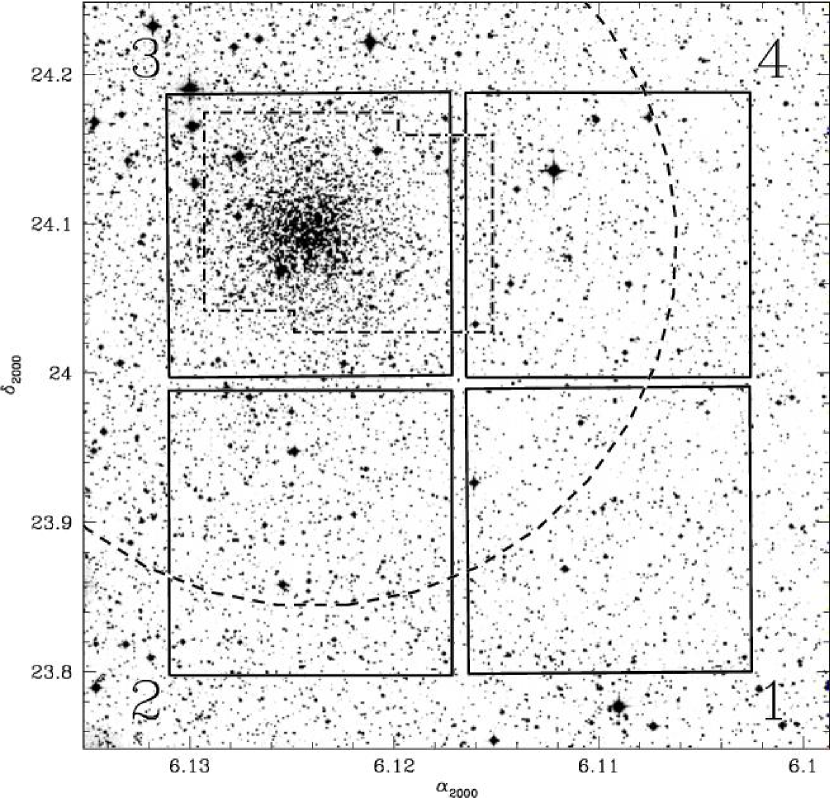
The data analyzed in this paper were obtained at the Fred Lawrence Whipple Observatory (FLWO) 1.2 m telescope using the 4Shooter CCD mosaic with four thinned, back side illuminated AR coated Loral CCDs (Szentgyorgyi et al. in preparation). The camera, with a pixel scale of pixel-1, gives a field of view of for each chip. The cluster was centered on chip 3 (Fig. 1). The data were collected during 59 nights, from 2003 January 3 to 2004 February 17. A total of s and s -band exposures were obtained.
3 Data Reduction
3.1 Image Subtraction Photometry
The preliminary processing of the CCD frames was performed with the standard routines in the IRAF ccdproc package.111IRAF is distributed by the National Optical Astronomy Observatories, which are operated by the Association of Universities for Research in Astronomy, Inc., under cooperative agreement with the NSF.
Photometry was extracted using the ISIS image subtraction package (Alard & Lupton 1998; Alard 2000), as described in detail in Papers I and III.
The ISIS reduction procedure consists of the following steps: (1) transformation of all frames to a common coordinate grid; (2) construction of a reference image from several of the best exposures; (3) subtraction of each frame from the reference image; (4) selection of stars to be photometered and (5) extraction of profile photometry from the subtracted images.
We used the same parameters for image subtraction as in Paper III. The reference images were constructed from 25 best exposures in and 12 in .

3.2 Calibration
To calibrate the photometry we used two photometric catalogs: Ca02 and Kharchenko et al. 1997 (hereafter KAS97). The CCD photometry from Ca02 has higher accuracy, while the photographic catalog from KAS97 overlaps all four chips, but it has a different zeropoint and larger internal scatter, as described in Paper II.
The -band photometry was calibrated from the photometry published by Ca02. We used 1685 stars above to determine the zero point of the magnitude scale for chip 3. The rms scatter around the offset was 0.09. Offsets between chip 3 and the remaining chips were determined from an image, taken with chip 3, centered on the center of the array. The number of stars used to determine the offset was 121, 135 and 293 for chips 1, 2 and 4, respectively.
As a consistency check, we compared these offsets with those derived independently between chips 1, 2 and KAS97, and chip 4 and Ca02. The differences in the offsets were 0.215, 0.181, and 0.010, based on 19, 90 and 36 stars, respectively. For chip 4, as expected, there is excellent agreement, while for chips 1 and 2 the different zero point of the two catalogs is apparent.
The -band photometry for chips 1 and 2 was calibrated against KAS97. To determine the zero points we used 19 and 90 stars above 17 mag for chips 1 and 2, respectively. The rms scatter of the residuals was 0.13 on both chips.
The -band photometry for chips 3 and 4 was calibrated against Ca02. The zero points were derived from 1554 and 36 stars above 19 and 20 mag, and the rms scatter of the residuals was 0.09 and 0.06, respectively.
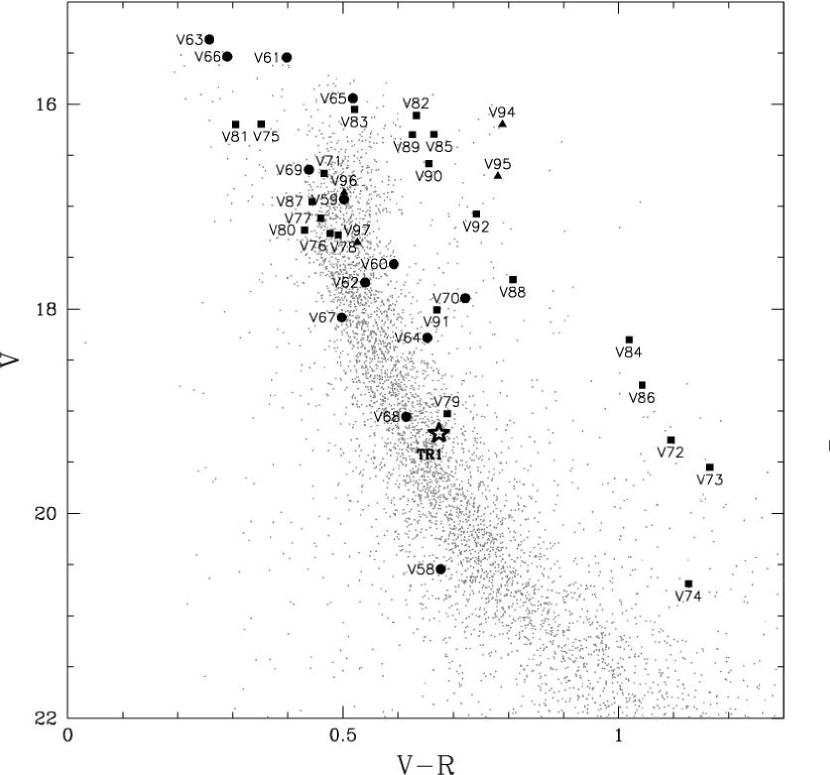
Figure 2 shows the calibrated V/V-R color-magnitude diagram (CMD) for the chip 3 reference image.
3.3 Astrometry
Equatorial coordinates were determined for the -band reference image star lists. The transformation from rectangular to equatorial coordinates was derived using 596, 710, 1952 and 615 transformation stars from the 2MASS catalog (Cutri et al. 2003) in chips 1 through 4, respectively. The rms deviation between the catalog and the computed coordinates for the transformation stars was in right ascension and in declination.
4 Search for Transiting Planets
4.1 Further Data Processing
We rejected from further analysis 96 -band epochs where fewer than 4000 stars were detected on chip 3 by DAOphot (Stetson 1987). We also rejected additional 29 to 31 bad quality images from four nights. For chip 3, which suffers from moderate crowding and contains a significant number of saturated stars, we also rejected additional 78 epochs where the full-width at half-maximum (FWHM) of the stellar point-spread function (PSF) was greater than 10 pixels, and the sky level was over 10,000 ADU. This left us with 807, 809, 729 and 809 highest quality -band exposures on chips 1-4, with a median seeing of . We also removed 6 -band images, which left us with 217 exposures with a median seeing of .
In the NGC 6791 data, analyzed in Paper III, we noticed in the light curves the presence of offsets between different runs. These were probably due to the periodic UV flooding of the CCD camera, which alters its quantum efficiency as a function of wavelength. In the NGC 2158 dataset analyzed here this problem was found to be much less prominent, possibly due to the fact that this data set was obtained over a shorter period of time (12.5 months, compared to 24 months for NGC 6791). To prevent the transit detection algorithm from mistaking these changes in brightness for transits, we corrected the light curves using the method proposed by Tamuz et al. (2005). This algorithm was originally envisioned to correct for color-dependent atmospheric extinction, but can be used to correct for any linear systematic effects. We solve for coefficients and that minimize the following equation:
| (1) |
where is the residual for the observation of the -th star on the -th image, or the star’s average-subtracted magnitude, and is the uncertainty of the measurement of star on image . Following Tamuz et al. (2005), the airmasses were used as initial coefficients. We chose to run this algorithm four times. After the fourth application, the amplitude in and scatter in decreased about two times, relative to the first run. As described in §5.5, this cleaning procedure significantly improves our detection efficiency.
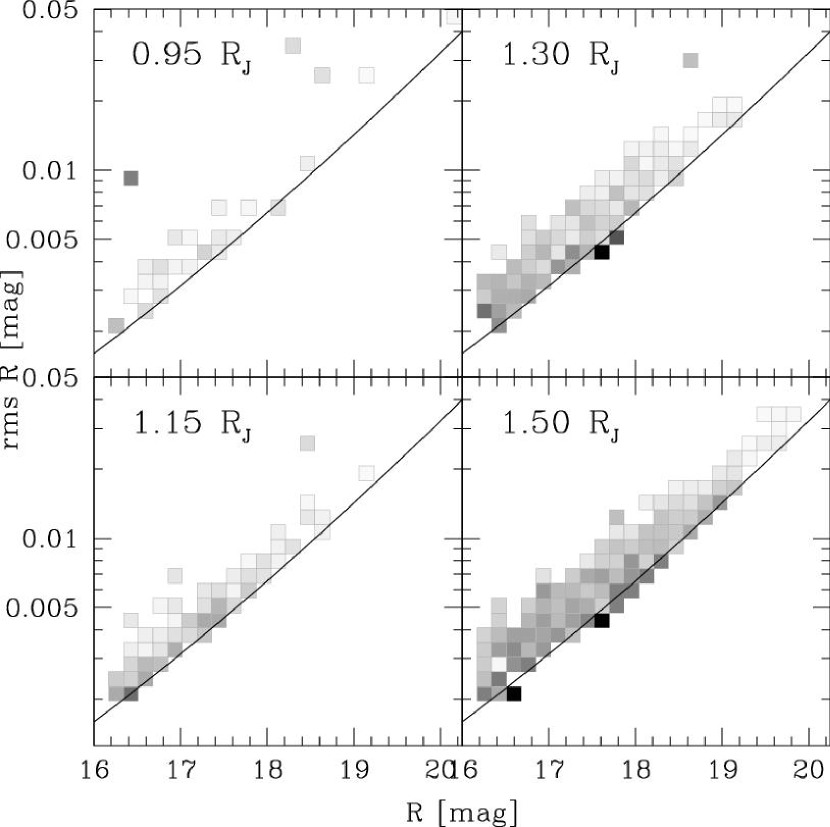
The left panel of Fig. 3 shows the rms scatter of the -band light curves for stars on chip 3 with at least 500 data points. The solid curve indicates the photometric precision limit due to Poisson noise of the star and average sky brightness. The internal scatter of the rms distribution in NGC 2158 is somewhat larger than in NGC 6791 (Fig. 3 in Paper III). This is mostly due to the fact that NGC 2158 is a much more centrally concentrated cluster (it has 27% more stars within the central 1′ than does NGC 6791). Most of the stars with higher than average rms at a given magnitude are located at the cluster center. Also, the average seeing for the NGC 2158 dataset was inferior to the one for NGC 6791: , compared to .
4.2 Selection of Transiting Planet Candidates
For further analysis we selected stars with at least 500 good epochs, magnitudes (the main sequence turnoff; MSTO) and light curve rms below 0.05 mag. This left us with 5159 stars (675, 981, 2680 and 823 stars on chips 1-4, respectively).
To select transiting planet candidates we used the box-fitting least-squares (BLS) method (Kovács, Zucker, & Mazeh 2002). Adopting a cutoff of 6 in Signal Detection Efficiency (SDE) and 9 in effective signal-to-noise ratio (), we selected 70 candidates: 3, 21, 17 and 28 on chips 1 through 4, respectively. Many of the candidates turned out to be known eclipsing binaries, some had sinusoidal light curves or periods which were multiples of a day.
It has been pointed out to us by G. Bákos (private communication) that when the number of transits is small, SDE is not a good statistic. We also examined additional 102 candidates with SDE and (13, 48, 6, 35 on chips 1-4, respectively). Most of the candidates had very discrepant data on one or two nights, most likely due to a nearby saturated star or an unidentified bad column.

4.3 Candidate Transiting Planets/Low Luminosity Objects
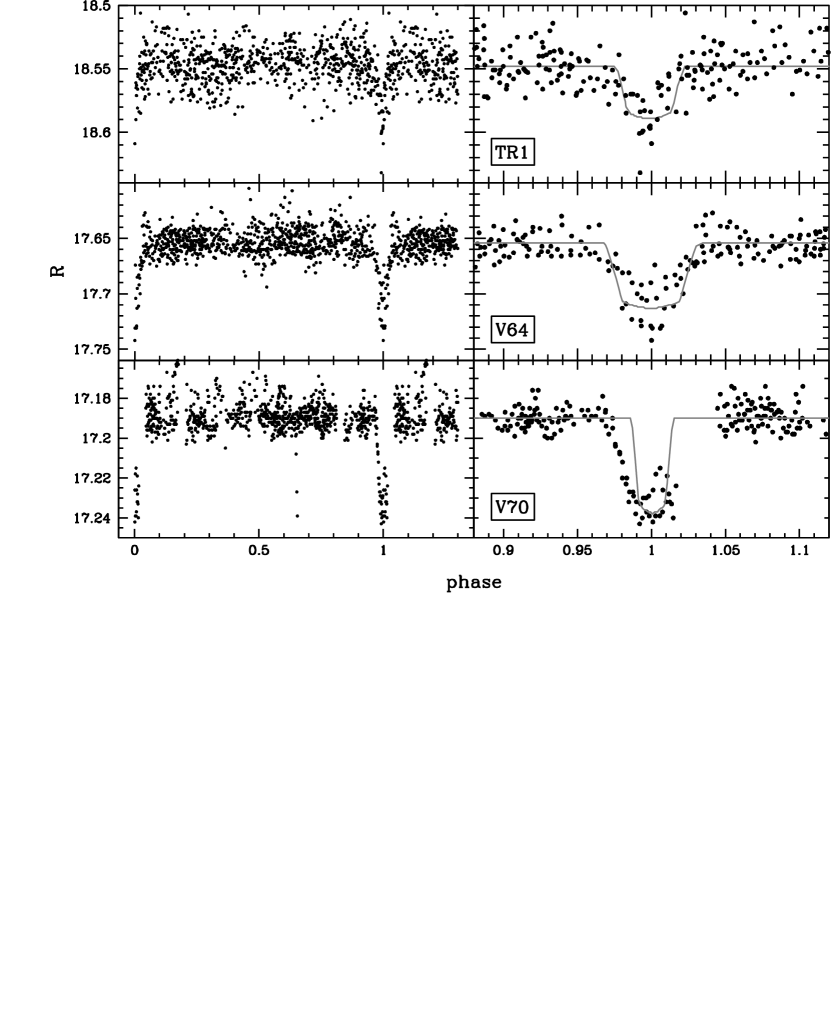
We identified one transiting object, TR1, with an -band amplitude of 3.7% and -band magnitude of 18.54. Its -band light curve is shown in the top left panel of Fig. 4 and its parameters are listed in Tab. 1. Using the simple model described in Paper III and §5.2.1, we find that the light curve is consistent with a 0.87 star with a 1.66 low luminosity companion, assuming an orbital inclination of 90∘. The top right panel of Fig. 4 shows this model (solid line) superimposed on the -band light curve. It is likely that the star is a cluster member, as it is located from cluster center and on the CMD it falls on the cluster MS. The only other possibility is that it is a stellar binary with grazing eclipses.
The radii of the seven known Jupiter-mass (0.53-1.45 ) transiting planets span the range from 1 to 1.32 (The Extrasolar Planets Encyclopaedia 222See http://www.obspm.fr/planets). An eighth planet, HD 149026b, recently found to display transits has a mass of 0.36 and a radius of 0.726 (Charbonneau et al. 2005). In light of this, TR1 seems too large to be a planet. Based on models of brown dwarfs (BD) and very low mass stars (VLM), at an age of 1 Gyr a radius of 1.66 would correspond to a 0.085 star, and at 3.2 Gyr to a 0.140 star (Baraffe et al. 2001). Assuming an age of 2 Gyr for NGC 2158, as determined by Ca02, such a radius would correspond to 0.1 star. Precise determinations of radii and masses for BDs and VLM stars are few. Until recently, only the nearest such systems could be studied, due to their low luminosities and small radii (hence shallow eclipses). The advent of high precision mass photometry has stimulated interest in the search for such systems (Hebb et al. 2004; Pont et al. 2005; Pinfield et al. 2005).
Among the candidates with low we found two stars, V64 and V70, which exhibit eclipses 4-5% in depth (Fig. 4). The light curves of V64 and V70 are consistent with 2.4 and 2.3 objects, respectively, assuming an orbital inclination of 90∘. These stars are located above the cluster MS, especially V70 (on chip 4), so they are either blends or field stars.
There are some discrepant points at phase 0.65 in the light curve for V70. They do not seem to be caused by a defect on the CCD. It is possible that we have not recovered the correct period for this variable. More data would be necessary to resolve this issue.
5 Estimate of the Number of Expected Detections
The number of transiting planets we should expect to find, , can be derived from the following equation:
| (2) |
where is the number of stars with sufficient photometric precision, is the frequency of planets within the investigated period range and is the detection efficiency, which accounts for random inclinations. (). In §§5.1 and 5.2 we determine and .
5.1 Planet Frequency
The frequency of planets is known to increase with the host star’s metallicity. From Figure 7 in Santos et al. (2004), the frequency of planets with metallicities below [Fe/H] = +0.1 dex is 2.5%. The percentage of planets with periods below 10 days is , as determined in Paper III. Combining these two numbers yields =0.375%. Please note that the latter estimate is considerably lower than the commonly adopted frequency of 1%.

5.2 Detection Efficiency
In order to characterize our detection efficiency, we inserted model transits into the observed light curves, and tried to recover them using the BLS method.
5.2.1 Model Transit Light Curves
The model transit light curves were defined by five parameters: the transit depth, F, total transit duration, , transit duration between ingress and egress, (the “flat” part of the transit), the period of the planet, and the limb darkening coefficient, .
The transit light curves were generated using the approach described in Paper III. To obtain the radius and mass of the cluster stars, we used the Z=0.004 1.995 Gyr isochrone of Girardi et al. (2000), which is closest to the Z=0.0048 2 Gyr isochrone used by Ca02. A distance modulus mag was used to bring the observed -band magnitudes to the absolute magnitude scale (Ca02).
In addition to , the equations contain two other free parameters: the planet radius, and the inclination of the orbit, . A fourth parameter which affects the detectability of a planet is the epoch of the transits, .
5.3 Test Procedure
We investigated the range of parameters specified in Table 2, where is expressed in days, in , as a fraction of period. We examined the range of periods from 1.05 to 9.85 days and planet radii from 0.95 to 1.5 , with a resolution of days and , respectively. For we used an increment of 5% of the period, and a 0.025 increment in . The total number of combinations is 432000.
We followed the test procedure described in Paper III. The tests were run on the 5476 stars from chips 1-4 with at least 500 good epochs and light curve rms below 0.05 mag. Figure 5 shows the original, model and combined light curves (upper, middle and lower panels, respectively) for a star with and a planet with a period of 2.05 days, radius of 1.45 and inclination of 84∘. The amplitude of the transit is 0.0175 mag, and the mass and radius of the star, taken from the models, are 1.18 and 1.10 .
To assess the impact of the procedure to correct for offsets between the runs on our detection efficiency, we investigated three cases, where the correction was applied:
-
A.
after inserting transits,
-
B.
before inserting transits,
-
C.
was not applied at all.
Case (B) will give us the detection efficiency if our data did not need to be corrected, and case (C) if we did not apply the corrections. Case (A) will give us our actual detection efficiency, and its comparison with cases (B) and (C) will show how it is affected by the applied correction procedure.
5.4 Detection Criteria
The same detection criteria as in Paper III were used. A transit was flagged as detected if:
-
1.
The period recovered by BLS was within 2% of the input period , 2 or ,
-
2.
The BLS statistics were above the following thresholds: , .
These detections will be referred to hereafter as firm. Detections where only condition (1) was fulfilled will be called marginal.
5.5 Detection Efficiency
The results of the tests are summarized in Table 3, which lists the test type (A-C), the number and percentage of transits with (out of the 432000 possible parameter combinations), and the numbers and percentages (relative to the total number of transits in column 2) of transits detected in the model light curves, and of marginal and firm detections in the combined light curves.
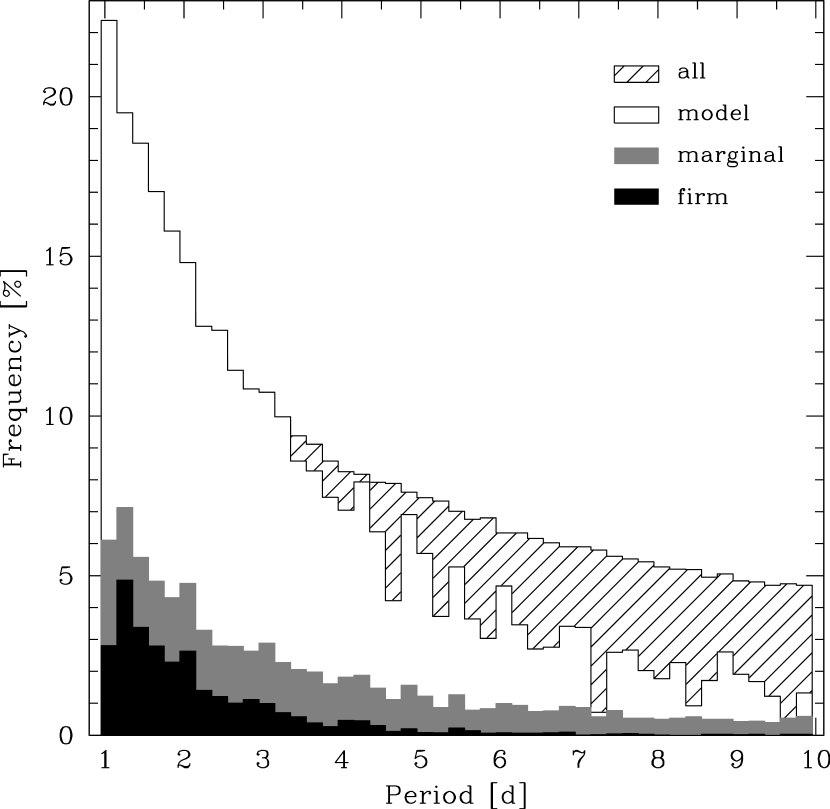
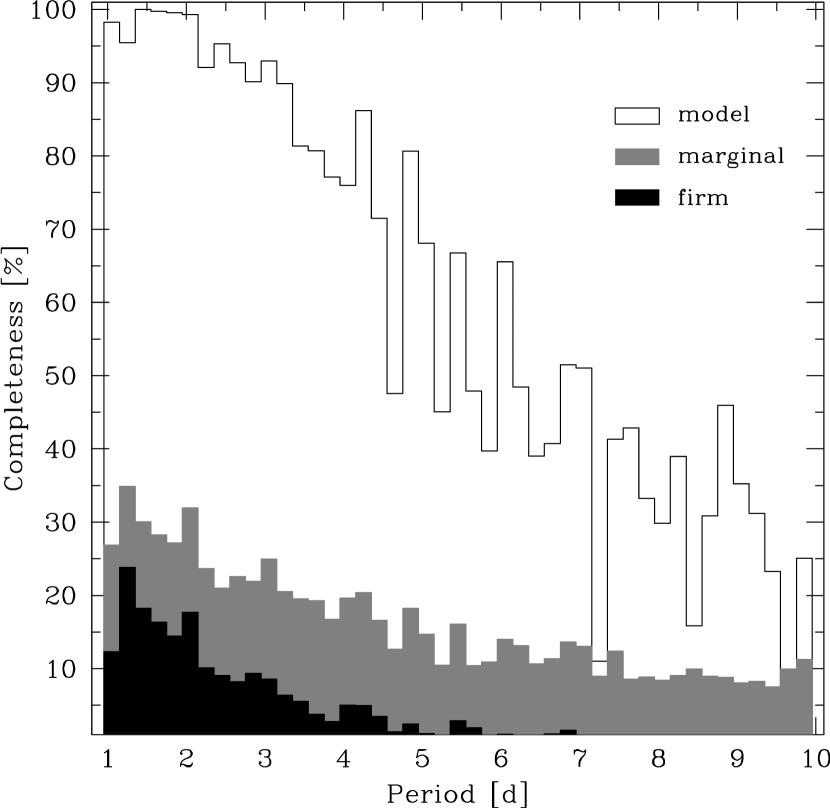
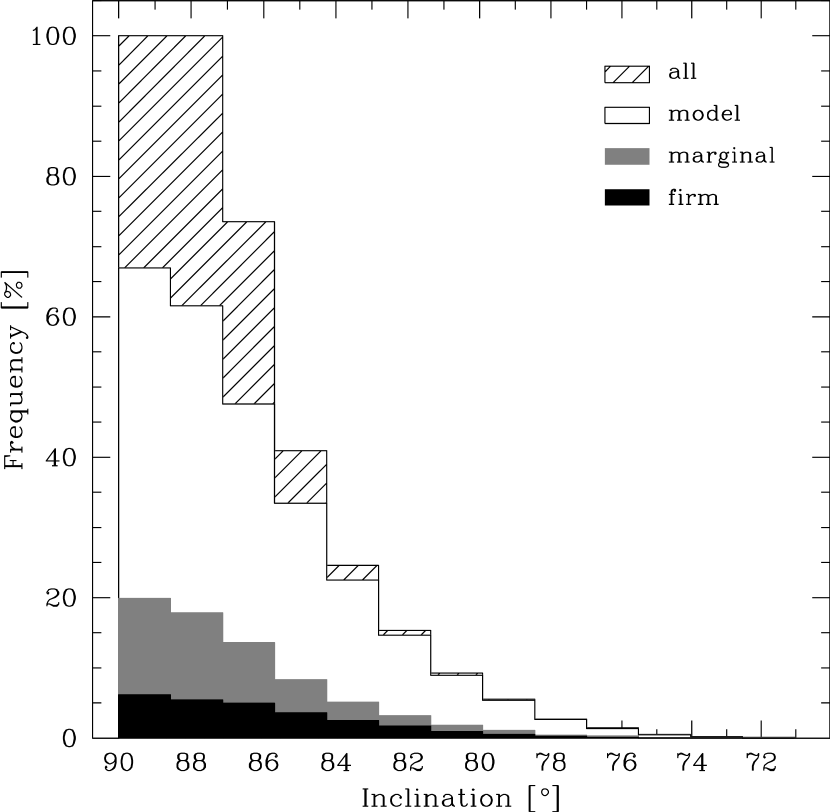
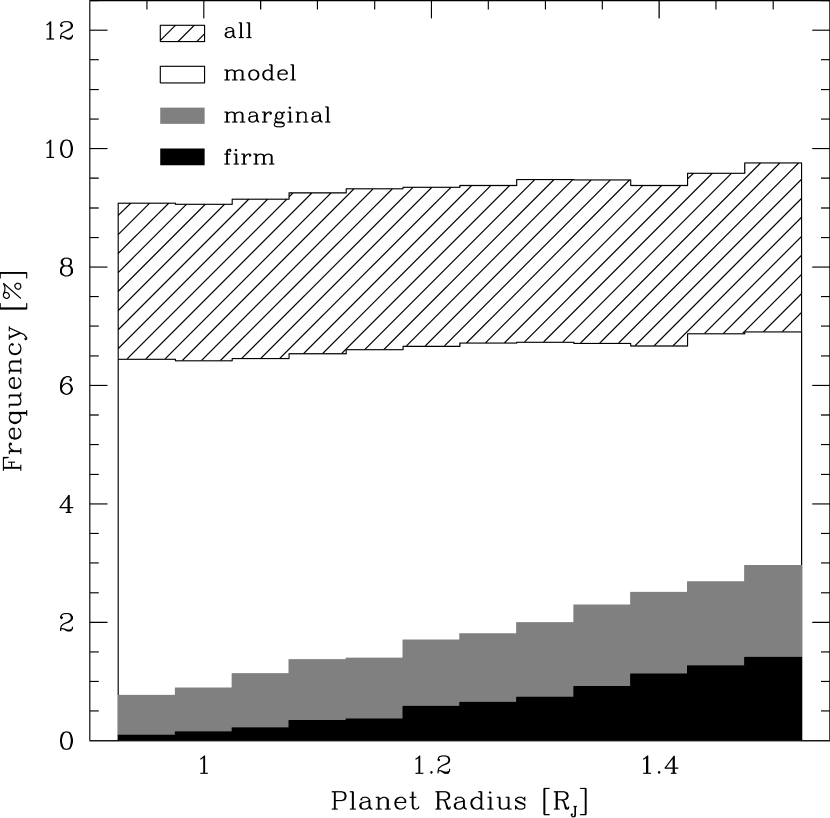
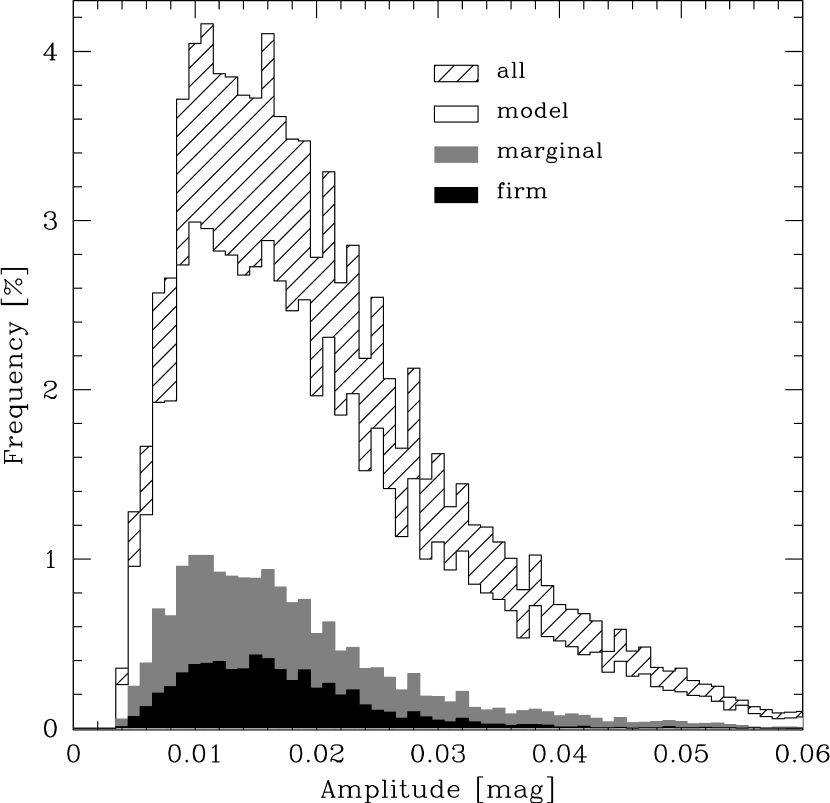
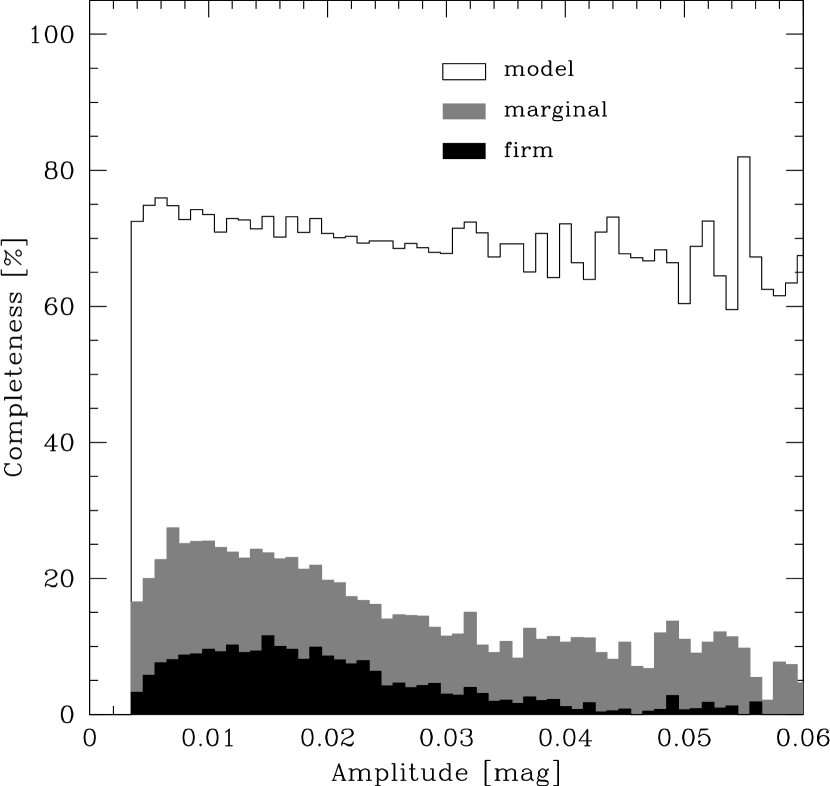
Figures 6-9 show the dependence of the detection efficiency on period, inclination, planet radius and transit amplitude. The hatched, open, filled gray and filled black histograms denote distributions for all transiting planets, planets detected in the model light curves, and marginal and firm detections in the combined light curves, respectively. Left panels show the frequency of transits and transit detections relative to planets with all inclinations. Right panels show the detection completeness normalized to all transiting planets (plotted as hatched histograms in left panels).
The tests show that 9% of planets with periods 1-10 days will transit their parent stars. This frequency drops from 22% at to 5% at . All planets with inclinations transit their host stars, and this fraction drops to 78% for and 5% for . The frequency of transits increases very weakly with planet radius. The distribution of transit amplitudes has a wide peak stretching from 0.8% to 2%, centered on 1.4%.
The percentage of detections for the model light curves illustrates the limitation imposed on our detection efficiency by the temporal coverage alone. Due to incomplete time sampling, we are restricted to 71% of all planets with periods between 1 and 10 days. For periods below 3 days, our temporal coverage is sufficient to detect 90% of all transiting planets, and drops to 50% at days. The detection completeness increases with decreasing inclination because at lower only short period planets can transit their host stars. It does not depend on the planet radius, and it decreases with increasing transit amplitude.
The source of the dependence of the detection completeness on transit amplitude is not as straightforward as for the other correlations. The amplitude depends on the radii of the star and planet. Since the detection completeness was found to be largely independent of the planet radius, the observed trend must stem from its dependence on the host star’s radius, which is a function of its magnitude. Such a correlation is indeed observed, with completeness increasing for brighter stars (not shown here). The link between the temporal coverage and magnitude comes from the observed increase in the number of points in the light curve with decreasing magnitude.
For cases A, B and C, we marginally detect 19%, 19% and 12% of all transiting planets, and firmly detect 7.0%, 6.6% and 2.6%, respectively. Transiting planets with firm detections constitute 80%, 82% and 80% of all stars with and . Correcting the light curves after inserting transits (case A) produces almost the same number of detections, compared to the case where the correction was applied to the original light curves (case B). If the light curves were not corrected (case C), we would detect only 37% of the transiting planets detected in case A.
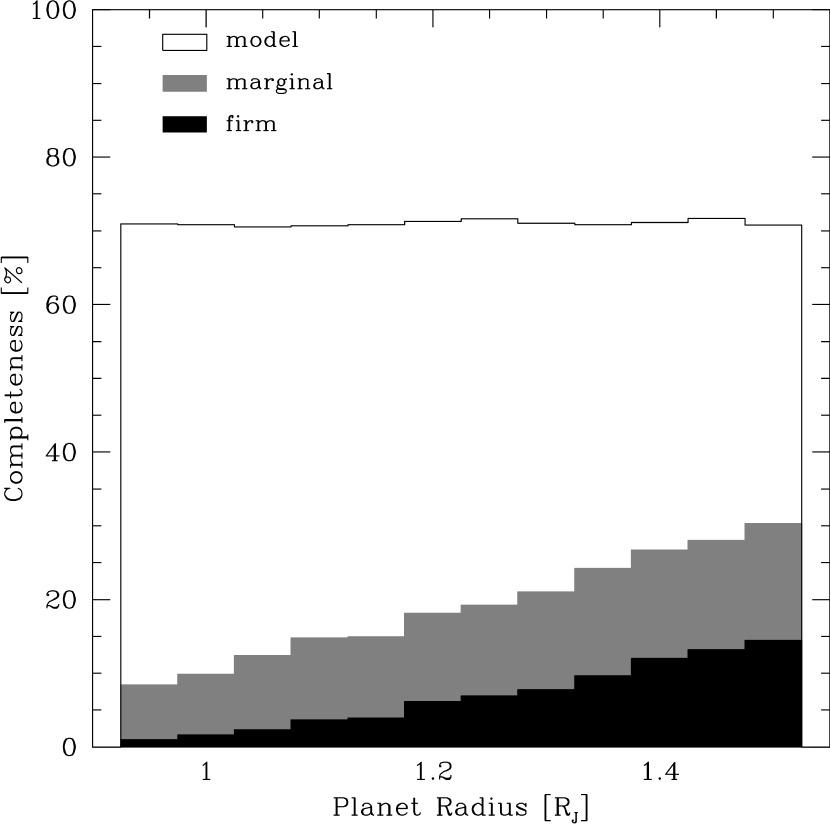
The detection completeness for firm detections peaks at 20% for periods and decreases with period more steeply than model detections. It does not show a marked dependence on inclination, and strongly increases with increasing planet radius, from at 1 to 15% at 1.5 . This is also apparent in the right panel of Fig. 3, which shows the detection efficiency of 0.95, 1.15, 1.30 and 1.50 planets as a function of magnitude and rms scatter (white: 0%, black 100%).
The detection efficiency peaks at an amplitude of 1.5%, due to the most favorable ratio between the transit amplitude and photometric accuracy for this amplitude/magnitude range.
The efficiency of firm transiting planet detections, relative to planets with all orbital inclinations, , is .
5.6 Number of Transiting Planets Expected
5.7 Discussion
Figure 6 demonstrates that our temporal coverage is not the limiting factor. To increase the number of expected planets it would be necessary to improve the photometric precision. The weather and seeing conditions turned out to be inferior to what we were expecting. A better quality CCD and a telescope with a larger diameter and/or better observing conditions would be required to improve the chances for a successful transiting planet search in NGC 2158.
The precision of this estimate is largely limited by the uncertainty in one of our basic assumptions – the distribution of planetary radii. This distribution is not precisely known, and changing it will have a marked effect on the final result. Adopting a distribution of planetary radii from 1.0 to 1.35 , corresponding to the radius range spanned by the seven known Jupiter-mass transiting planets (The Extrasolar Planets Encyclopaedia) would lower D from 0.65% to 0.33%. This translates to 0.06 detections, compared to 0.13 with the original radius distribution – a 50% decrease.
In Paper I we made the assumption that the planetary radii would span the range 1-3 , based on the radius of for the only known transiting planet at the time, HD 209458b (Brown et al. 2001). A simulation for planets in the radius range 1.5-3.0 shows that 10% of them transit their parent stars, 72% are detected in the model light curves, and 52% and 35% are marginal and firm detections in the combined light curves. Assuming that planet radii are distributed evenly between 1 and 3 would give the percentage of firm detections of 28% and detection efficiency , which translates into 0.56 expected detections.
We have detected a star which, if a member of the cluster and not a grazing binary, has a transiting companion with a likely radius of about 1.7 . The detection rate for 1.7 objects is 21%. This would imply that % of stars in our field of view have a transiting companion of this mass at close separation (period below 10 days).
6 Variable Stars
We extracted the light curves of 57 known variable stars, discovered in Paper II. In Tables 4-7 we list their revised parameters.
We searched for new variables by running BLS in the period range 0.1-10 days. We have discovered 40 new variables: 2, 6, 24 and 8 on chips 1-4, respectively: 13 eclipsing binaries, 23 other periodic variables and four long period or non-periodic variables. Their parameters are listed in Tables 4-7 and their light curves are shown in Figures 4 and 10-14.333The band photometry and finding charts for all variables are available from the authors via the anonymous ftp on cfa-ftp.harvard.edu, in the /pub/bmochejs/PISCES directory. They are also plotted on the CMD in Fig. 2.
6.1 Eclipsing Binaries
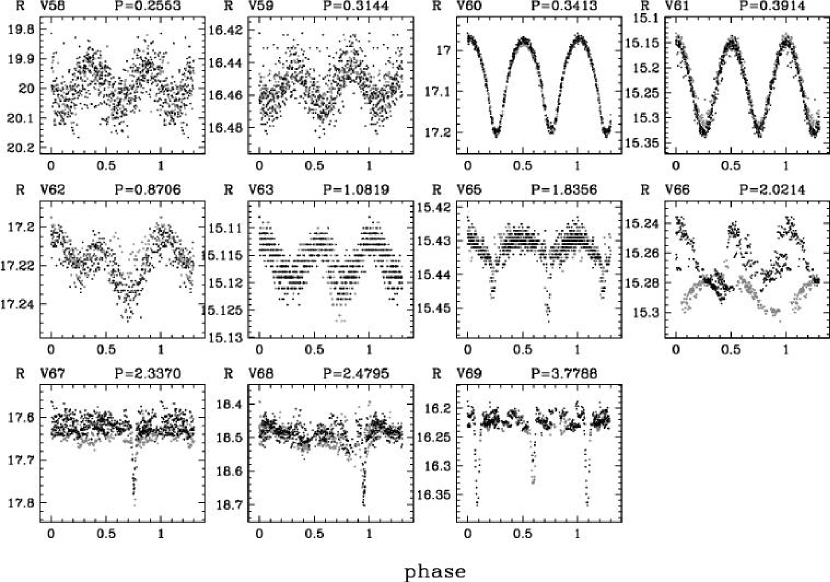
There are 13 eclipsing binaries among the newly discovered variables (Fig. 4 and 10, Tab. 4). V58-V63 are W UMa type binaries. V60 is very likely a cluster member, based on the KAS97 membership probability and its location on the binary MS. V61 and V63 are located in the blue straggler region. Variables V64 and V67-V70 appear to be detached systems. V64 and V70 were discussed previously in §4.2. V65 displays continuous variation between the eclipses. It appears to be a cluster member and is located at the base of the red giant branch. The shape of the light curve of V66 changed dramatically between 2003 and 2004. This star is a blue straggler, if it belongs to the cluster.
6.2 Scuti Stars
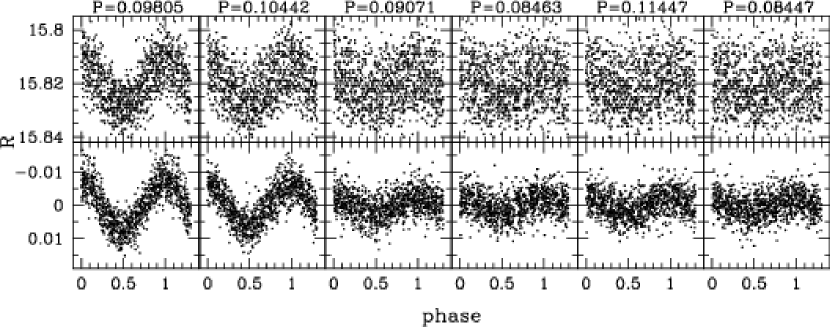
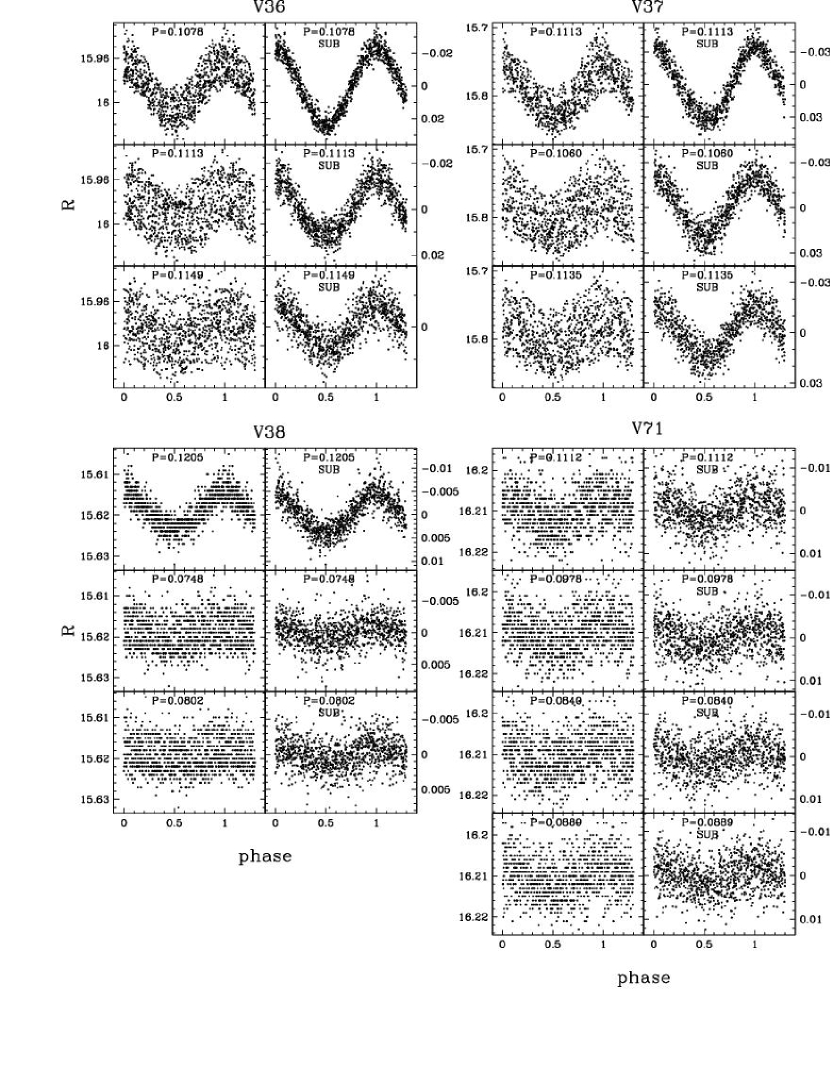
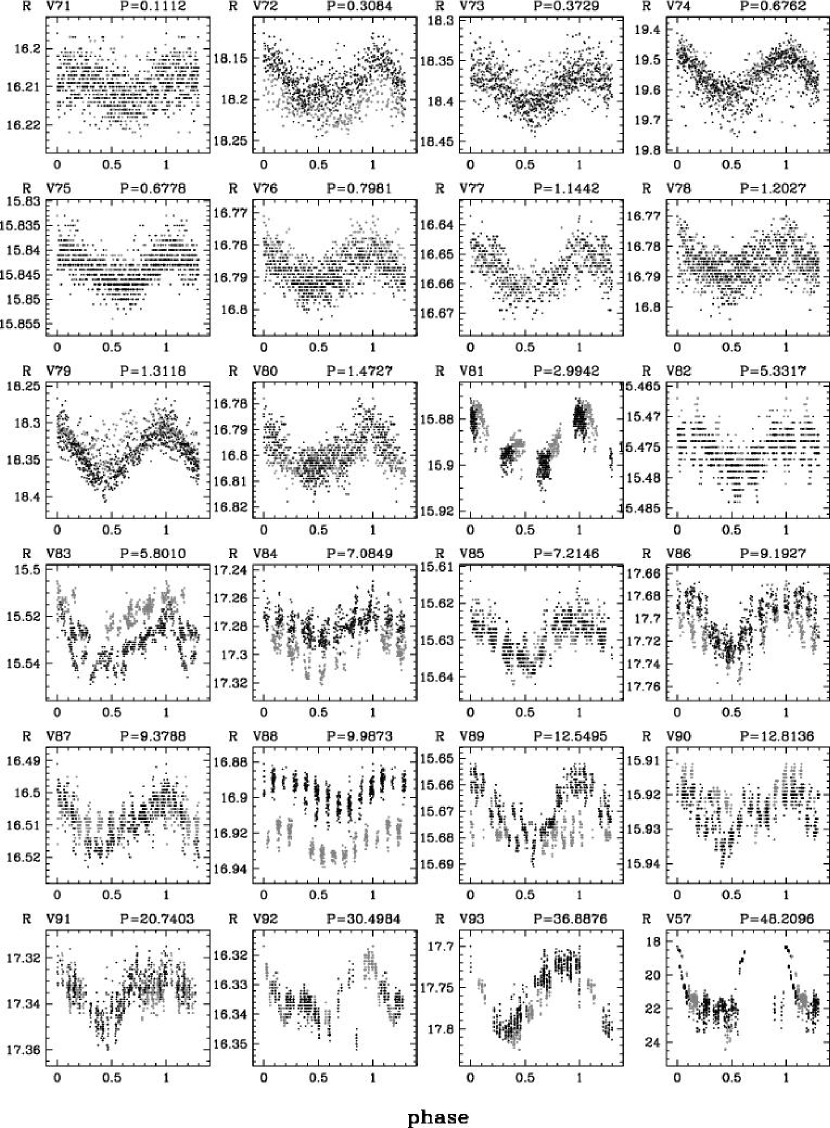
In Paper II we reported the discovery of five Scuti variables, V35-V39. V71 is a newly discovered variable of this type. We have identified four periods in its light curve. It is located just above the MSTO, together with the other Scuti variables (Fig. 2).
Table 5 lists the parameters and Table 6 the periods derived for the Scuti variables. Figures 11 and 12 show their light curves phased with every identified period. We have identified at least three modes of pulsation for all variables except V39. The identification of the mode of pulsation in Scuti stars is not trivial, as the frequencies of highest amplitude have very different order in different stars (Arentoft et al. 2005). The last two columns of Table 6 give the minimum and maximum difference between the distance modulus computed from the fundamental-mode period-luminosity relation for Scuti stars (eq. [4] in Petersen & Christensen-Daalsgard 1999) and the distance modulus (m-M)0=12.80 derived by Ca02. These differences are consistent with the variables being members of the cluster, with the exception of V39. It is likely that the discrepancy for this variable is a result of non-fundamental mode pulsations.
As discussed in Paper II, four of these stars have proper motion data in KAS97. Cluster membership of V36 is confirmed with high probability, while for V35 and V39 the data are not conclusive. The catalog reports a very low cluster membership probability for V38, which is in disagreement with our conclusions based on the Scuti P-L relation. The study of KAS97 was also targeting much brighter stars ( mag) in M 35 and two other clusters at smaller distances than NGC 2158. The authors say that their proper motion measurement “accuracy decreases rapidly for stars fainter than mag”, while the magnitude range of NGC 2158 variables is 15.7-18.0, and for V38.
6.3 Other Periodic Variables
We have discovered 22 new other periodic variables (Fig. 13 and Tab. 5). They display roughly sinusoidal light variations with periods ranging from 0.3 to 36 days. The variability in most of these stars is probably caused by star spots, which are rotating in and out of view. Variables V83, V84, V88 and V89 in addition to periodic variability show a change in the magnitude zeropoint between the 2003 and 2004 observations, which is most likely caused by the evolution of star spots.
On the CMD, V75 and V81 are located in the blue straggler region of the CMD, V76, V77, V78, V80 and V87 are located close to MSTO and V82, V83, V85 and V89 are located near the sub-giant branch (SGB). The variable V90, if it belongs to the cluster, might be a member of the newly proposed class of variable stars termed “red stragglers” (Albrow et al. 2001) or “sub-subgiant stars” (Mathieu et al. 2003). Thus far, the origin and evolutionary status of these stars remains unknown. V79 and V91 are located above the MS and may be binary stars or background objects and V72, V73, V74, V84, V86, V88 and V92 seem to be background objects. According to KAS97, V76 is most likely a cluster member, and for V75, V81 and V88 the data are not conclusive.
6.4 Cataclysmic Variable Candidate
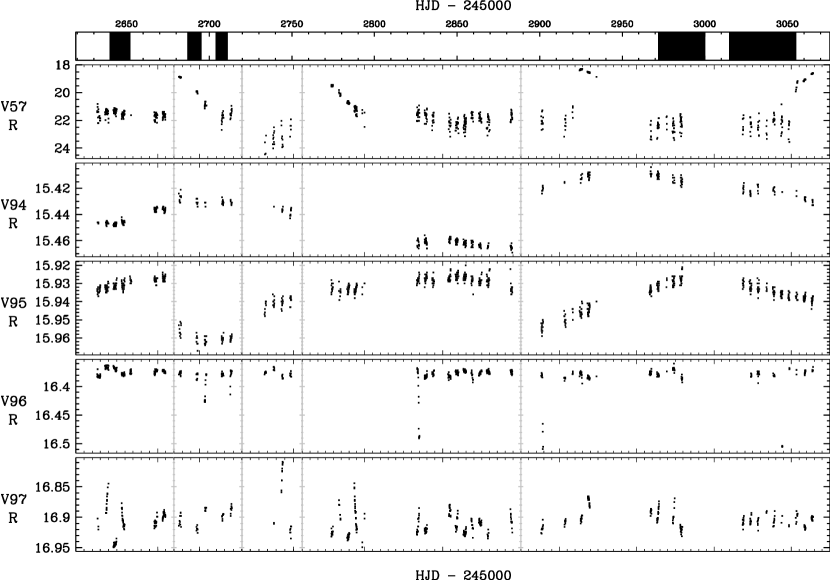
In Figure 14 we present the light curve of the cataclysmic variable candidate, V57, identified in Paper II. The variable shows four 2.5 mag outbursts which phase with a 48.2 day period (phased light curve shown in Fig. 13).
In Paper II we determined the color of this variable to be -0.26 in maximum and -0.31 in minimum. In our current data the variable has a much more plausible color: 0.304 in maximum and 0.874 in minimum. The color determination at minimum is very uncertain, due to the faintness of the star and differing minimum magnitudes between the cycles.
Assuming the NGC 2158 distance and reddening derived by Ca02, we get the minimum absolute -band magnitude of 6.4 mag. From Fig. 3.5 in Warner (1995) it is apparent that is roughly 8 mag for U Gem type dwarf novae, but even the most extreme Z Cam type systems have mag. This would imply that V57 is a dwarf nova located in front of the cluster.
It should be noted, however, that the band magnitude alone is not sufficient to exclude this variable as a cluster member. Another cataclysmic variable, B7 in the open cluster NGC 6791, is seen most of the time in a high state at , and has been caught only once in its low state at (Kaluzny et al. 1997). The high state in VY Scl type CVs can last for several years, and some systems stay in the high state during most of the time (i.e. ST LMi, MR Ser and AN UMa in Kafka & Honeycutt 2005). Further investigation is needed to resolve the nature of V57. A spectrum of a dwarf nova in quiescence should display Balmer emission on a blue continuum. During outburst the emission lines are gradually overwhelmed by the increasing continuum and development of broad absorption lines (Warner 1995). If V57 is in a “high” level, like B7, then this will be apparent in the spectrum and emission lines should not be prominent.
6.5 Long Period and Non-Periodic Variables
We have discovered four new long period or non-periodic variables (Fig. 14, Tab. 7). V94 is located near the SGB branch. V95 is located in the red starggler region of the CMD. According to KAS97, V95 is likely a cluster member. V96 and V97 are located on the upper MS, close to the MSTO. V96 is a DEB and could be useful for cluster distance and age determination, due to its location on the MSTO.
7 Conclusions
In this paper we have performed an extensive search for transiting planets in the intermediate age, populous cluster NGC 2158. The cluster was monitored for over 260 hours during 59 nights.
We have identified a low-luminosity transiting object candidate, TR1. The -band amplitude of 3.7% implies a 1.66 radius for the transiting companion. The location of the host star on the cluster MS and its proximity to the cluster center seem to indicate that it is a member of the cluster. Higher accuracy light curves are required to better costrain the radius and period of TR1, and followup spectroscopy, to estimate the mass of the transiting object, through a measurement, or an upper limit on the central object’s radial velocity variations.
Assuming a planet frequency from radial velocity surveys, we estimate that we should have detected 0.13 transiting planets with periods between 1 and 10 days, with our photometric precision and temporal coverage. The main limitation on our detection efficiency was imposed by the photometric precision.
We have discovered 40 new variable stars in NGC 2158: 13 eclipsing binaries, 23 other periodic variables and four non-periodic variables, Together with 57 variables discovered in Paper II, this brings the total number of variables known in this cluster to 97. We have also presented high photometric precision light curves, spanning almost 13 months, for all previously known variables.
Transiting planets have proven to be more challenging to detect than initially expected, as shown by the paucity of detections from the many searches under way in open clusters (i.e. Bruntt et al. 2003; UStAPS: Hood et al. 2005; EXPLORE/OC: von Braun et al. 2004; STEPSS: Marshall et al. 2005) and in the Galactic field (i.e. EXPLORE: Mallén-Ornelas et al. 2003; OGLE: Udalski et al. 2002a; STARE: Alonso et al. 2003; HAT: Bakos et al. 2004; WASP0: Kane et al. 2005444For a more complete list of transiting planet searches, please refer to http://star-www.st-and.ac.uk/~kdh1/transits/table.html and http://www.obspm.fr/encycl/searches.html). To date, only six planets have been discovered independently by transit searches, all of them in the field, and five of those were initially identified by OGLE (Udalski et al. 2002a, 2002b, 2002c, 2003; Alonso et al. 2004).
| ID | [h] | [] | P [d] | ||||
|---|---|---|---|---|---|---|---|
| TR1 | 6 07 35.4 | 24 05 40.8 | 2.3629 | 18.544 | 19.218 | 0.037 |
| Parameter | min | max | step | nsteps |
|---|---|---|---|---|
| P (days) | 1.05 | 9.85 | 0.200 | 45 |
| () | 0.95 | 1.50 | 0.050 | 12 |
| 0.00 | 0.95 | 0.050 | 20 | |
| 0.0125 | 0.9875 | 0.025 | 40 |
| test | all transits | model | marginal | firm | ||||
|---|---|---|---|---|---|---|---|---|
| type | N | % | N | % | N | % | N | % |
| 1 | 40408 | 9.4 | 28696 | 71.0 | 7734 | 19.1 | 2818 | 7.0 |
| 2 | 40408 | 9.4 | 28696 | 71.0 | 7493 | 18.5 | 2674 | 6.6 |
| 3 | 40408 | 9.4 | 28696 | 71.0 | 4740 | 11.7 | 1045 | 2.6 |
| ID | [h] | [] | P [d] | ||||||
|---|---|---|---|---|---|---|---|---|---|
| V01 | 6 07 32.6 | 23 49 21.0 | 0.2353 | 17.659 | 18.497 | 0.080 | 0.117 | ||
| V58 | 6 07 47.8 | 23 51 16.0 | 0.2553 | 19.870 | 20.547 | 0.291 | 0.454 | ||
| V59 | 6 07 23.9 | 24 04 57.5 | 0.3144 | 16.430 | 16.932 | 0.055 | 0.056 | ||
| V02 | 6 07 23.3 | 24 06 12.3 | 0.3385 | 17.340 | 17.872 | 0.240 | 0.241 | ||
| V60 | 6 07 38.0 | 24 07 24.9 | 0.3413 | 16.972 | 17.564 | 0.238 | 0.269 | 63 | 77 |
| V03 | 6 07 04.9 | 23 48 53.3 | 0.3522 | 18.396 | 18.993 | 0.680 | 0.737 | ||
| V04 | 6 07 17.5 | 24 04 45.7 | 0.3555 | 17.749 | 18.376 | 0.219 | 0.269 | ||
| V05 | 6 07 40.6 | 24 05 03.6 | 0.3635 | 17.623 | 18.197 | 0.395 | 0.416 | ||
| V61 | 6 06 48.3 | 23 52 44.0 | 0.3914 | 15.144 | 15.542 | 0.195 | 0.184 | ||
| V07 | 6 06 37.0 | 23 50 41.1 | 0.5075 | 17.043 | 17.543 | 0.037 | 0.058 | ||
| V08 | 6 06 44.8 | 24 06 57.8 | 0.5466 | 17.632 | 18.561 | 0.075 | 0.164 | ||
| V09 | 6 07 29.4 | 24 10 06.3 | 0.6793 | 18.852 | 19.502 | 0.686 | 0.680 | ||
| V10 | 6 07 34.9 | 24 04 25.6 | 0.8602 | 18.740 | 19.416 | 0.346 | 0.370 | ||
| V17 | 6 07 31.9 | 24 06 00.2 | 0.8633 | 15.682 | 16.173 | 0.025 | 0.039 | ||
| V62 | 6 07 32.8 | 24 07 26.6 | 0.8706 | 17.202 | 17.742 | 0.046 | 0.069 | ||
| V11 | 6 07 21.4 | 24 05 39.7 | 0.9105 | 17.066 | 17.627 | 0.155 | 0.139 | ||
| V19 | 6 06 20.5 | 24 04 47.8 | 0.9661 | 17.414 | 18.388 | 0.066 | 0.110 | ||
| V12 | 6 07 18.7 | 24 06 50.0 | 1.0573 | 16.610 | 17.138 | 0.043 | 0.052 | 71 | 78 |
| V63 | 6 07 37.5 | 23 55 57.3 | 1.0819 | 15.111 | 15.368 | 0.016 | 0.018 | 8 | 43 |
| V13 | 6 07 28.1 | 24 06 35.3 | 1.2033 | 15.882 | 16.374 | 0.086 | 0.084 | ||
| V14 | 6 07 27.2 | 23 52 24.4 | 1.2095 | 16.544 | 17.198 | 0.100 | 0.124 | 1 | 28 |
| V15 | 6 07 36.1 | 23 48 24.0 | 1.5588 | 16.088 | 16.439 | 0.028 | 0.039 | ||
| V16 | 6 06 36.6 | 24 03 29.1 | 1.5898 | 17.742 | 18.355 | 0.057 | 0.100 | ||
| V64 | 6 07 17.8 | 24 05 32.5 | 1.7960 | 17.651 | 18.314 | 0.053 | |||
| V65 | 6 07 39.3 | 24 02 16.0 | 1.8356 | 15.426 | 15.944 | 0.026 | 0.030 | 60 | 82 |
| V18 | 6 07 31.0 | 24 05 50.4 | 1.9013 | 16.534 | 16.994 | 0.043 | 0.051 | ||
| V66 | 6 07 31.4 | 24 05 18.4 | 2.0214 | 15.243 | 15.533 | 0.060 | 0.044 | ||
| V20 | 6 07 20.6 | 24 06 01.2 | 2.0611 | 16.420 | 16.947 | 0.100 | 0.111 | ||
| V21 | 6 07 36.3 | 23 56 21.3 | 2.0638 | 16.777 | 17.195 | 0.039 | 0.049 | 10 | 47 |
| V22 | 6 07 37.7 | 24 07 40.2 | 2.1307 | 15.243 | 15.762 | 0.016 | 0.021 | 72 | 90 |
| V23 | 6 07 03.5 | 24 01 45.1 | 2.2597 | 18.290 | 19.289 | 0.137 | 0.224 | ||
| V24 | 6 07 43.4 | 24 06 22.8 | 2.3002 | 16.718 | 17.217 | 0.043 | 0.063 | 59 | 79 |
| V67 | 6 07 24.1 | 24 06 22.7 | 2.3370 | 17.586 | 18.084 | 0.206 | 0.204 | ||
| V25 | 6 07 19.9 | 24 06 24.4 | 2.3677 | 16.358 | 16.842 | 0.038 | 0.042 | ||
| V68 | 6 07 27.6 | 24 10 48.8 | 2.4795 | 18.439 | 19.054 | 0.259 | 0.366 | ||
| V27 | 6 07 30.2 | 24 07 50.5 | 2.4954 | 16.827 | 17.283 | 0.043 | 0.076 | ||
| V26 | 6 07 24.1 | 24 07 53.8 | 2.6735 | 16.808 | 17.299 | 0.047 | 0.085 | ||
| V34 | 6 07 19.9 | 23 49 51.4 | 2.8640 | 15.789 | 15.989 | 0.150 | 0.164 | ||
| V28 | 6 06 50.0 | 24 08 26.0 | 2.9255 | 17.290 | 17.912 | 0.154 | 0.166 | 15 | 59 |
| V29 | 6 06 46.2 | 23 49 41.3 | 3.1572 | 18.457 | 19.028 | 0.451 | 0.456 | ||
| V30 | 6 07 14.9 | 24 09 40.8 | 3.3461 | 18.924 | 19.572 | 0.361 | 0.312 | ||
| V69 | 6 07 22.2 | 24 06 15.4 | 3.7788 | 16.202 | 16.640 | 0.164 | 0.185 | ||
| V31 | 6 06 49.0 | 24 01 43.7 | 3.7833 | 15.970 | 16.696 | 0.066 | 0.067 | 11 | 47 |
| V32 | 6 07 27.9 | 24 06 22.7 | 4.5948 | 16.458 | 16.984 | 0.183 | 0.048 | ||
| V33 | 6 07 33.3 | 24 04 34.4 | 4.7397 | 16.415 | 16.902 | 0.030 | 0.049 | ||
| V70 | 6 06 36.9 | 24 02 05.9 | 6.2657 | 17.189 | 17.910 | 0.043 | |||
| V55 | 6 07 25.8 | 24 05 45.7 | 8.1563 | 15.616 | 16.192 | 0.143 | 0.197 |
Note. — Cluster core and corona membership probabilities and taken from K97.
| ID | [h] | [] | P [d] | ||||||
|---|---|---|---|---|---|---|---|---|---|
| V35 | 6 06 47.1 | 24 07 41.5 | 0.0981 | 15.820 | 16.351 | 0.008 | 0.014 | 13 | 58 |
| V36 | 6 07 16.8 | 24 05 44.9 | 0.1078 | 15.987 | 16.473 | 0.022 | 0.033 | 83 | 90 |
| V71 | 6 07 23.8 | 24 10 40.4 | 0.1112 | 16.210 | 16.675 | 0.003 | 0.005 | ||
| V37 | 6 07 26.0 | 24 04 23.6 | 0.1113 | 15.794 | 16.236 | 0.037 | 0.048 | ||
| V38 | 6 07 11.3 | 24 03 36.4 | 0.1205 | 15.619 | 16.053 | 0.005 | 0.007 | 3 | 4 |
| V39 | 6 06 50.6 | 24 10 56.5 | 0.1220 | 15.211 | 15.648 | 0.018 | 0.024 | 4 | 23 |
| V72 | 6 06 11.4 | 24 08 52.9 | 0.3084 | 18.187 | 19.282 | 0.020 | 0.021 | ||
| V73 | 6 06 50.6 | 24 09 58.3 | 0.3729 | 18.383 | 19.549 | 0.020 | 0.019 | ||
| V74 | 6 06 27.9 | 24 03 47.4 | 0.6762 | 19.560 | 20.687 | 0.064 | 0.053 | ||
| V75 | 6 06 32.1 | 24 08 51.5 | 0.6778 | 15.844 | 16.195 | 0.003 | 0.003 | 2 | 37 |
| V76 | 6 07 23.1 | 24 10 00.5 | 0.7981 | 16.787 | 17.263 | 0.005 | 0.005 | 54 | 79 |
| V77 | 6 07 25.4 | 24 09 21.6 | 1.1442 | 16.657 | 17.116 | 0.007 | 0.008 | ||
| V78 | 6 07 37.6 | 24 05 57.3 | 1.2027 | 16.786 | 17.277 | 0.004 | 0.005 | ||
| V79 | 6 07 42.2 | 23 50 39.0 | 1.3118 | 18.337 | 19.026 | 0.028 | 0.028 | ||
| V40 | 6 07 05.6 | 24 07 06.5 | 1.3592 | 18.178 | 19.033 | 0.018 | 0.022 | ||
| V80 | 6 07 32.5 | 24 10 09.7 | 1.4727 | 16.799 | 17.229 | 0.007 | 0.009 | ||
| V41 | 6 07 04.2 | 23 58 09.5 | 1.4949 | 17.079 | 17.795 | 0.026 | 0.030 | 7 | 28 |
| V42 | 6 07 36.3 | 24 02 07.4 | 1.6210 | 17.425 | 17.911 | 0.031 | 0.037 | 67 | 88 |
| V43 | 6 07 49.9 | 24 09 45.5 | 2.6060 | 16.588 | 17.056 | 0.008 | 0.007 | ||
| V44 | 6 07 05.8 | 24 08 51.3 | 2.8294 | 16.684 | 17.391 | 0.016 | 0.021 | 44 | 80 |
| V81 | 6 07 40.6 | 24 05 50.0 | 2.9942 | 15.891 | 16.196 | 0.011 | 0.009 | 19 | 23 |
| V45 | 6 06 27.8 | 23 49 58.6 | 5.0129 | 18.937 | 19.845 | 0.036 | 0.050 | ||
| V82 | 6 06 24.2 | 24 06 43.5 | 5.3317 | 15.476 | 16.109 | 0.003 | 0.004 | ||
| V46 | 6 07 09.7 | 24 06 50.2 | 5.4488 | 17.378 | 18.153 | 0.014 | 0.024 | ||
| V47 | 6 06 40.4 | 24 06 34.3 | 5.4962 | 17.255 | 17.931 | 0.009 | 0.011 | 7 | 51 |
| V83 | 6 07 49.4 | 24 09 13.2 | 5.8010 | 15.529 | 16.050 | 0.009 | 0.012 | ||
| V54 | 6 07 07.0 | 24 05 25.3 | 6.3310 | 15.373 | 15.891 | 0.009 | 0.009 | ||
| V48 | 6 07 06.2 | 24 02 10.1 | 6.4713 | 16.422 | 17.115 | 0.025 | 0.031 | 41 | 69 |
| V49 | 6 07 10.2 | 24 10 19.4 | 6.5614 | 16.520 | 17.231 | 0.024 | 0.032 | 26 | 51 |
| V84 | 6 07 31.8 | 23 48 28.9 | 7.0849 | 17.284 | 18.303 | 0.010 | 0.015 | ||
| V85 | 6 06 22.3 | 24 07 09.1 | 7.2146 | 15.630 | 16.295 | 0.005 | 0.006 | ||
| V50 | 6 06 43.0 | 23 55 15.1 | 7.8975 | 16.266 | 16.803 | 0.011 | 0.014 | 0 | 24 |
| V86 | 6 07 22.7 | 23 48 19.0 | 9.1927 | 17.706 | 18.749 | 0.020 | 0.028 | ||
| V87 | 6 06 43.9 | 23 54 04.9 | 9.3788 | 16.509 | 16.953 | 0.006 | 0.012 | ||
| V53 | 6 07 49.0 | 24 02 02.6 | 9.8949 | 17.023 | 17.849 | 0.014 | 0.016 | 34 | 65 |
| V88 | 6 07 47.5 | 24 04 42.4 | 9.9873 | 16.907 | 17.715 | 0.008 | 0.010 | 25 | 38 |
| V89 | 6 07 36.4 | 24 05 42.3 | 12.5495 | 15.673 | 16.299 | 0.008 | 0.008 | ||
| V90 | 6 07 36.2 | 24 05 25.4 | 12.8136 | 15.924 | 16.580 | 0.005 | 0.008 | ||
| V52 | 6 06 24.0 | 23 54 25.6 | 16.0765 | 16.062 | 16.523 | 0.007 | 0.012 | ||
| V91 | 6 07 35.2 | 23 50 38.2 | 20.7403 | 17.337 | 18.007 | 0.009 | 0.008 | ||
| V92 | 6 07 24.7 | 24 03 58.9 | 30.4984 | 16.333 | 17.075 | 0.011 | 0.014 | ||
| V93 | 6 06 36.3 | 24 04 17.9 | 36.8876 | 17.759 | 19.219 | 0.040 | 0.060 | ||
| V56 | 6 06 17.2 | 24 03 39.7 | 63.4571 | 16.746 | 17.305 | 0.029 | 0.016 |
Note. — Cluster core and corona membership probabilities and taken from K97.
| ID | P1 [d] | P2 [d] | P3 [d] | P4 [d] | P5 [d] | P6 [d] | (m-M) | (m-M) |
|---|---|---|---|---|---|---|---|---|
| V35 | 0.098051 | 0.104421 | 0.090706 | 0.084631 | 0.114466 | 0.084468 | -0.055 | -0.398 |
| V36 | 0.107822 | 0.111340 | 0.114872 | 0.119 | 0.221 | |||
| V37 | 0.111281 | 0.106033 | 0.113535 | -0.035 | -0.145 | |||
| V38 | 0.120463 | 0.074820 | 0.080215 | -0.122 | -0.892 | |||
| V39 | 0.121997 | -0.506 | -0.506 | |||||
| V71 | 0.111217 | 0.097834 | 0.084016 | 0.088923 | 0.009 | 0.371 |
| ID | [h] | [] | ||||||
|---|---|---|---|---|---|---|---|---|
| V57 | 6 07 33.8 | 24 07 55.2 | 18.322 | 18.626 | 3.495 | 4.317 | ||
| V94 | 6 07 27.2 | 24 04 35.5 | 15.408 | 16.197 | 0.057 | 0.066 | ||
| V95 | 6 07 18.8 | 24 01 40.1 | 15.922 | 16.703 | 0.039 | 0.045 | 53 | 70 |
| V96 | 6 07 32.0 | 24 06 33.7 | 16.363 | 16.865 | 0.139 | 0.149 | ||
| V97 | 6 07 17.3 | 24 02 46.5 | 16.824 | 17.350 | 0.116 | 0.142 |
References
- (1) Alard, C. 2000, A&AS, 144, 363
- (2) Alard, C., Lupton, R. 1998, ApJ, 503, 325
- (3) Albrow, M. D., Gilliland, R. L., Brown, T. M., Edmonds, P. D., Guhathakurta, P., & Sarajedini, A. 2001, ApJ, 559, 1060
- (4) Alonso, R., Belmonte, J. A., & Brown, T. 2003, Ap&SS, 284, 13
- (5) Alonso, R., et al. 2004, ApJ, 613, L153
- (6) Arentoft, T., Bouzid, M. Y., Sterken, C., Freyhammer, L. M., & Frandsen, S. 2005, PASP, 117, 601
- (7) Bakos, G., Noyes, R. W., Kovács, G., Stanek, K. Z., Sasselov, D. D., & Domsa, I. 2004, PASP, 116, 266
- (8) Baraffe, I., Chabrier, G., Allard, F., & Hauschildt, P. H. 2002, A&A, 382, 563
- (9) Brown, T. M., Charbonneau, D., Gilliland, R. L., Noyes, R. W., & Burrows, A. 2001, ApJ, 552, 699
- (10) Bruntt, H., Grundahl, F., Tingley, B., Frandsen, S., Stetson, P. B., & Thomsen, B. 2003, A&A, 410, 323
- (11) Carraro, G., Girardi, L., & Marigo, P. 2002, MNRAS, 332, 705 (Ca02)
- (12) Charbonneau, D., et al. 2005, ApJ, submitted (astro-ph/0508051)
- (13) Christian, C. A., Heasley, J. N., & Janes, K. A. 1985, ApJ, 299, 683
- (14) Cutri, R. M., et al. 2003, The 2MASS All-Sky Catalog of Point Sources (Pasadena: IPAC)
- (15) Girardi, L., Bressan, A., Bertelli, G., & Chiosi, C. 2000, A&AS, 141, 371
- (16) Hebb, L., Wyse, R. F. G., & Gilmore, G. 2004, AJ, 128, 2881
- (17) Hood, B., et al. 2005, MNRAS, 360, 791
- (18) Kafka, S., & Honeycutt, R. K. 2005, AJ, 130, 742
- (19) Kaluzny, J., Stanek, K. Z., Garnavich, P. M. & Challis, P. 1997, ApJ, 491, 153
- (20) Kane, S. R., Lister, T. A., Collier Cameron, A., Horne, K., James, D., Pollacco, D. L., Street, R. A., & Tsapras, Y. 2005, MNRAS, 362, 117
- (21) Kharchenko, N., Andruk, V., & Schilbach, E. 1997, Astronomische Nachrichten, 318, 253 (KAS97)
- (22) Konacki, M., Torres, G., Jha, S., & Sasselov, D. D. 2003, Nature, 421, 507
- (23) Kovács, G., Zucker, S., & Mazeh, T. 2002, A&A, 391, 369
- (24) Mallén-Ornelas, G., Seager, S., Yee, H. K. C., Minniti, D., Gladders, M. D., Mallén-Fullerton, G. M., & Brown, T. M. 2003, ApJ, 582, 1123
- (25) Marshall, J. L., Burke, C. J., DePoy, D. L., Gould, A., & Kollmeier, J. A. 2005, AJ, 130, 1916
- (26) Mathieu, R. D., van den Berg, M., Torres, G., Latham, D., Verbunt, F., & Stassun, K. 2003, AJ, 125, 246
- (27) Mochejska, B. J., Stanek, K. Z., Sasselov, D. D., & Szentgyorgyi, A. H. 2002, AJ, 123, 3460 (Paper I)
- (28) Mochejska, B. J., Stanek, K. Z., Sasselov, D. D., Szentgyorgyi, A. H., Westover, M., & Winn, J. N. 2004, AJ, 128, 312 (Paper II)
- (29) Mochejska, B. J., et al. 2005, AJ, 129, 2856 (Paper III)
- (30) Petersen, J. O. & Christensen-Dalsgaard, J. 1999, A&A, 352, 547
- (31) Pinfield, D. J., Jones, H. R. A., & Steele, I. A. 2005, PASP, 117, 173
- (32) Pont, F., Melo, C. H. F., Bouchy, F., Udry, S., Queloz, D., Mayor, M., & Santos, N. C. 2005, A&A, 433, L21
- (33) Santos, N. C., Israelian, G., & Mayor, M. 2004, A&A, 415, 1153
- (34) Stetson, P. B. 1987, PASP, 99, 191
- (35) Tamuz, O., Mazeh, T., & Zucker, S. 2005, MNRAS, 356, 1466
- (36) Udalski, A., Pietrzynski, G., Szymanski, M., Kubiak, M., Zebrun, K., Soszynski, I., Szewczyk, O., & Wyrzykowski, L. 2003, Acta Astronomica, 53, 133
- (37) Udalski, A., Szewczyk, O., Zebrun, K., Pietrzynski, G., Szymanski, M., Kubiak, M., Soszynski, I., & Wyrzykowski, L. 2002c, Acta Astronomica, 52, 317
- (38) Udalski, A., Zebrun, K., Szymanski, M., Kubiak, M., Soszynski, I., Szewczyk, O., Wyrzykowski, L., & Pietrzynski, G. 2002b, Acta Astronomica, 52, 115
- (39) Udalski, A., et al. 2002a, Acta Astronomica, 52, 1
- (40) von Braun, K., Lee, B. L., Mallén-Ornelas, G., Yee, H. K. C., Seager, S., & Gladders, M. D. 2004, AIP Conf. Proc. 713: The Search for Other Worlds, 713, 181
- (41) Warner, B. 1995, Cambridge Astrophysics Series, Cambridge, New York: Cambridge University Press