Precession of the Super-Massive Black Hole in NGC 1275 (3C 84)?
Abstract
The X-ray holes at the centre of the Perseus Cluster of galaxies are not all at the same position angle with respect to the centre of the cluster. This configuration would result if the jet inflating the bubbles is precessing, or moving around, and the bubbles detach at different times. The orientations which best fit the observed travel directions are an inclination of the precession axis to the line of sight of and an opening angle of . From the timescales for the bubbles seen in the cluster, the precession timescale, , is around . The bubbles rising up through different parts of the cluster may have interacted with the central cool gas, forming the whorl of cool gas observed in the temperature structure of the cluster. The dynamics of bubbles rising in fluids is discussed. The conditions present in the cluster are such that oscillatory motion, observed for bubbles rising in fluids on Earth, should take place. However the timescale for this motion is longer than that taken for the bubbles to evolve into spherical cap bubbles, which do not undergo a path instability, so such motion is not expected to occur.
keywords:
galaxies: individual: NGC 1275 – galaxies: jets – black hole physics1 Introduction
High resolution radio observations of a number of extragalactic radio sources show that the opposed jets contain inversion symmetries, which provides evidence that the central engine is precessing, e.g. NGC 326 (Ekers et al., 1978) and NGC 315 (Bridle et al., 1979). In a review of quasars and radio galaxies which exhibit bent jets, of which some are inversion-symmetric about the core, Gower et al. (1982) present ten sources whose morphology can be explained using a precessing jet with periods ranging between . The extraordinary galactic object SS433 (Hjellming & Johnston, 1981) is successfully described with a precessing jet model by Margon (1984), and has been the subject of a recent study by Blundell & Bowler (2005).
The radio source at the centre of the Perseus Cluster, 3C84, is an extended source and shows an “S” or “Z”-shaped morphology at frequencies. These lobes have been observed to anti-correlate spectacularly with the observed X-ray emission from the cluster (Böhringer et al., 1993; Fabian et al., 2000). These depressions in the X-ray emission are thought to be the result of the jet from the central engine blowing bubbles of relativistic plasma into the thermal Intra-Cluster Medium, pushing the ICM aside (Gull & Northover, 1973; Böhringer et al., 1993). When their buoyancy velocity is greater than their expansion velocity, the bubbles are expected to detach and rise up buoyantly through the ICM (Churazov et al., 2000). This is observed in the Perseus Cluster, to the North-West and to the South of the core where there are depressions in the X-ray emission which do not have any associated radio emission; however, at lower frequencies (e.g. ) “spurs” of emission are observed pointing towards these so-called “Ghost bubbles” (Fabian et al., 2002).
The two pairs of bubbles which are clearly visible in the X-ray emission from the cluster belong to two different “generations,” the young, radio-active pair and the older “ghost” pair. The bubbles are observed at different position angles with respect to the radio core in the centre of the cluster. In Section 2 we discuss the morphology of the radio emission at the centre of the cluster, linking in other features in Section 3. Section 4 outlines the model for the precessing jet, the resultant parameters of which are presented in Section 5. We calculate the timescales for the precession in Section 6 and discuss the model in Section 7. We put forward two candidates for causing the precession in Section 8 and discuss the dynamics of rising bubbles in Section 9.
2 The Radio Bubbles of the Perseus Cluster
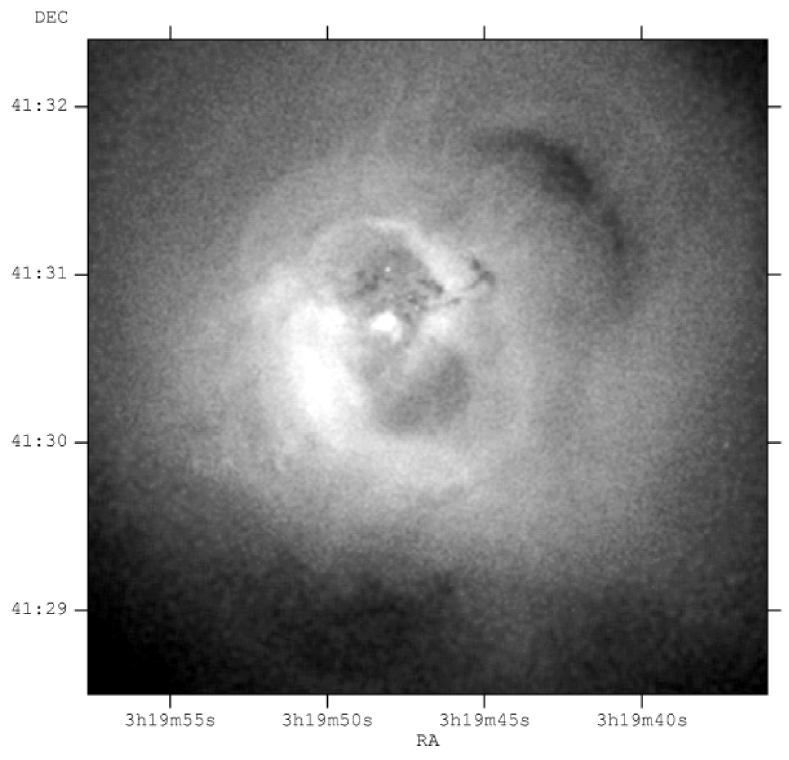
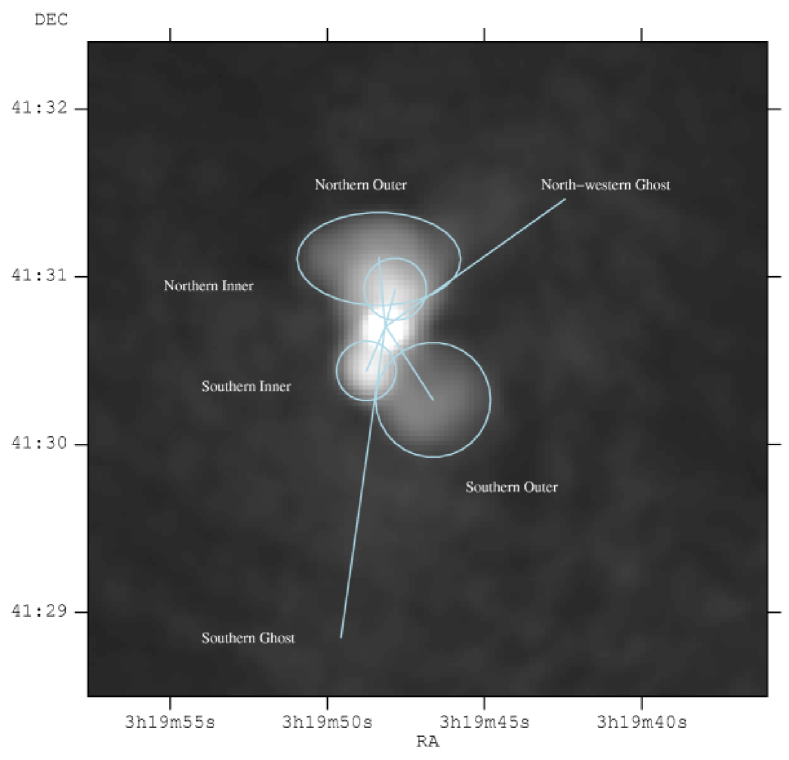
The extended radio emission from the radio source does not decrease smoothly from the core; there is a sharp drop in radio flux in the southern lobe (see Fig. 1 & Pedlar et al. 1990). This could be because there are two bubbles present, an older one which is in the process of rising buoyantly and a younger one which is still attached to the jet and being inflated. The X-ray emission also shows features in the region where the drop in radio flux occurs, there is a swath of excess X-ray emission which could arise from the ICM flowing in behind the recently detached bubble (Fig. 1). The shape of the X-ray decrement corresponding with this “Southern Outer” bubble is also similar to that of a spherical cap bubble.
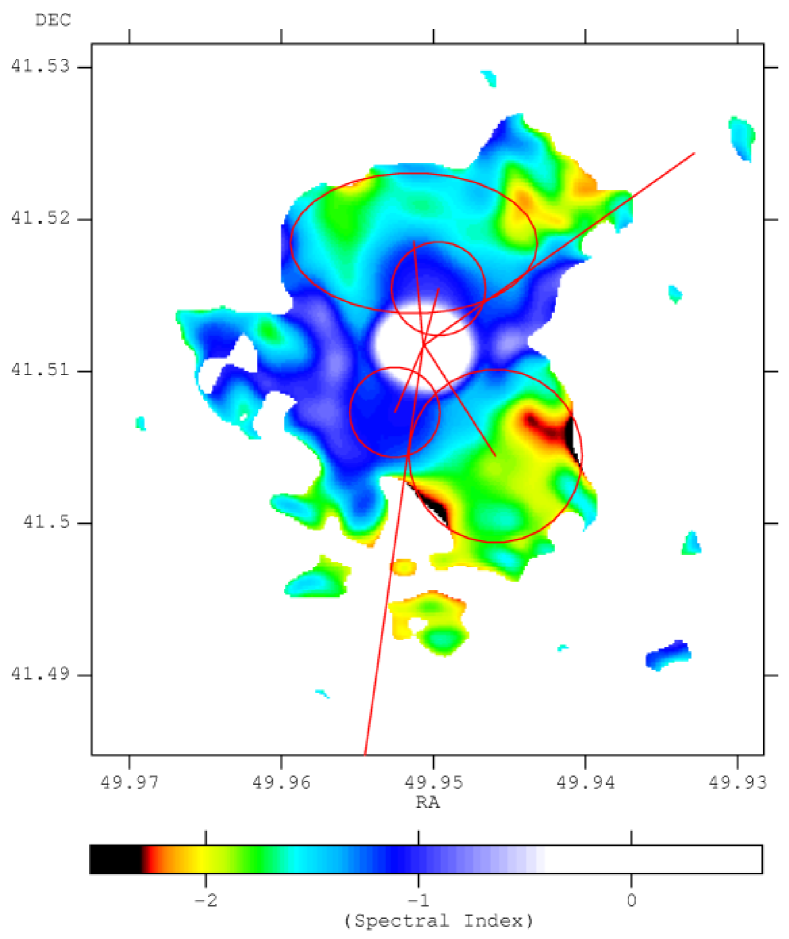
There is no equivalent sharp drop in the radio flux in the northern lobe, which, if there are also two bubbles present in this lobe, may result if younger one is behind the older one. This could soften the change in flux between the two bubbles as projected on the sky. In the case that the northern and southern radio lobes contain two bubbles each, we identify them as shown in Fig. 1. A spectral index map of the central regions of Perseus (Fig. 2) shows that the bubbles we have labelled as Outer have a steeper index than the Inner ones ( vs. for ). This supports the idea that these Outer bubbles are older than the Inner ones, as the electrons have aged, steepening the spectrum.
What can be seen from these observations is that the bubbles do not necessarily travel in the same directions when they detach. This is most obvious from the ghost bubbles. This may be due to the bubbles being somehow deflected from their initial path. Another explanation may be that the jet produced by the Super-Massive Black Hole (SMBH) is precessing, and the bubbles detach at different phases in the precession cycle. This analysis assumes that the bubbles travel outward from the centre in the direction the jet was pointing in at the time that they detached, with the precession time longer than the bubble inflation time. The current positions of the radio bubbles allow some constraints to be placed on the orientation and timescales of the precession.
However, Leonardo da Vinci observed that bubbles rising in liquids can move in a zig-zag fashion (da Vinci, 1515), and this may also be an explanation for the difference in observed position angles of the bubbles. However the analysis in Section 9 leads to the conclusion that this behaviour is not relevant in the Perseus Cluster.
The northern ghost bubble has been likened to a spherical cap bubble rising through fluid (Fabian et al., 2003a). The shape of the bubble is very similar to such a bubble in profile, and so can be reasonably expected to be travelling out from the centre of the cluster in the plane of the sky. Observations of the H filaments which are found around NGC1275 match some of the flow lines expected behind such a bubble very closely. Hatch et al. (2005) show that the line of sight velocities for the Horseshoe-filament which sits behind the North-Western Ghost bubble are very small for the sections of the filament that point towards the centre of the cluster, implying that they probably move at to the line of sight.
Very Long Baseline Interferometry (VLBI) maps of the region close to the core show an asymmetry between the southern and northern jets. While the southern jet is seen at all radio frequencies, the inner parts of the northern jet are not detected below . At the lower frequencies free-free absorption has been shown to be a reason why not all of the jet is seen (Walker et al., 2000). At higher frequencies, the inclination of the jet would play a role, with the southern one being inclined towards us. The amount of beaming, and hence asymmetry depends on the jet’s bulk velocity. This inclination of the jet matches the orientation of the larger scale lobes; the northern Inner on may be behind the older Outer one.
Measurements of the VLBI jets can give some constraints on the current jet direction. Krichbaum et al. (1992) calculate that the jet is at to the line of sight, and even close to the core for the milliarcsecond jet; however they find the jet to be at to the line of sight when observed at arcsecond scales, requiring it to bend by . We take the jet to be at to the line of sight.
3 Other Features
3.1 Low Temperature Whorl and Ancient Bubbles
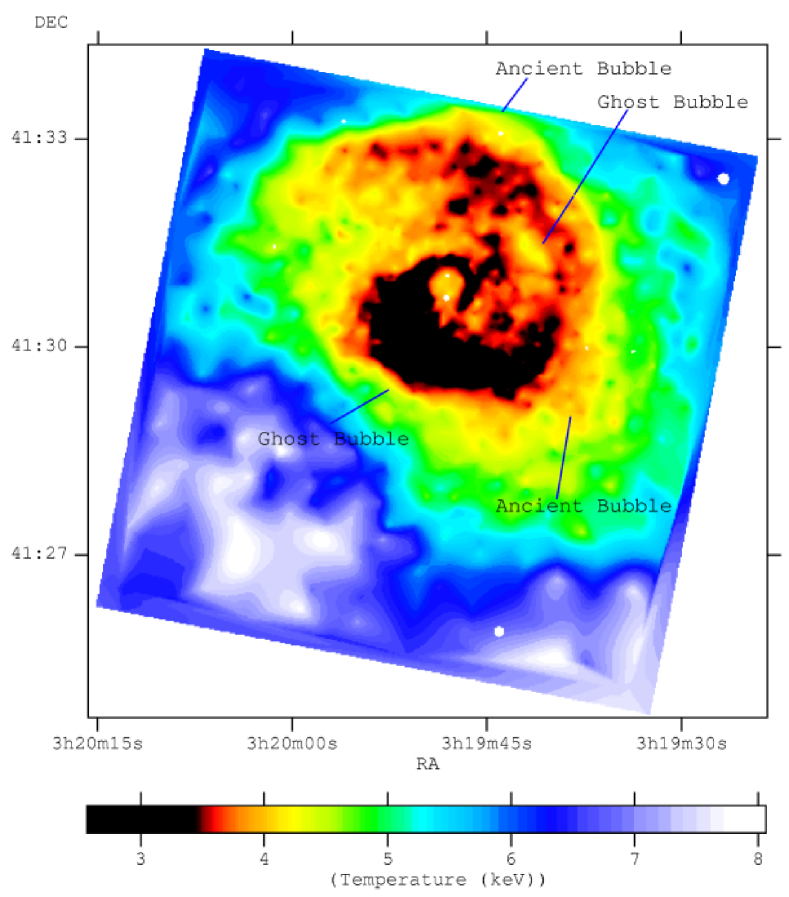
A spiral structure in the Perseus Cluster was first noticed by Churazov et al. (2000) and is seen in the temperature maps of Sanders et al. (2004) (Fig. 3). Fabian et al. (2000) suggested that this whorl could arise from the merger of a cool subcluster, as stripping of gas as it passed through the ICM would have left a wake. It could also form as the result of cooling gas falling into the centre of the cluster if the gas started with some initial angular momentum. However, bulk motions of the gas would be expected to have an effect on the H filaments (Section 3.2) and as they are linear this is unlikely as an explanation. If the jet is precessing, then the bubbles rise through the ICM at different position angles. They would push low temperature material in front of them or drag it up in their wake as they rise. The North-Western Ghost bubble falls on the inner edge of this whorl. There is also a hint that there is an even older (“ancient”) bubble to the North, seen as a crescent-shaped bump on the outer surface of this whorl (3h19m45s, 41:33∘) (Fig. 3). If this is an ancient bubble, then the decrement in the X-ray emission is now so small that it cannot be clearly seen in the X-ray images of the cluster. However the change in the temperature of the ICM caused by its motion up through the cluster is still visible.
This whorl is most easily explained with a precession model where the precession axis is face-on to us with a large () opening angle. As the bubbles detach from such a slowly clockwise-precessing jet they push up cooled, low temperature gas from the centre of the cluster. The next bubble lifts material from a slightly different position angle. This low temperature gas could be connected together by magnetic fields present in the cluster. Thus the portions of gas which are not lifted/pushed up by the bubbles are pulled up by the portions of gas that are, and so a whorl forms as opposed to discrete portions of gas around the rising bubbles.
The interaction of the Northern bubbles (Ancient and Ghost) with the whorl is fairly clear, the Southern Outer bubble also sits behind it and so could just be starting to lift this section of the low-temperature gas out of the centre of the cluster. There is some extension of this cool gas to the West in the same direction as a high abundance ridge presented in Sanders et al. (2005). This has also been interpreted as the remnants of an ancient bubble which lifted up the enriched material from the centre of the cluster. The interaction of the Southern Ghost bubble with the low temperature gas is not as clear, but it sits just South the coolest gas at the centre of the cluster. It may have lifted cooler gas out from the centre, but if it were travelling close to the line of sight, in projection the distance the gas would have appeared to have been moved is not that far.
It would be expected that if this whorl is the result of the jet/bubbles interacting with the ICM, then two spirals should be seen, one resulting from each jet. However, it seems as if there is only one. The explanation for this could be that the cooling has resulted in an asymmetric arrangement of gas. The northern bubbles could then have broken through this gas, whereas the southern ones have detached in such an orientation that the spiral appears continuous.
The whorl may, of course, be the result of a chance projection of two rings; a larger outer one which forms the northern and south-western parts of the whorl and an inner one around the northern outer bubble and the eastern part of the southern younger bubbles. We do not offer an explanation of the formation of this structure but merely put forward than the the whorl may not be one single structure.
3.2 H Filaments
The large H nebula around NGC 1275 has been studied at a variety of wavelengths (Minkowski, 1957; Lynds, 1970), and deep images obtained by the WIYN telescope show extended filaments which stretch over from the central galaxy (Conselice et al., 2001). Fabian et al. (2003b) showed that there was a correspondence between the soft X-ray and the H filaments. They also showed that the filaments may represent the flow lines of the ICM in the wake of passing bubbles, for example the “horseshoe” filament which sits behind the North-Western ghost bubble. There is a large collection of filaments stretching up northwards from the cluster in the direction of the possible ancient bubble mentioned above. If the northern ancient bubble is a real feature and the filaments are linked with it, then they are likely to have been drawn up out of the cluster by the passage of the bubble. Sanders et al. (2005) also find evidence for filaments pointing in the direction of the South-Western ancient bubble.
3.3 Spiral Arms in NGC1275
In Hubble Space Telescope (HST) images of the nucleus of NGC 1275, ripples were noticed in the galaxy light (Holtzman et al., 1992; Carlson et al., 1998) which resemble the arms of spiral galaxy. These ripples spiral in the same sense as the low-temperature whorl seen in the X-ray gas (Fig. 3) and so may be connected. If there is a precessing black hole at the centre of the galaxy, then the precession of the jet may be linked with these features.
4 Precessing Jet Model
From the shape of the low temperature whorl, the precessing jet may arranged such that the precession axis points close to the line of sight, with an opening angle of around (wide cone), or, as there is some reflection symmetry about the East-West axis a narrow cone precession where the precession axis is aligned North-South with a smaller opening angle.
To describe the precessing jet, the model outlined in Barker & Byrd (1981) has been adapted and is shown in Fig. 4, where is the angle the precession axis makes with the line of sight, and is the angle the jet makes with the precession axis. The angle the jet makes with the line of sight, , is given by:
| (1) |
where is the phase angle of a clockwise rotating jet, and is when the jet points towards Earth. When then .
If is the angle between projected direction of the jet on the plane of the sky and the projected direction of the precession axis, then
| (2) |
An extreme value of occurs at .

| Angle from North † | Timescales‡/ | |||
|---|---|---|---|---|
| Lobe | N | S | N | S |
| Jet | ||||
| Inner | ||||
| Outer | ||||
| Ghost | ||||
| Ancient | ||||
† The angles are measured Clockwise when looking at the figures presented here.
‡ The timescales (ages) have not been adjusted for projection effects.
Note: All angles and timescales are approximate. The Ancient bubbles are discussed in Section 3.1.
The angles from North (clockwise as seen in the Figures) and the timescales for all the bubbles are listed in Table 1. We have used the sound speed timescale for the Inner and Outer bubbles and the buoyancy timescale for the Ghost and Ancient bubbles. The buoyancy timescales estimate the time taken for a bubble of the currently observed size to rise buoyantly from the centre of the cluster through a uniform medium of that it is currently observed to be in. The sound speed timescale estimates the time taken for a bubble of the currently observed size to be blown if the expansion is subsonic. These two timescale measures are different, but provide the best estimate of the age of the bubbles at different stages in their formation (for further discussion of these timescales see Dunn & Fabian (2004); Dunn et al. (2005)). The difference in timescales between the Inner and Outer bubbles is small (), whereas the differences are larger between the Outer/Ghost and Ghost/Ancient bubbles. This may be a result of the different estimates of the timescales that have been used. The buoyancy timescale of a bubble, being a rise time, is generally larger than the sound speed timescale, which is an expansion time, and so the jump in ages between the Outer and Ghost bubbles may be a result of this. It is unlikely that the differences are largly the result of anisotropies in the ICM, as the pressure exerted on the bubbles changes only by a factor of (Sanders et al., 2004). Projection effects may remove (or enhance) this jump as the sound speed timescale is unaffected by the orientation, being an expansion timescale; whereas the buoyancy timescale does depend on the inclination of the rise-path of the bubble to the line of sight.
5 Calculation of the Precession Parameters
When calculating the best fitting parameters, the angle of the jet to the line of sight has not been used as a constraint as the actual angle is uncertain. However, as the difference in the emission from the Northern and Southern parts implies that the southern jet is coming towards us, this has to be satisfied by the parameters.
As the Northern Ghost bubble appears to be moving close to the plane of the sky we assume that for this bubble. The shape of the Southern Outer bubble also appears to be such that it is also moving close to the plane of the sky; this has also been used to constrain the possible angles. However, as there are only two bubbles which provide constraints on , and these appear to move in the plane; a close to face-on precession axis with a high value for (around ) would also fit the data.
Although this arrangement is a possiblity, such an extreme opening angle would be very unusual for a black hole of this mass. Also it would be expected that the bubbles would have detached at all position angles over the course of a few precession timescales. However the position angles of the northern bubbles are very similar to those of the southern bubbles, almost mirror symmetry about an East-West axis.
From Equations 1 and 2 and the observed projected angles on the sky, the best fit occurs when the projected angle of the precession axis on the sky is (clockwise of North as seen in Fig. 1). Then there are various combinations of and which fit the observed data. However, we choose those with the smallest (precession opening angle) are or with ().
To decide which of the two scenarios is the more plausible we look at the VLBI jet. The Southern jet is brighter than the Northern jet, which implies that it is Doppler beamed, and so is thought to be travelling towards us. The angles of the jet to the line of sight close to the radio core are around (Krichbaum et al., 1992). This implies that the precession axis is pointing away from Earth in the North; hence is preferred as the orientation.
We assume that the jets are precessing anti-clockwise when viewed down the precession axis as shown in Fig. 4. There are usually two possible phase angles () for those bubbles which have no constraint on . The single values have been chosen from the distance travelled by the bubble and also from the observed shape; for example, the Southern Ghost bubble could have travelled at either or to the line of sight. We choose as, if it were travelling at , its true age would be much older than calculated and the X-ray depression would not be expected to be visible. It also appears to be more in cross-section rather than face on. Similar arguments have been used to choose the angles for the other bubbles.
| Phase angle,† | Angle to l.o.s. | Timescales‡ | ||||
|---|---|---|---|---|---|---|
| Lobe | N | S | N | S | N | S |
| Jet | ||||||
| Inner | ||||||
| Outer | ||||||
| Ghost | ||||||
| Ancient | ||||||
† The phase angle is measured for the Northern jet, and the precession is assumed to be clockwise as see in the images presented here.
‡ The timescales have now been adjusted for projection effects. They are accurate to around per cent. The sound speed expansions timescale has been used for the Inner and Outer bubbles, the buoyancy rise time for the Ghost and Ancient bubbles.
Note: All angles and timescales are approximate. Timescales in .
6 Timescales
To calculate the precession timescales we use the change in phase between the Ghost and the Outer bubbles, as these are likely to be moving rectilinearly and have their ages estimated using the same method. In the assumption that the jet is precessing clockwise, then for the Northern jet and ; for the Southern jet and . This leads to precession timescales of and for the Northern and Southern jets respectively, which agree very well. For the other precession timescales see Table 3.
| North | South | |||
| GhostOuter | ||||
| Average | ||||
| AncientGhost | ||||
| Average | ||||
| OuterJet | ||||
| Average | ||||
Notes: and in .
Instead of using the Inner bubbles we used those for the VLBI jets when comparing to the Outer bubbles. The difference in ages between the Inner and Outer bubbles is very short, which would give a very rapid precession timescale. In the assumption that the VLBI jet is powering the Inner bubbles, it is more sensible to choose the parameters for the jets, as the Inner bubbles may still be forming. The change in phase angle between the Inner bubbles and the jets is in the correct sense for a counter-clockwise precessing jet (in the assumption that the Inner bubbles are ).
There is good agreement between the pairs of bubbles on the value of the precession timescale, . There is a large discrepancy between the different bubble pairs. The precession may be speeding up, which would explain the decrease in the precession time; however the acceleration would be very rapid - over the course of rotations () the precession timescale changes by around a factor of , from to .
It would be expected that the precession timescale would be the same over many cycles and so we assume that, as the precession timescale for the OuterJet is the shortest, then this is the precession time. The for the GhostOuter and the AncientGhost are much longer, however if an extra precession cycle occurred between the Ghost and Outer bubbles; i.e. for the Northern pair, this would give a precession timescale of which is much closer to that for the OuterJet. For the number of cycles required for the other bubbles see Table 4 .
| North | South | |||
|---|---|---|---|---|
| GhostOuter | ||||
| AncientGhost | ||||
| OuterJet | ||||
Notes: and in . from
Table 4 shows that, as a result of the large difference in timescales for the Ancient Northern and Southern bubbles, an extra precession cycle is required if the precession timescale is fairly constant. This could result if we have mis-identified the generation the southern Ancient bubble belongs to; i.e. that it is from an even older set, and the features of the true Ancient bubble have been lost. It may also mean that the bubbles detach at vastly different times; the timescales of these old bubbles are calculated using buoyancy arguements, so if the northern Ancient bubble detached a long time after the southern one, or rose much more slowly, then this may be the result.
The for the OuterJet are smaller than the other estimates but this can be explained as the bubbles, which correspond to the current position of the jets, are still forming and so the precession timescale for these two may easily be larger. However these calculations show that the precession timescale for the SMBH in the centre of the Perseus Cluster is around .
7 Discussion
In the calculation of the precession parameters we have assumed that the directions in which the bubbles are observed to be moving match the directions of the jets at the time when the bubbles were just forming. As the timescales for the formation of a bubble () are shorter than the precession timescale for the jet (), then the bubble will finish forming before the jet has moved on (though this would depend on the exact formation mechanisms of the bubbles). The travel direction of the bubbles may therefore indicate the average phase angle of the jet during the time of their formation. However, some bubbles may rise up in a direction corresponding to the direction of the jet towards the end of their inflation phase, and others in the direction from the beginning of their formation. There is therefore some uncertainty in the phase of the precession corresponding to the bubbles and hence in the inferred precession times.
We have also assumed that the bubbles are not deflected from their path once they start to rise up. The bubbles would be expected to travel up out of the potential well of the cluster, however a denser region of the ICM may deflect the bubbles to different observed position angles.
The “ancient” bubbles that have been used to calculate the timescales may not be the remnants of very old bubbles, but just chance features in the ICM which have been misinterpreted. However the fact that the Northern Ancient bubble sits close to the low-temperature whorl, and has H filaments pointing from the centre of the cluster in its direction; the high abundance ridge which corresponds to an extension of the radio mini-halo and the low-temperature whorl along with the discovery of some filaments pointing towards the South-West (Sanders et al., 2005) for the Southern Ancient bubble all point towards the fact that these features are the remnants of earlier generations of bubbles.
What can be seen from the phase angles at which the bubbles detach is that they do not necessarily detach at the same time. It seems likely that the jets produced by the SMBH are of the same composition and power, and as such provide the same amount of energy at the same rate into the bubbles. From this, in the case that the ICM were perfectly uniform, the bubbles would be expected to grow at very similar rates and so also detach at very similar times. However it is very likely that the ICM is not perfectly uniform, the bubbles may expand at slightly different rates, detaching at slightly different times.
The change in the phase of the precession between the detaching of the Ghost and Outer bubbles is very similar (see Table 3), even with an extra precession cycle. However there is a difference of up to between the detaching of the Northern and Southern bubbles for a given “generation”, corresponding to around , a large fraction of the bubble formation time. In the case of the change between the Ancient and Outer bubbles, there is more than a complete precession cycle difference between the Southern and Northern bubbles (see Table 4). If the Ghost bubbles detached at similar times, then the Southern Ancient bubble detached about one precession cycle before the Northern Ancient bubble. Whether the Southern Ancient bubble belongs to a generation older than that of the Northern Ancient bubble, and the true Southern Ancient bubble has not yet been identified, or if the bubbles did detach at vastly different times is currently unclear.
This implies that, if the precession is long lived, there are cycles in the precession when no bubbles detach. This may mean that the SMBH is dormant and its duty cycle is less than 100 per cent. What may also happen is that the jet does not have sufficient power to inflate a bubble, but is still supplying energy to the central regions of the cluster by other mechanisms.
If this were the case, then at times when the jet were less powerful, and possibly less energy were being supplied to the centre the ICM may cool and flow inwards for a while. When the jets become more powerful, they interact with the cool gas and lift it up out of the centre, the result of which we see as the whorl.
The spirals seen in the optical emission from NGC1275 (Holtzman et al., 1992; Carlson et al., 1998), which are in the same sense as the low-temperature whorl are explained if we are seeing them from below. The precession of the jet is anti-clockwise when seen from above, however the precession axis is tilted away from the line of sight, and so the end of a constant length precessing jet would appear to move in a clockwise direction, which is the same sense as the spirals seen in NGC1275. Their inclination means that we see them apparently move clockwise.
The best fitting parameters for the precession of 3C84 are consistent with those presented in Gower et al. (1982) who compared models of precessing jets to the observed radio emission. Their largest timescale is which is close to the one obtained here. The opening angles of the precession have a large range, with an average of around which is smaller than the one found for 3C84, but not inconsistent.
Recent work by Lodato & Pringle (2005) show that if black hole’s and the accretion disc’s angular momenta were counter-aligned to start with, then over the course of what would be one precession period the spins would align (in the case where the disc angular momentum is large compared to the hole’s). During the course of this alignment the spin axis of the black hole traces out an arc on the sky. The resultant position angles of the radio jets, and hence bubbles, could give the appearance of steady precession in the case of the Perseus Cluster.
8 What could cause the Precession?
Although a precessing jet model is a possible explanation for the observation that the bubbles occur at different position angles in the cluster, what is not clear is why the black hole would be precessing. In a recent comparison between some bipolar Planetary Nebulae and the bubbles observed in clusters, there are two possible mechanisms causing the precession (Pizzolato & Soker, 2005). Firstly there could be a binary black hole at the centre of the NGC1275 galaxy, causing the disc of the primary to precess (Katz, 1997). The second suggestion is that there is an instability in the disc which warps it and so causes the precession (Pringle, 1997). The timescales predicted from these two models are similar; for the warped disc model
(Equation 4.11 in Pringle (1997)) where is the Shakura & Sunyaev (1973) viscosity alpha-parameter; and for the binary model
where , is the mass of the accreting black hole, is the mass of the object loosing mass, and is the total mass of the binary system. The separation between the components is for a circular orbit, is the disc radius and is the tilt angle between the orbital plane and the disc angle. Pizzolato & Soker (2005) prefer the binary-driven precession model to the disc instability driven one because there are point symmetries in the bubbles in the clusters, assumed to be caused by a precessing jet. The warped-disc model would cause a stochastic rather than a regular precession. Both scenarios could produce precession times close to those inferred from the bubble directions.
9 Bubble Dynamics
In a still fluid, small gas bubbles rise rectilinearly, however larger ones follow zig-zag or spiral paths. This phenomenon has been called “Leonardo’s Paradox” as the first recorded observations and attempts at explanations of this behaviour were performed by Leonardo da Vinci (Prosperetti, 2004; da Vinci, 1515). Since Leonardo’s time there have been many attempts to explain the phenomenon and determine the parameters which cause the change between linear and periodic motion.
| Reynolds Number | ||
|---|---|---|
| Weber Number1 | ||
| Galileo Number | ||
| Strouhal Number | ||
| Froude Number | ||
| Drag Coefficient | ||
| Fluid Parameter |
() is the (average) bubble velocity, the bubble radius2, is the kinematic viscosity (), and is the density of the fluid and sphere respectively, is the surface tension, is the frequency of oscillation of the bubble motion, is the asymptotic Reynolds number, is the gravitational acceleration 1Our definition of is the square of that in Hartunian & Sears (1957). 2In some cases an equivalent radius is used instead.
The motion of spheres and bubbles in fluids has been studied experimentally as well as with numerical simulations. Using solid spheres may not at first sight seem appropriate, but if the liquid is not pure (“contaminated”) then surfactants on the fluid-bubble interface (partly) immobilise the fluid, similar to the conditions found on the surface of a solid object. In this section we review some of the work on bubbles rising in fluids to see whether any of these effects could arise for the bubbles in the Perseus Cluster and cause the bubbles to be found at different position angles. In the course of these studies the fluids in which the bubbles are moving and the motions of the bubbles have been characterised by dimensionless quantities which are shown in Table 5.
The fluid in which the bubble moves is described by a dimensionless . The behaviour of with depends on the of the fluid. Fluids with (e.g. filtered water, methanol) are “fast” and show the characteristic dip in at , which corresponds to . “Slow” fluids (e.g. mineral oil, water-glycerin mix) have and do not show this dip (Hartunian & Sears, 1957).
The critical threshold for the onset of the non-rectilinear motion depends on the purity of the liquid – the Reynolds number being important for contaminated liquids () and the Weber number for pure liquids ().
Numerical simulations show that the wake behind a sphere which is held fixed in a uniform flow is axisymmetric up to . Above this value a planar symmetric wake is found, consisting of two steady counter-rotating threads. At the planar symmetric wake become time-dependent; oppositely signed stream-wise vortices form a series of loops resembling hairpin vortices. Eventually, as continues to increase the wake behind the sphere becomes turbulent. The exact values of depend on the density ratio, (Jenny et al., 2004). The results do not change dramatically if the sphere is moving freely in a still fluid. de Vries et al. (2002) investigate bubble motion as opposed to sphere motion and state that in the case of bubbles , however this discrepancy may arise from the purity of the fluid.
Using numerical simulations, Jenny et al. (2004) investigated the instabilities in the motions of spheres (rising and falling) in Newtonian fluids finding that , for a density ratio of , with a . They find that a range of behaviours occur for bubbles moving with different density ratios and Galileo number (see their Fig. 29). For a given , the wake behind a sphere starts axisymmetric, then as the Galileo number increases the motion becomes steady but oblique. Continuing to increase causes oscillations to occur during the oblique ascent, eventually causing zig-zag motion. Eventually at the motion becomes chaotic.
There are two types of motion when the wake becomes time dependent – helical and zig-zag. The transition between the two types of motion is thought to depend on the bubble size, observed experimentally by Lunde & Perkins (1997). Larger bubbles deform from spherical shapes to ellipsoidal ones and numerical simulations by Mougin & Magnaudet (2002) show that the transition between the two types of periodic motion occurs for an aspect ratio, .
Hartunian & Sears (1957) state that the path instability does not occur for small and spherical-cap bubbles, but only for intermediate sized ellipsoidal bubbles, where the motion ranges from oscillations to gentle rocking about the direction of motion. It is possible for the zig-zag motions to cause deflections from a vertical path by to (Lunde & Perkins, 1997) which is similar to the position angles of the North-Western Ghost and the South-Western Ancient bubbles.
9.1 Spherical Cap Bubbles
Wegener & Parlange (1973) show that for spherical cap bubbles. In the assumption that this relation continues at much larger volumes, then for the North-western Ghost bubble, the buoyancy velocity calculated during the work of Dunn et al. (2005) is and the radius of the bubble is . Using the enclosed mass and to obtain an estimate on the gravitational field, , gives . Therefore, if the relation in Wegener & Parlange (1973) holds up to these bubble sizes, then it is likely that the observed X-ray decrement is, and behaves like, a spherical cap bubble.
In this case it could be assumed to follow the behaviour observed by Hartunian & Sears (1957), i.e. it rises rectilinearly. Therefore it could be assumed that the other Ghost and Ancient bubbles would have travelled linearly out from the cluster after they had attained the spherical-cap shape.
9.2 Cluster Bubbles
The bubbles in the Perseus Cluster as analysed by Fabian et al. (2003b) inferred that the ICM was viscous, and as such the Reynolds number would be expected to be less than . The kinematic viscosity inferred from this Reynolds number and the North-western Ghost bubble is . Therefore it could reasonably be assumed that the ICM is a “slow, contaminated” fluid and as such the Reynolds number rather than the Weber number would determine the onset of path instability in the bubbles.
Wegener & Parlange (1973) state that spherical cap bubbles rise steadily with no periodic motion, and so the path instability would apply to the newly formed bubbles as they would be spherical or ellipsoidal. The critical Reynolds number for the onset of the path instability is . Therefore, as the upper limit on the Reynolds number of the ICM is , the bubbles could have been oscillating about their direction of motion shortly after their creation. As the bubbles’ shape evolved into a spherical cap their oscillations reduced and they may then end up travelling at a different position angle than that of the jet.
For the South-western Outer bubble, using the kinematic viscosity from Fabian et al. (2003b), and assuming that the density ratio , then the Galileo number is , which is in the regime of chaotic motion. This is unlikely as there are indicators in the X-ray and H emission that the motion of the bubbles has been fairly steady. As such the Galileo number would be expected to be much lower, . This implies that the Reynolds number, which has been used to estimate the viscosity, would be around , giving a viscosity of . There is no large change in these values if were used instead.
The mechanism which causes the onset of path instability in the rising bubbles is currently uncertain. However, if the onset of the path instability occurs at the same values of the Galileo and Reynolds numbers at the scales observed in clusters of galaxies, then, as the calculated values for these numbers fall in the range where the bubble motion would be expected to be non-rectilinear, the bubbles could oscillate as they rise. This motion, however, would not last for long as the bubbles appear to evolve into spherical caps (which show no oscillatory motion, see Section 9.1) comparatively quickly, before complete oscillations would have taken place. The position angles of the inner bubbles are such that the deviations from a linear rise would have to start very quickly, almost immediately after the bubbles detached.
The results of the experiments discussed in the above sections have all been performed on the Earth where the gravitational potential can be regarded as 1-dimensional. In the environment of the cluster the gravitational potential is spherically symmetric. What effect this would have on bubbles which are oscillating about their direction of motion is not clear, and probably depends on relative sizes of the bubble to the cluster potential. Bubbles moving obliquely in experiments on Earth may move in spirals in a cluster, which could be an explanation for the low temperature structure observed in the temperature maps of Sanders et al. (2004) if the bubbles did not evolve into a spherical-cap shape.
However this does depend on there being sufficient time for the oscillations to occur before the bubble evolves into a spherical cap shape; the Southern Outer bubbles’ shape as seen in the X-rays already appears similar to that of a spherical cap. If the Strouhal number relation also holds up to these bubble volumes, then . This implies that there would be no chance for any oscillation before the bubble shape evolves into a spherical cap.
The radial arrangement of the H filaments in the cluster strongly suggest that the bubbles move in a linear fashion, as oscillating bubbles, or bubbles moving in spirals would be expected to drag the filaments with them as they rise.
10 Conclusions
The observations of the bubbles in the Perseus Cluster show that they are at different position angles with respect to the cluster centre. We have outlined several interpretations for this behaviour, including a jet which is precessing or moving around. For the precessing jet we find that the best fit precession parameters are that the projected precession angle offset is westwards of North; the precession axis is tilted away from the line of sight and the precession opening angle is . Using the timescales for the bubbles the precession timescale is around . We review some work on the motion on bubbles rising in fluids and the onset of path instability. The conditions of the motion in the cluster are such that the oscillations about the direction of motion are possible for the young bubbles, but the timescales are of order , by which time the bubbles have evolved into spherical caps, which do not exhibit this type of motion. A steady precession or motion of the jet may be responsible for the whorl seen in the temperature structure. Alternatively, we note that the whorl may be an artifact of a partial inner circle and a partial outer ellipse, connected together in the SE. The structures at the centre of the Perseus cluster provide an enigmatic view of the past history of this region.
Acknowledgements
ACF and RJHD acknowledge support from The Royal Society and PPARC respectively.
References
- Barker & Byrd (1981) Barker B. M., Byrd G. G., 1981, ApJ, 245, L67
- Blundell & Bowler (2005) Blundell K. M., Bowler M. G., 2005, ApJ, 622, L129
- Böhringer et al. (1993) Böhringer H., Voges W., Fabian A. C., Edge A. C., Neumann D. M., 1993, MNRAS, 264, L25
- Bridle et al. (1979) Bridle A. H., Davis M. M., Fomalont E. B., Willis A. G., Strom R. G., 1979, ApJ, 228, L9
- Carlson et al. (1998) Carlson M. N. et al., 1998, AJ, 115, 1778
- Churazov et al. (2000) Churazov E., Forman W., Jones C., Böhringer H., 2000, A&A, 356, 788
- Conselice et al. (2001) Conselice C. J., Gallagher J. S., Wyse R. F. G., 2001, AJ, 122, 2281
- da Vinci (1515) da Vinci L., c. 1505-1515, Codex Leicester, E. MacCurdy, The Notebooks of Leonardo da Vinci (Reynal & Hitchcock, New York, 1938) Vols. 1 & 2
- de Vries et al. (2002) de Vries A. W. G., Biesheuvel A., van Wijngaarden L., 2002, Int. J. of Multiphase Flow, 28, 1823
- Dunn & Fabian (2004) Dunn R. J. H., Fabian A. C., 2004, MNRAS, 351, 862
- Dunn et al. (2005) Dunn R. J. H., Fabian A. C., Taylor G. B., 2005, MNRAS, accepted, astro-ph/0510191
- Ekers et al. (1978) Ekers R. D., Fanti R., Lari C., Parma P., 1978, Nature, 276, 588
- Fabian et al. (2002) Fabian A. C., Celotti A., Blundell K. M., Kassim N. E., Perley R. A., 2002, MNRAS, 331, 369
- Fabian et al. (2003a) Fabian A. C., Sanders J. S., Allen S. W., Crawford C. S., Iwasawa K., Johnstone R. M., Schmidt R. W., Taylor G. B., 2003a, MNRAS, 344, L43
- Fabian et al. (2003b) Fabian A. C., Sanders J. S., Crawford C. S., Conselice C. J., Gallagher J. S., Wyse R. F. G., 2003b, MNRAS, 344, L48
- Fabian et al. (2003c) Fabian A. C., Sanders J. S., Crawford C. S., Ettori S., 2003c, MNRAS, 341, 729
- Fabian et al. (2000) Fabian A. C. et al., 2000, MNRAS, 318, L65
- Gower et al. (1982) Gower A. C., Gregory P. C., Unruh W. G., Hutchings J. B., 1982, ApJ, 262, 478
- Gull & Northover (1973) Gull S. F., Northover K. J. E., 1973, Nature, 244, 80
- Hartunian & Sears (1957) Hartunian R. A., Sears W. R., 1957, J. Fluid Mech., 3, 27
- Hatch et al. (2005) Hatch N. A., Crawford C. S., Fabian A. C., Johnstone R. M., 2005, in prep.
- Hjellming & Johnston (1981) Hjellming R. M., Johnston K. J., 1981, ApJ, 246, L141
- Holtzman et al. (1992) Holtzman J. A. et al., 1992, AJ, 103, 691
- Jenny et al. (2004) Jenny M., Dušek J., Bouchet G., 2004, J. Fluid Mech., 508, 201
- Katz (1997) Katz J. I., 1997, ApJ, 478, 527
- Krichbaum et al. (1992) Krichbaum T. P. et al., 1992, A&A, 260, 33
- Lodato & Pringle (2005) Lodato G., Pringle J. E., 2005, MNRAS, submitted
- Lunde & Perkins (1997) Lunde K., Perkins R. J., 1997, ASME Fluids Engineering Division Summer Meeting, FEDSM97
- Lynds (1970) Lynds R., 1970, ApJ, 159, L151
- Margon (1984) Margon B., 1984, ARA&A, 22, 507
- Minkowski (1957) Minkowski R., 1957, in IAU Symp. 4: Radio astronomy, p. 107
- Mougin & Magnaudet (2002) Mougin G., Magnaudet J., 2002, Phys. Rev. Lett., 88, 014502
- Pedlar et al. (1990) Pedlar A., Ghataure H. S., Davies R. D., Harrison B. A., Perley R., Crane P. C., Unger S. W., 1990, MNRAS, 246, 477
- Pizzolato & Soker (2005) Pizzolato F., Soker N., 2005, Elsevier Science, astro-ph/0501658
- Pringle (1997) Pringle J., 1997, MNRAS, 292, 136
- Prosperetti (2004) Prosperetti A., 2004, Phsyics of Fluids, 16, 1852
- Sanders et al. (2004) Sanders J. S., Fabian A. C., Allen S. W., Schmidt R. W., 2004, MNRAS, 349, 952
- Sanders et al. (2005) Sanders J. S., Fabian A. C., Dunn R. J. H., 2005, MNRAS, 360, 133
- Shakura & Sunyaev (1973) Shakura N. I., Sunyaev R. A., 1973, A&A, 24, 337
- Walker et al. (2000) Walker R. C., Dhawan V., Romney J. D., Kellermann K. I., Vermeulen R. C., 2000, ApJ, 530, 233
- Wegener & Parlange (1973) Wegener P. P., Parlange J.-Y., 1973, Ann. Rev. Fluid Mech., 5, 79