A Close Look at the Population of Supersoft and Quasi-Soft X-Ray Sources Observed in M31 with XMM-Newton
Abstract
The deepest X-ray images of M31, obtained with XMM-Newton, are examined to derive spectral and statistical properties of the population of the softest X-ray sources. Classifying supersoft X-ray sources (SSS) with criteria based on the same hardness ratios defined for recent Chandra observations, a quarter of the selected SSS turn out to be supernova remnants (SNR). Another quarter of SSS are spatially coincident with recent classical novae (but they are less than 10% of the nova population observed in the last 25 years). Only 3 among 15 non-SNR SSS show clear variability with X-ray flux variation of more than one order of magnitude within few months. Two of these sources display additional, smaller amplitude variability on time scales of several minutes. Their broad band spectra and those of the novae are approximately fit with a blackbody or white dwarf atmospheric model at near-Eddington luminosity for the distance of M31. Two SSS appear to reach very large, perhaps super-Eddington luminosities for part of the time, and probably eject material in a wind until the luminosity decreases again after a few months. One of the two objects has some characteristics in common with Ultra Luminous X-ray Sources observed outside the Local Group.
Most Quasi-Soft Sources (QSS), among which also a few SNR are selected using the hardness ratio criteria, are repeatedly detected. Several QSS are better fit by a power law spectrum, but some faint, apparently blackbody-like QSS with temperatures T100-200 eV and luminosity 1036 erg s-1 at M31 distance do exist. I discuss the possibilities that most QSS may be SNR in M31, or foreground neutron stars. Two X-ray sources with both a soft and hard component are in the positions of a recurrent nova and another object that was tentatively classified as a symbiotic nova. These two sources may be black hole transients.
1 Introduction
One of the main discoveries of Einstein and especially of ROSAT were the supersoft X-ray sources (hereafter, SSS). SSS emit detectable X-rays only at energy below 1 keV, with very large luminosity in the range 1036-1038 erg s-1, and their spectrum is approximately fit with a blackbody at temperature in the range 150,000-1,000,000 K. Since these sources are very luminous, but very “soft”, they are much more easily detected in Local Group galaxies, towards which the column of neutral hydrogen N(H) is low, than in the Galaxy (see Greiner 2000 and references therein). The most luminous SSS are even detected outside the Local Group (Swartz et al. 2002, Di Stefano & Kong 2003, 2004, Kong & Di Stefano 2003 and 2005). Even if the whole sample of SSS, selected on purely phenomenological criteria, is not a homogeneous class, there is evidence that a large fraction of these sources in the Local Group are extremely hot, accreting white dwarfs (WD) in close binaries, burning hydrogen in a shell (see Kahabka & van den Heuvel 1997). Close binary SSS (CBSS) include post-outburst recurrent and classical novae, the hottest symbiotic stars, and other low mass X-ray binaries containing a WD, with typical orbital periods between 4 hours and 1 day. The recently rekindled debate on the nature of the progenitors of type Ia supernovae (SNe Ia) focuses often on this class of sources, as prototypes of single degenerate binary SNe Ia progenitors (e.g. van den Heuvel et al 1991., King et al. 2003, Yoon & Langer 2003, Starrfield et al. 2004). SSS appear often to be transient or recurrent in X-rays, or at least variable in X-ray flux (e.g. Greiner et al. 2000, 2004a).
Most CBSS are indeed expected to be variable. There are basically three mechanisms for variability of the binary SSS described above. 1) A periodic radius expansion is accompanied by variation in the mass transfer rate , and feedback in the nuclear burning rate (e.g. Cal 83, Greiner & Di Stefano 2000), recurrently causing increase the optical and UV luminosity to increase and the X-ray luminosity to decrease. 2) Repeated thermonuclear hydrogen shell flashes (unlike novae, without mass ejection) are expected in a regime of mass accretion rate, , that varies depending on the model, but is around 10 M⊙ year-1. Since the upper limits on the X-ray flux before the new generation of X-ray satellites were not very high and the observations of SSS were seldom repeated, we know very little about thermonuclear flashes. 3) At higher , all the energy produced in thermonuclear burning is immediately radiated (Fujimoto 1982, Kovetz & Prialnik 1994), and generally we expect to find persistent X-ray sources, which are the most likely candidates for progenitors of neutron stars born by accretion induced collapse (AIC) and/or of type Ia supernovae (see Yungelson et al. 1996, Starrfield et al. 2004). However, at high there is another mechanism for variability. A ROSAT source, RX J0513.9-6951, is optically bright and “off” in X-rays for the 140 days of a recurrent cycle, then it undergoes a rapid transition in less than 4 days to the supersoft X-ray source stage, with decreased optical luminosity. This stage lasts for about a month, until in less than 2 days, the source returns to the previous state (Reinsch et al. 2000). The optical variation is only 0.8 mag in V, while the ROSAT PSPC count rate was measured to vary by a factor of more than 20. According to Hachisu & Kato (2003) RX J0513.9-6951 burns hydrogen in shell at the constant rate necessary to reach the SN Ia explosion. When more mass transfer rate is triggered than the rate at which it can all be burned, the outer layers of the WD expand and mass accreted from the secondary is suddenly lost in a wind, causing the X-ray off state and optical brightening. Independently of the final fate of a particular system, observing and studying shell-hydrogen burning WD, we obtain a glimpse on the evolution of potential SN Ia progenitors in general, a central problem of modern astrophysics. Even what we know about the acceleration of cosmic expansion depends on type Ia SN.
M31 is the most luminous and massive galaxy in the Local Group, and as such provides a large selection of nearby extragalactic X-ray sources, including SSS. At visual wavelength it is almost five times as luminous as the other spiral M33, and almost 16 and 80 times more luminous as our two nearby satellites, respectively the LMC and the SMC (Sparke & Gallagher 2000). The content of neutral hydrogen in M31 is estimated to be M⊙, about 30% more than the Galaxy. The central bulge is affected by a relatively low column density of neutral hydrogen, N(H) cm-2, and the surrounding region has only N(H) cm-2, as it is shown Supper et al.’s (1997) simplified model derived from Unwin’s (1981) maps. Most of the neutral hydrogen is concentrated in a thick star-forming “ring of fire” around it, with N(H)=7.7 cm-2, but the gas extends to a large radius, and it has a rather patchy structure, with both “holes” of low column density and dark clouds causing higher column density in small regions (see Davies et al., 1976, and Hodge 1981).
Due to its large stellar population and many regions with low N(H), M31 is ideal for investigating SSS. The M31 population was studied with ROSAT by Supper et al (1997), Kahabka (1999) and Greiner et al. (2004), with Chandra by De Stefano et al. (2004) and Greiner et al. (2004). XMM-Newton is the best suited satellite for this type of research outside the central region of the bulge (where the excellent spatial resolution of Chandra is very important), due to the high effective area, high sensitivity and quite good calibration of the EPIC detectors in the soft range. A comprehensive study of the XMM-Newton observations of SSS in M31 has not been published. De Stefano et al. (2004) and Greiner et al. (2004) examined most of the XMM-Newton exposures of M31, and recovered detections of the Chandra SSS as well as some originally found with ROSAT. Using criteria that are as equivalent as possible to the ones adopted by these authors, I performed an unbiased search for SSS in M31 in the XMM-Newton observations, using also two recent public images that were not yet available to the above authors. Moreover, I searched for common detections of a second large subset of ROSAT SSS identified by Kahabka (1999). In addition to a variability study, one of my aims is to make use of the large effective area and higher count rates of XMM-Newton to obtain as many broad band spectra as possible, to derive conclusions on the physical nature of these sources.
Last but not least, I also examined another class of sources, called Quasi-Soft-Sources (QSS) by Di Stefano et al. (2004), found in M31 and in other galaxies (Di Stefano & Kong 2004). These sources were discovered relaxing the search criteria of SSS based on the hardness ratios and extending them to sources with slightly harder spectra. Di Stefano et al. (2004) define QSS spectra as blackbodies with temperatures in the range 100-350 eV. It is important to bear in mind that this class of sources are not necessarily related to SSS, nor is there any evidence yet that some of them may be accreting WD. Using the XMM-Newton data, I also investigated the nature of QSS: are they really a new kind of X-ray sources with uniform physical characteristics ?
2 The data set: the XMM-Newton observations of M31
A description of the XMM-Newton mission is found in Jansen et al. (2001). The satellite carries three X-ray telescopes with 5 detectors, which were all used: EPIC-pn (Strüder et al. 2001, two EPIC-MOS (Turner et al. 2001), and two RGS gratings (den Herder et al. 2001). Due to the faintness both in X-rays and in optical of the sources studied, I could not use RGS data. Images were taken with the optical telescope with the Optical Monitor (OM) during a large part of the time, but they are either not deep enough to detect the counterpart of the large majority of the sources in M31, or they are effected by source confusion. The data were reduced using the ESA XMM Science Analysis System (SAS) software, version 6.1.0, and the latest calibration files available at the time of the analysis. The spectra were analysed with the XSPEC software package (Arnaud 1996) not only with the standard XSPEC models, but also WD atmospheric models studied for novae in the LMC (see Orio et al. 2003) and in the Galaxy (Rauch et al. 2005).
The beautiful XMM-Newton images, plotted on the contour of the Galaxy, can be seen in the survey article by Pietsch et al. (2005a). The parameters and characteristics of the exposures are summarized in Table 1. The position of of the image centers are given by Pietsch et al. (2005a). Four pointings of the central region of the galaxy, in full frame mode with a radius of 15 arcsec, were repeated every 6 months for 2 years, with integration times ranging from 3 to 18 hours. These exposures do not completely overlap. Also five regions with center around the major axis of the disk were observed, three in the North and two in the South of the galaxy, for about 18 hours each. Finally, one region was observed in the M31 halo for about 3 hours. All together, the area was 1.24 square degrees, which is small compared to 6.3 square degrees covered with ROSAT, but larger than the 0.9 square degree observed up to now with Chandra. Table 1 reports the dates of the observations, the nominal length of the exposure, the amount of effective exposure used after the intervals of background flares were excluded, the number of SSS observed in each exposure, the faction of detected previously known SSS over the total number observed, and the same ratio for QSS. The “EPIC chains” were run again with the updated calibration without using using special screening criteria (no “low threshold” at lower energy than 0.2 keV was set); this choice may yield systematically lower count rates than those measured by other authors using a different screening procedure. Since I was interested only on the softest sources, in order to exclude background and improve S/N I used only “single” events (PATTERN=0), and the conservative screening criterion FLAG=0.
During the time it took to complete this work, a catalog of M31 XMM-Newton sources has appeared (Pietsch et al. 2005a). For the faintest sources, the count rates I measured may differ from the catalog entries by 2-3 . In the catalog the background was chosen in a semi-automatic way, but there are often near-by sources and background fluctuations, which introduce complications. Moreover, many sources are faint and the count rates are measured with large error bars. Focusing on the problem of supersoft sources for which the background choice is more critical, I tried to pay particular attention to the background extraction for every single source. The authors of the catalog “flagged” 18 SSS chosen with hardness ratio criteria that are suitable for XMM-Newton EPIC-pn but not for Chandra, and imply that virtually all photons are detected at energy below 0.5 keV. In another very recent paper, in observations done with XMM-Newton, Chandra and ROSAT, 21 X-ray sources observed with these satellites are identified with recent novae in M31 (Pietsch et al. 2005b). The authors of this article include even 2 detections and have accomplished detections of the faintest sources with a method to combine the information given by the pn and and by the MOS together, on order to detect extremely faint sources (Pietsch 2005, private communication). I also identified X-ray sources with some recent novae, using more “conservative” criteria, and compare my conclusions with the ones of the above authors.
3 Selection based on hardness ratio
Since SSS and QSS have been recently been studied in M31 with Chandra (Di Stefano et al. 2005), in order to compare the populations of SSS and QSS detected with Chandra and XMM-Newton, a first step is to translate the criteria that were used for Chandra into XMM-appropriate ones. It is important to bear in mind that the hardness ratio criteria used to select SSS with ROSAT (e.g. Supper et al. 1997, 2001, and Kahabka 1999) were quite different from the ones used with Chandra, due to the very different energy range and spectral response of the two X-ray telescopes and their detectors. Since in the recent past and in the future both Chandra and XMM-Newton are the instruments used in studying populations of X-ray sources, using selection criteria as close as possible to the ones adopted with Chandra ACIS-S is a priority.
I examined first the XRT+EPIC-pn hardness ratios, since most sources are faint and were detected only with this detector. The two MOS yield better spatial resolution, and are very useful in observations near the bulge, but the lower limit on the luminosity of the detected sources is reduced by a factor of 5-6. XMM-Newton offers another great advantage for this study: a better calibrated response than ACIS-S for the low energy range, 0.2-0.5 keV, at which most of the flux is detected for these sources. The absolute calibration of the EPIC instruments is accurate to 10%, while relative calibration of EPIC-pn and EPIC-MOS is thought to be accurate to 1% in all the 0.3-1.0 keV range. In the 0.2-0.3 keV range the background is very high, but does not effect significantly the soft end of the spectrum of an extremely soft and luminous source like many of the SSS (see also Orio et al. 2003).
Di Stefano et al. (2004) examined three spectral bands: S (0.1-1.1 keV), M (1.1-2 keV), and H (2.0-7.0 keV). The first, basic criteria established by Di Stefano et al. (2004) to select a SSS is HR1=-0.8, which implies S/M9, and HR2=-0.8, or S/H9. Because EPIC-pn is much more sensitive than ACIS-S in the S band, but not so in the M band, and because of the high background (a “price” to pay using a telescope with larger effective area), it turns out that strict “Chandra-equivalent” criteria can be applied to SSS in the Magellanic Clouds and in the Galaxy only to the few brightest X-ray SSS in M31.
A Chandra ACIS-S ratio S/M9 translates in S/M30 and S/H19 for all possible models relevant to SSS, even considering a possible low luminosity “hard tail” due to thermal bremsstrahlung or even non thermal emission mechanisms. Let us suppose for instance a blackbody-like source at Tbb=50 eV and column density by N(H)= cm-2 with an additional thermal plasma emitting at kT=0.9 keV and at KT=5 keV. If we measure S/M9 and S/H9 with Chandra ACIS-S, using PIMMS we find the equivalent EPIC-pn (medium filter) harness ratios: S/M=33 and S/H20. The high background is a significant problem because we have to be able to measure very low values of count rates M and H in order to ensure the perfectly Chandra-equivalent algorithm can be applied (especially for the pn detector). Since typical 2 fluctuations on the background level in the M and H band are around 4 cts s-1, we need count rates S0.013 cts s-1 to make sure that the M and H values are statistically significant measurements, but few sources in M31 have such high count rates.
Note that Di Stefano et al. (2004, see also Di Stefano & Kong 2003) further classify sources into “SSS-3 ” (if the combined uncertainties on S, M and H make the hardness ratios also uncertain) and “SSS-HR” (if (S+S)9(M+M) and (S+S)9(H+H)), which pose the same background-related problems. It is obvious that application of the Chandra-appropriate algorithm for selection of SSS is background limited in the M and H bands. For the EPIC-MOS, the “Chandra-like” criteria are a little less difficult to apply, because we only need to verify that S/M14, but the MOS are even less sensitive than ACIS-S, and definitely fewer sources are detected with very low count rates.
For this reason, after carefully analysing what are the typical count rates necessary for detection in the XMM-Newton exposures of M31 and fluctuation of the background, I chose a different criterion for sources with EPIC-pn count rates 0.013 cts s-1, still using the same S,M and H band defined for Chandra by the above authors. If the M and H count rates are less than 2 above the background, I define a SSS a source for which S/M9.3 and S/H9. I verified that all the SSS defined as such with both Chandra and ROSAT, if observed and detected, were automatically selected as SSS in this way. (Note that all the ROSAT SSS are also defined as Chandra SSS, but not vice versa).
To select QSS, also the criteria given in Di Stefano & Kong (2003b) are limited by statistics and by the background if strictly applied to XMM-Newton. I therefore define a QSS a source with the hardness ratio HR3=(S+M)/(total counts)0.98. I verified that in this way, the QSS of Di Stefano et al. (2004) are consistently selected, and so are a few new sources that are approximately fit with blackbodies at kT350 eV, which is the required for QSS by Di Stefano et al. (2004). However, as discussed below, some QSS spectra are fit even better using a steep power law. All these “new” sources, except one, had not been observed with ACIS-S at the time Di Stefano et al. (2004) wrote their article.
Table 2 and 3 show the coordinates, proposed source identification, count rates measured with EPIC-pn and EPIC-MOS-2, and the parameters of the best spectral fit with either a blackbody or power-law model. For the sources in Table 2, the M and H count rates are always negligible, and that they were not reported. Even of many H count rates even in Table 3 are not significant, being less than 2 above the background, M and H count rates, if different from 0, are reported in Table 3 to allow comparisons with SSS and among different QSS. Note that in Table 1 the S count rate is given in the 0.2-1.0 keV range rather up to 1.1. keV, because adding the 1.0-1.1 eV bin, due to the spectral response, adds only noise and does not increase the signal for any of the sources. Additional spectral models, not included in the Tables, were tested to fit the data and are discussed in the paper. The possible counterparts at optical and other wavelengths were searched using the Digital Sky Survey, the SIMBAD and Vizier data bases, including catalogs linked by Vizier, the Local Group Survey (Massey et al. 2001) and the GALEX archival images of M31. SSS that are selected using of HR1 and HR2 values, but almost certainly belong to the foreground have been excluded from Table 2 and 3. This group includes only 5-6 objects whose position is within a 3-4” radius around the coordinates of a star with V13.5. Only one object in Table 2 may be a foreground star, the source r3-122, at B=18.7 and R=18.4. It appears to be too blue to be an AGB star in M31, but probably too luminous to be a different type of star in M31. Because of the soft X-ray spectrum, if it is in the foreground it may be a AM Her star.
In Tables 2 and 3, even if the absolute luminosity is derived with the best fit and error bars are as large as 50%, it is immediately clear that only luminous sources are detected. At an estimated distance of 770 kpc (Sparke & Gallagher 2001), and even with the longest useful exposure of 64 kseconds, the lowest detectable flux is of order few 10-15 erg s-1 cm-2, which implies a luminosity of a few 1034 erg s-1. Since in the low energy range photoelectric absorption plays an important role, the minimum unabsorbed luminosity that is actually detected is almost two orders of magnitude larger. The immediate consequence of this selection effect due to the distance, is that we observe many transient sources at maximum, but cannot follow them into quiescence. Most low mass X-ray binaries and all classical novae (see Orio et al. 2001 for a discussion on novae) have quiescent luminosities that do not exceed a few 1033 erg s-1 and they are not detectable even with XMM-Newton at the distance of M31.
Photoelectric absorption is another very important selection effect. No SSS were observed in the South-2/3 and North-2/3 exposures, and no QSS were observed in the exposures North-2, only one QSS in South-2: these exposures, especially the North-2 and South-2 ones, cover in large part the region of the “ring of fire”, where N(H) is high (see map by Supper et al. 1997). The lack of SSS detected with high N(H) is very significant because it indicates approximate upper limits on the temperature of SSS, which seems to be only rarely 50 eV. Fig.1 shows the simulated spectrum of a blackbody with a temperature 70 eV, bolometric luminosity L(bol)= erg s-1, detected in a 60 kseconds exposure with N(H)=7 cm-2. This source, having the typical effective temperature of a Galactic nova-SSS in the post-outburst year (e.g. Rauch et al. 2006), would be qualified as a SSS with the criteria adopted in this paper, but it would not be classified as SSS using the restrictive criteria of Pietsch et al. (2005a). The difference between this spectrum and other harder ones peaked at about the same value (see SNR in Fig. 2) is the abrupt cut at E1 keV, which would give a clue that this is actually a much softer and luminous source than it appears. The count rate would be approximately 0.01 counts s-1, however with the same column density, a blackbody at 50 eV would yield only a count rate 0.0007 counts s-1, and at 40 eV, only 0.0002 counts s-1, so the source would be undetected against the the background.
Given the variable absorption in M31 and the “softness” of the SSS and QSS, it is difficult to draw conclusions on the spatial distribution of these two populations in M31. However, in an exposure of a region in the halo (or rather, extended thick disk) no SSS were observed, out of a total 26 X-ray sources detected in that exposure. Therefore, a preliminary conclusion is that SSS are much more frequent in the central disk.
4 Very different types of SSS
Altogether, 20 SSS were selected using the hardness criteria described above: 15 are included in Table 2, while 5 are in the positions of known supernova remnants (SNR) and are listed in Table 4. SNR constitute a quarter of all SSS found using the hardness ratio criterion, a fact that may be very relevant for other external galaxies in which SNR are yet to be identified.
Note that in the Tables the coordinates of these sources are mostly determined using the XMM-Newton images, but if they differ from the Chandra positions by 2-3”, I have listed the more precise position determined with Chandra. The tables also show a proposed identification, the count rates measured with EPIC-pn and or EPIC-MOS-2, and the parameters of two spectral fits, obtained with either a blackbody or a power-law, or adding both models, and finally the unabsorbed luminosity at a distance of 770 kpc derived from the best fit. If the sources were observed in the gap between the CCD’s (the bulge exposures were not overlapping, so each source was observed more than once) or were in a region with many bad pixels excluded by the screening criteria, I give only the count rate of the detector that observed the source. The sources that are close to the bulge cannot be well spatially resolved with EPIC-pn; this is the case of the bright source no. 7 in Table 2 (r2-12), but most of these sources are resolved with EPIC-MOS, with the exception of a central region of about 2 arcmin2, where the sources cannot be spatially resolved with any of the EPIC instruments. The supernova remnant S And falls into this category, and so does the QSS r1-9 (source no. 8 in Table 3). In Table 2, I included count rates for the Chandra SSS that were observed again. Only Chandra source r2-66 was not detected again; however, the upper limits are not significant. The Chandra SSS r2-54 and r3-115 are listed in Table 3 as QSS. The peculiar case of r3-115 is discussed further below.
Only two models are included in Table 2, but for every source, if enough counts were detected, I also fit other models. For each source I always used also the Raymond-Smith model, suitable for foreground cataclysmic variables (CV), but no spectra seem to be fit adequately with this model. WD atmospheric models and composite models, done by two different groups and with a variety of abundances and log(g), were also used to fit the spectra, described in Hartmann & Heise (1997), Orio et al. (2003), and Rauch (2005). The best fit indicated in Table 2 is quite unique and is obtained with reduced 1.2 except in the very few cases that are discussed in the text. When a fit was possible with both pn and MOS spectra, I have attempted to fit all spectra simultaneously. In one observation of source no.14 (r3-8), there is a systematic discrepancy in the fit of MOS and pn data, discussed in Section 6.2. I note that the pn spectra are usually fit with higher value of N(H) and higher effective temperature than the MOS spectrum.
Grating observations of sources in the Galaxy and in the LMC have shown that there are basically two types of CBSS: those in which the extremely hot and luminous WD atmosphere is observed (e.g. V4743 Sgr, Ness et al. 2003) and those in which a very soft emission line spectrum due to a wind is detected (e.g. Cal 83, Greiner et al. 2004 and Orio et al. 2004), but it is difficult to distinguish the two type of spectra with broad band CCD-type spectroscopy. The jury is still out as to whether the second type of binary SSS includes only WD or also other compact objects, but it is unlikely that the puzzle will be solved observing such distant sources as the ones in M31. The two classes, however seem to differ in luminosity, not higher than a few 1036 erg s-1 erg s-1 for wind sources (see also Bearda et al. 2003, Motch et al. 2003, Ness et al. 2005), but mostly around 1038 erg s-1 erg s-1 for the WD atmosphere (e.g. Balman et al. 1998, Rauch et al. 2006, Lanz et al. 2005).
5 Supernova remnants
A difficult and important questions concerns sources that are not close binaries, and mostly not even stellar, but cannot be distinguished from binary SSS from the hardness ratio alone. The SNR or SNR candidates listed in Table 4 are have an extremely soft spectrum. The Table includes only those sources for which there is a (usually published) optical, UV or radio identification in the spatial error box (see reference column). Three of the sources have also been suggested to be SNR by Di Stefano et al. (2004) and others by Pietsch et al. (2005). Five of the sources in the Table have hardness ratios that are typical of SSS according to the definition adopted in this work; the others are QSS according to the definition adopted here. Table 4 includes also two SSS for which the XMM-Newton count rates are highly uncertain and are not reported: S And, whose spectrum in the Chandra exposure is the softest of all, but it is not easily and “cleanly” extracted with the PSF of XMM-Newton in the extremely crowded region of the bulge, and s2-42, detected in the XMM-Newton observation but partially obscured by the junction between CCD’s (see Di Stefano et al. 2004 for Chandra data). It is significant that the SSS-SNR in Table 4 objects bring the total number of SSS to 20 (in addition to the ones in Table 2): 5 SNR out of 20 objects is a large number, corresponding to 25%. This definitely demands further investigation not only of unidentified M31 sources, but of other extragalactic SSS.
Three SNR observed with ROSAT are included in Table 4, but they were not selected as SSS in any ROSAT list, because the ROSAT-PSPC bandpass was different and different hardness ratios were considered. Using the S energy band from 0.1 to 1.1 keV (or up to 1 keV for our XMM-Newton observations) to define the selection algorithm is a reasonable approach using the Chandra ACIS-S detector, but it makes it more difficult distinguish stellar, binary SSS from the softest SNR. Being able to use a lower energy limit for their “soft” band Supper et al. (1997, 2001) were able to exclude most SNR (but not all) from their sample. Examples of the soft SNR spectra are shown in Fig. 2. Comparison with the other spectra shown in other figures in this paper illustrates well that the “soft SNR” spectrum is usually not as soft as the spectra of the other sources shown in the other Figures in this paper (with some exceptions, like the very young remnant S And). In external galaxies, for which we need the spatial resolution of Chandra, yet cannot collect enough photons using a narrower range than the S range, the SSS or QSS samples probably include several unidentified SNR (SNR data bases are not complete).
At least two components are often necessary to fit the spectrum of the soft SNR. Since the ratio of soft to hard photons measured with the EPIC detectors is much higher than that measured with Chandra ACIS-S (and even much more than the one measured with Chandra ACIS-I, with which a few SNR were observed), the softer component appears much more dominant in the EPIC observations. For this reason, with low statistics the Chandra and XMM-Newton best-fits are often different. Only for source r3-63 the statistics are sufficiently good for a somewhat meaningful spectral fit. The best fit to the XMM-Newton spectrum is a Raymond Smith + power-law model (yielding reduced 1, see Fig 2, upper panel). I also attempted fitting other models to this source: blackbody, power-law, blackbody + power-law, Raymond Smith and non equilibrium ionization (NEI, the last two models were found to be appropriate for the Chandra spectrum by Kong et al., 2002), but a composite model best fits EPIC-pn spectrum. The blackbody model alone (see parameters in Table 4) for r3-63 is clearly not suitable, yielding a best fit with reduced =1.5.
However, very soft and faint SNR are generally fit well with one component, either a blackbody or a Raymond-Smith with the same luminosity. For instance, the Chandra ACIS-S spectrum of r3-67 was fit by Williams et al. (2004) with a blackbody + power-law, with N(H)=5 1021 cm-2 and Tbb=50 eV. The softest component is so dominant in the XMM-Newton EPIC-pn observation, that a blackbody alone (even if at higher temperature) is sufficient to fit the spectrum. The parameters obtained are N(H)=4.2 1021 cm-2 and Tbb=130 eV (indicating intrinsic absorption, see right lower panel of Fig. 2). I also note that the luminosity obtained with my best fit is almost 8 times lower, although the value of Williams et al. (2004) is still within the 3 uncertainty of the spectral fit, because of the low statistics. The spectra of r3-84 (proposed to be the SNR Braun 95 by Kong et al., 2003) and of source no. 3, shown in the left lower panel of Fig. 2, are two other examples of SNR detected with low S/N. Even if their spectra seem to be more structured than a simple blackbody, I cannot determine a more appropriate model. The lower the count rate is, the broader are of course the 2 contours in the parameter space. For source no. 11, detected with only 3.110.46 cts s-1 in the pn image, the value of N(H) varies between 1.4 and 8.5 cm-2, and the blackbody temperature between 73 and 186 eV, while the constant that determines the bolometric luminosity is unconstrained.
Source no. 7 is included in the SNR table because it is a non variable source, spatially coincident with both a ROSAT one and a radio source. Even if the count rate appears to vary within the 3 level, this is surely due to the very off-axis position of the source the core exposures. A Chandra position is missing (this source was not observed), but the SNR identification has been proposed also by Supper (1997) and Pietsch et al. (2005). Two reported detections of different planetary nebulae in the catalogs near this position, have been rejected and are now thought to be mis-classifications of the extended SNR (Roth et al. 2004).
Table 4 illustrates well that many SNR detected in external galaxies with low gas content often have, even if only in first and crude approximation, blackbody-like spectra and using broad-band hardness ratios may be easily classified as SSS or QSS. However, with Chandra at least two SNR in M31 are spatially resolved, and this is of course the best way to distinguish them from stellar point sources (Kong et al. 2002, 2003). Outside the local group, one cannot even rely on spatial resolution. For SSS samples in external galaxies, the starting point to distinguish SNR would be to obtain both Chandra observations (to determine the coordinates and offer a possibility of identification at other wavelengths) and XMM-Newton observations of the same field (if source confusion is not a problem in the X-ray images) in order to use a narrower range than “S” and better assess how soft the source really is.
6 Are there background sources in the sample?
Other spurious sources may be background AGN, especially if they are at low redshift, or/if they are narrow line Seyfert II galaxies, which often have a very soft X-ray spectrum (see Sulentic et al. 2000). One of the ROSAT SSS was identified optically; preliminary results on the optical spectrum indeed shows the typical signatures of an AGN at redshift z=0.187 (Greiner 2005, private communication). By fitting the spectrum with a few different models and letting N(H) vary, in principle it is possible to select possible candidate AGN among SSS and QSS, mainly because of high column density N(H) and apparent low luminosity at M31 distance (unless the source is in a dark cloud of M31), and possibly because of variable N(H) as well. However, since both close binary SSS and AGN are often variable, time variability exclude SNR but not AGN. I have not found any source in Tables 2 and 3 that seems to show indications of being an AGN, although this result is only preliminary, pending radio or optical identifications.
7 Time variability of supersoft X-ray sources
In Table 2, 7 out of 15 entries correspond to sources previously observed and classified as SSS with Chandra (the positions are known with 1” precision). For these sources, for the ones detected with ROSAT and for the new ones repeatedly observed in the center, one can try to investigate the variability on time scales of months and years. Among the Chandra sources, which are the most interesting because of their precisely determined position, only one was not detected also with XMM-Newton, source r2-66, but the upper limits on the flux are higher than the Chandra detection. Source r3-8 (see Section 6.2) is one of two non-SNR sources detected with XMM-Newton, that were listed as ROSAT SSS in the additional compilation by Kahabka (1999) and were not examined by Greiner et al. (2004). For most sources observed with both Chandra ACIS-S and XMM-Newton, a simple conversion of the count rates with PIMMS is not sufficient to assess variability due to the low count rates, large error bars and because of problems with the the ACIS-S calibration in the lowest energy range. However, the four most luminous sources are clearly variable. Their behaviour is discussed in Sections 6.1 and 6.2. Among the entries in Table 2, 6 sources were not previously detected before in X-rays, 2 are very bright but transient, and 5 are novae.
Greiner et al. (2004) found a high rate of failed repeated detections of SSS in the Chandra and XMM-Newton images of M31, and inferred variability on time scales of months. These authors examined several SSS in the original classification by Supper et al. (1997) and they did not not include objects from the the additional list of Kahabka (1999). However, in the XMM-Newton exposures of the M31 central bulge only 33% of all the sources previously observed with ROSAT, Chandra and/or XMM-Newton (including also all those listed by Kahabka et al. 1999) were not detected again. 8 out of 12 previously known SSS are in fact still bright in the longest bulge exposure done with the thin filter “Core-4”. (Note that one of the 8 sources, however, is detected only in this exposure as a relatively “hard” source, and I discuss below even the possibility that this may be another, casually spatially super-imposed source). To put things in perspective, we must also remember that the flux detection limits in the second ROSAT survey were about 10 times lower than in the first survey. This facts explains several of the failed repeated detections with ROSAT itself (see discussion by Greiner et al. 2004). Most important, the ROSAT SSS examined by Greiner (2004), were not close to the center of M31 (where source confusion was preventing ROSAT detections).
Consistently with Greiner et al.’s (2004) result, the rate of failed repeated detections with XMM-Newton increases to 70% away from the central region: only 4 out of a total 13 previously known ROSAT SSS in the “North” and “South” fields re-observed away from the central region with XMM-Newton were detected, even if the exposures were quite long. Is this due to intrinsic variability of the sources? Probably not in most cases, since the higher rate of missed repeated detections in the regions that are far from the bulge is explained by at Supper’s (1997) schematic N(H) map based on Unwin’s (1981) maps. These peripheral regions have much higher gas content than the one within one arcminute from the central nucleus. Even a very small variation in effective temperature and luminosity may prevent detection with such a high column density. It also appears from Table 2 that all the count rates of the faint Chandra sources fluctuate by up to 30% , however the variations remain within the 3 level except for source r2-56 and, unusually, three novae, which seem to be genuinely variable (not including the nova of 2000, which was not in outburst in the first two exposures of the bulge). Whether the the fluctuations in count rate are real, due to small amplitude variability with a time scale of months, or an effect of statistics, they are sufficient to make the faintest SSS undetectable, if they were re-observed at a larger off-axis angle or for less time. A large fraction of SSS are intrinsically faint and only marginally detected at M31 distance, so they often fall below the detection threshold when they are observed again. In fact, almost all the sources that were not detected again have low count rates, except the genuine “transients” discussed in the next Section.
7.1 Two transients: variable on short and on long time scales
There were two SSS in outburst during the 2 years of XMM-Newton observations, one was reported at the time of the observations by Osborne et al. (2001) and the other by Shirey (2001). Both transients were observed only once; upper limits on the count rates are 50 and 10 times, respectively, lower for other observations. In both case the best fit luminosity is L erg s-1, at the Eddington limit.
The first transient, source no. 11 in Table 1, was described by Osborne et al. (2001). It was very luminous in June of 2000, yet it had fallen below the threshold detection of EPIC pn 6 months later, in December of 2000 (only the possibility of a 2 detection is suggested by Osborne et al., 2001). After a year the upper limit to the count rate is lower than the 2000 measurement by about two orders of magnitude. This source is only 10” away from another one and cannot be studied in the EPIC-pn image, while in the EPIC-MOS images, the sources are separated fairly well. A modulation with a period 865.5 s (14.4 minutes) is clearly detected in the data. King et al. (2002) discussed the possible models to explain this modulation, including a short orbital period double degenerate system. These authors came to the conclusion that this is the spin period of a magnetized WD in an intermediate polar system, and that hydrogen is burning steadily in a shell on the WD. Because of the periodicities that were later found for V1494 Aql (Drake et al. 2002) and V4743 Sgr (Ness et al. 2003, Leibowitz et al. 2005), I note that the period of this M31 source falls in the range commonly observed for post-nova SSS (Drake et al. 2002, Ness et al. 2003), or for the PG1059 WD that emit supersoft X-rays (e.g. Vaucler et al. 1993), attributed to non-radial g-mode pulsations of the WD.
The other transient, source no. 12 is one of the softest (see Fig.3). It was observed in June of 2001 and it was already below the detection limit of a 38 ksec observation done on October 5 2001 with Chandra ACIS-s, and it was not detected in January of 2004 with XMM-Newton. This source seems variable during the observation (90% probability of variability), but I could not detect any periodicity (this is discussed more extensively in a forthcoming paper on the time variability of SSS, Orio et al. 2005).
The spectra shown in Fig. 3 are not very well fit with a black-body model. The best fit is obtained with =1.40 and =1.36 for source no. 11 and 12 respectively (see Fig.2). With WD atmospheric models, however, the value does not improve for source no. 12, while =1.10 is obtained for source no. 11, although with a very low value N(H)=2.4 cm-2, which would imply that it is a nearby Galactic source (but a possible Galactic counterpart should be detectable if this was true).
If these two transients belong to the class of binary SSS, three possibilities may explain their time variability: optical novae in M31, a limit cycle like RX J0513.9-6951 (Reinsch et al. 2000), or thermonuclear flashes without mass ejection. Although both sources were observed in June, when M31 is not observable from ground based telescopes, it takes usually 6-8 months after the optical maximum for classical novae to reach the X-ray supersoft stage (e.g. Orio et al. 2001b, Ness et al. 2004). This would mean that the optical outburst occurred when M31 was observable optically, but it seems unlikely that the novae where not observed in optical surveys, especially Macho surveys, being carried on at that time (e.g. Riffeser et al. 2003). These transients may be like RX J0513.9-6951, undergoing the limit cycle studied by Hachisu & Kato (2003). However, the second transient became bright at UV wavelengths in OM images (Shirey 2001) when it brightened also in X-rays, suggesting a different behaviour than RX J0513.9-6951. Measurements at optical wavelengths would be the key to understand this cycle and are missing. A variation in X-ray flux by an order of magnitude or more may be due to a thermonuclear flash, at m⊙ yr-1 (see Fujimoto 1982, Starrfield et al. 2004). Even without mass ejection, a thermonuclear flash causes expansion of the WD envelope and an optically bright phase follows the X-ray brightening. This variation is expected to be several magnitudes, much more than the small amplitude of RX J0513.9-6951, although not quite as large as for a classical nova. Only X-ray and optical monitoring done for several years would prove that we have the right time scales to infer the flash, but it seems that the X-ray bright phase, i.e. the time to reach flash conditions, for most reasonable system parameters is longer than three months (e.g. Fujimoto 1982, Kahabka 1998). In any case, monitoring the region near the center of M31 semi-simultaneously in optical and in X-rays is the key to solving the puzzle, and it will be very important to assess whether these two sources are really accreting and burning hydrogen at the high rate required by SNe Ia models.
7.2 Two bright, variable sources: ejecting mass in a wind?
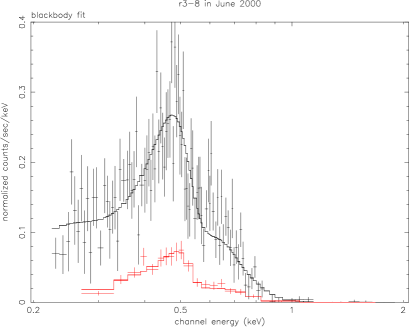
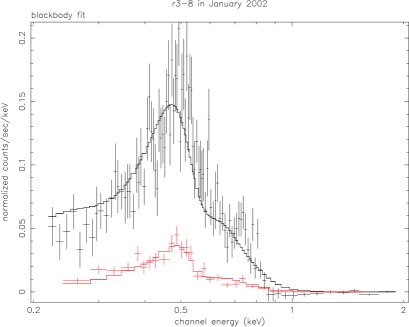
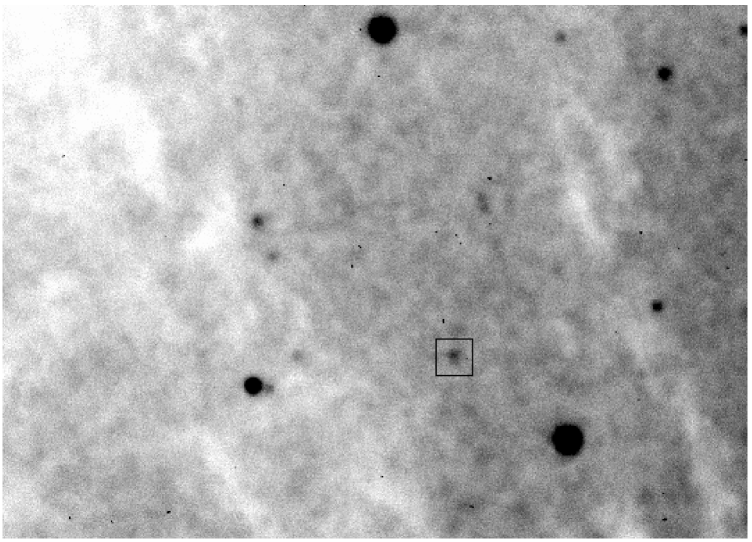
Two bright and variable SSS in Table 2 deserve special attention. The first one is source r3-8, whose broad band spectra are shown in Fig. 4. This source is likely to be similar to the two transients described above, because even if it was observed every single time, the count rate varies by more than an order of magnitude. A bright UV source appears to be at 304 arcsec from the the Chandra position in the archival public GALEX images of M31, both in near and far ultraviolet (the position uncertainty is 6”). Imaging the field with the 3.5m WIYN telescope I found that the closest star to the Chandra position is a very blue star at B22.7 and R23. An initial astrometric solution shows that it is at only 5” angular distance from the Chandra position (see Fig. 5), and there is no star with B23.5 closer to the Chandra position. Improved astrometry and photometry will be included with new data in a forthcoming paper (Orio et al. 2005, in preparation). The ratio of the distances to M31 and to the LMC translates in a magnitude difference of about 6 magnitudes. This implies that at M31 distance, only two of the seven SSS in the LMC, Cal 83 and RX J0513.9-6952 would be observed to have B23.5, so definitive conclusions are not possible yet.
This X-ray source appeared to be bright in June of 2000, then the luminosity decreased in the following year and it increased again in January of 2002 (see Fig. 4). There is also evidence of periodic variability on short time scales. In the June 2000 observation, the power spectrum has a peak at the frequency corresponding to a 2761 s period, and an even higher peak at the frequency corresponding to its alias, 5523 s (this is discussed more extensively in Orio et al. 2005, in preparation). If the latter is an orbital period, it is surprisingly short, 1.53 hours. Of course there are other possibilities: spin of the WD, or non-radial pulsations of the WD.
The broad band spectra, shown in Fig. 4 with the best blackbody fit, (the 2 range of the parameters indicated in Table 5), do not constrain the bolometric luminosity. However, the fits indicate that it is very unlikely that the higher flux and harder spectrum of the “high” states in June 2000 and January 2002 are produced by a source at higher temperature. The spectrum of the June 2001 observation is best fit with a much lower value of N(H) than the other spectra. While the source luminosity reached a few 1038 ergs s-1 in the “high” states at the beginning and at the end of the observations, N(H) was high (2.3 1021 cm-2 as opposed to only 7 1020 cm-2) obtained from the best fit of the third observation), causing the spectrum to appear harder. Note that for the last observations the pn spectrum fit differs from the MOS one, and indicates even higher N(H) and super-Eddington luminosity, ergs-1. The MOS best fit is the one reported in Table 2.
Fits with composite models and with several WD atmospheric models were also attempted, with different abundances (see references above), but they do not yield an improvement over the blackbody fit and do not indicate a significantly different value of N(H). The 2 contours of the bolometric constant are not “closed” towards lower values, so the bolometric luminosity is not well defined. However, if we examine the best fit we may conclude that, as the source luminosity decreased, the effective temperature at first increased or remained constant, and only in the third observation there is marginal evidence that it may have have been lower. N(H), on the other hand, must have decreased as the XMM-Newton count rate decreased. A Chandra HRC-I observation shows that the luminosity was already higher again by October of 2001 (the source was in the gap between CCD’s in the ACIS-s observation of the same period).
In all the XMM-Newton observations, and particularly the ones in the faint state, even if a blackbody is a good fit there seems to be some structure that is suggestive of spectral lines (see Fig. 4). A likely explanation for this spectral behaviour, if we are dealing with a WD burning hydrogen in a shell, is that thermonuclear burning always occurs at an almost constant rate, because it is regulated by a wind, as in RX J0513.9-6952 . When the burning rate increases because more material is being accreted, probably as a consequence of irradiation of the secondary, the luminosity exceeds the Eddington value. Then a wind ensues (causing the higher N(H)), and strips the source of extra material to burn, until the WD shrinks, then cools, and the energy generation rate goes back to a level at which all the accreted material is immediately burned. We observe at this point the lower luminosity and lower absorption spectra of December 2000 and June 2001, shown of the right side of Fig. 4. In this scenario, there is a limit cycle like for RX J0513.9-6952, but with a very important phenomenological difference: the wind is never completely optically thick to X-rays, so the source at first becomes even X-ray brighter, instead of disappearing from the X-ray window. As in RX J0513.9-6952, it is unlikely that the wind strips the WD of a significant portion of accreted material like in classical novae, so this source may be considered to be a potential SN Ia candidate. As mentioned in Section 6.1 for the two transients that went below the detection threshold limit, quasi-simultaneous optical and X-ray monitoring of M31 is needed for a few years to obtain the necessary information to fully understand how the cycle works.
Source r2-12, for which a light curve in the range 0.5-7 keV was sketched by Di Stefano et al. (2004) under the assumption of constant blackbody temperature, varies much less (only a 50% amplitude in count rate once). Even if it is very soft, it cannot be fit with a single blackbody or with a WD atmosphere. As found by Di Stefano et al. (2004), an additional power-law component is necessary to fit the spectra of three observations. The 2 ranges of the parameters are given in Table 6. For the data of December 2000 and of January 2002 I obtain a reduced for the best fit, suggesting that even more components may be needed. Only for the observation of June 2001, a value of /d.o.f.=1.1 is obtained by combining to a blackbody with a temperature of 62 eV an additional multi-temperature disk (“diskbb” in XSPEC), instead of the power-law component. All the spectra seem to be structured and possibly have several components. The best fit value of N(H) again is higher, and the luminosity as well, in the second year of observations. For the luminosity, there is no overlap of the 2 contours in the observations of these two years (see Table 6). In the last two observations the luminosity is likely to have been super-Eddington at M31 distance, a few 1039 erg s-1.
The minimum bolometric luminosity obtained at the 3 confidence level keeping fixed values of N(H) and Tbb is 9.5 erg s-1. Because of the large luminosity and the complex spectrum, if this source is confirmed to belong to M31, it resembles the Ultraluminous X-ray Sources (ULX) detected outside the Local Group, in M101, that appear to be SSS in the most luminous state (Kong and Di Stefano 2005). Perhaps it constitutes the “missing link” with the ULX class in the Local Group.
7.3 Classical and recurrent novae, and black-hole candidates
One important clue to the nature of SSS is the frequence of classical and recurrent novae among them. It is clear that many novae turn into very luminous SSS for some time after the outburst, as the ejecta gradually become optically thin and as long as the WD is still burning hydrogen in a shell. For V4743 Sgr, the abundances appear to be typical of CNO processed material, implying that the post-nova WD at least in some cases still burns the previously accreted, and not completely ejected, envelope material (as opposed to nuclear burning ignited in the external layers of the WD itself). If this hydrogen burning in a shell continues for a long time (i.e. at least 10 years) the leftover envelope mass is not negligible, and there is a possibility that the WD grows towards the Chandrasekhar mass, since all novae are recurrent on long time scales. However, no nova has been observed to remain a SSS for more than 10 years (see Shanley et al. 1995, Orio et al. 2003), and novae that burn hydrogen in a shell for several years are rare (see Orio et al. 2000). In addition to this, the objects that could mostly contribute to the SNe Ia rate are novae with short recurrence times, less than a century, i.e. Recurrent Novae, but they have never been observed to undergo thermonuclear burning for longer than a month after the outburst (see Orio et al. 2005).
A nova in M31 was found to be a ROSAT SSS in a peripheral region of M31 (Nedialkov et al. 2001). I have therefore overplotted on the XMM-Newton images of M31 the position of more than 200 novae, identified with H surveys of M31 in the last 25 years before the observations. About half of these novae were included in the XMM-Newton pointings. The list includes the IAU Circulars of the last 12 years, Astronomer’s Telegrams of the last 2 years, and novae with coordinates reported in the following papers: Darnley et al. (2004), Joshi et al. (2004), Shaefter & Irby (2001), Sharov et al. (2003 and 1992), Sharov (1992) and a series of papers by Sharov & Alknis (1998, 1997, 1996, 1995, 1994) Ciardullo et al. (1987), and only a few the latest of the novae in Rosino et al. (1989). Most positions are known within only 1” uncertainty. I have found that the position of 5 SSS is coincident within about 3” with the coordinates of the list of optically identified novae, two of which are Chandra SSS, with coordinates determined with 1” uncertainty in the position, that overlap within less than 2” uncertainty with the novae position. The explosions of these X-ray identified novae have been recorded in 1992, 1995 (2 objects), 1996, and 2000. Not surprisingly, these were all novae whose outbursts were recorded since 1992, that is in the 10 years before the X-ray observations. Three spectra, and the comparison with a bight Galactic nova, are shown in Fig. 6. The spectrum of the Galactic nova, V4743 Sgr, was also detected with the RGS gratings. It turns out to be atmospheric in origin and it has many deep absorption features, which however are totally unresolved with EPIC-pn (Ness 2004, Orio et al. 2005, preprint). The spectra have high S/N, but are generally well fit with both a blackbody at high luminosity (L ergs s -1 or atmospheric models and have temperatures in the range 30-50 eV . The spectrum of V4743 Sgr appears to be different because of a different N(H), probably a few times 1021 cm-2, which decreases the flux detected below 0.4 keV, however like the M31 novae spectra, it is truncated after 0.5-0.6 keV. It is interesting to note that Novae 1992-01, 1995-05 and 1996-05 (from the list of Shaefter & Irby, 2000) appear to have fluctuations in count rate that exceed the 3 level. This makes it necessary to have multiple observations before a nova is deemed to have “turned off’ as supersoft X-ray source, since the X-ray lightcurve may have several fluctuations before turn off of the SSS.
The same novae have been recently reported to be X-ray bright in a preprint by Pietsch et al. (2005), although Pietsch et al. also find XMM-Newton detections of three more objects which they identify with recent novae. I find that one of them (AGPV 1576) is detected at a 3 level in a Chandra-HRC observation (without spectral resolution), but I cannot confirm the detection above this level with XMM-Newton-pn. In the position of nova 1997-09 of Shaefter & Irby (2001) and Nova V1067 I cannot confirm a detection above the 2 level. These additional detections of Pietsch et al. (2005) were made using a sophisticated method in order to detect the faintest sources making use of the combined information of pn and MOS, and even a 2 level detections are reported in the paper (Pietsch 2005, private communication). My approach is more conservative, I consider only detections above the 3 level in the pn images. In any case, the number of nova-SSS is a large percentage (25%) of the total number of SSS, yet a small fraction, about 5%, of all the novae in outburst in the last 25 years, which becomes only close to 10% adding the 3 additional candidates of Pietsch et al. (2005).
I considered the intriguing possibility of identifying X-ray novae containing a black-hole, that have recurrent outbursts on few years time scales accompanied by optical outbursts of large amplitude, often with m=8 mag, without significant mass ejection. Could these outbursts be selected in the H surveys that identify classical and recurrent novae? Even if the H line in outburst is much less prominent over the continuum than that in classical novae, the total luminosity of these objects in outburst is comparable to classical novae and especially to recurrent novae, so unless subtraction is made with an image in an off band (usually, Johnson R), taken at the same time as the narrow filter exposure, both novae and X-ray novae appear virtually similar in an H image.
Since X-ray novae are recurrent, there is a small chance that an object hitherto observed only optically may be in outburst again during the XMM-Newton observations. Quiescent X-ray luminosities for these systems are in the range 1030-1033 erg s-1, well below our detection limits, and typically X-ray novae return to quiescence within a year. The source r3-115, already listed in Table 2, shows a very unusual and surprising behaviour. Riffeser et al. (2001) and Pietsch et al. (2005b) consider it to be a possible symbiotic nova. It appeared as a typical, very soft SSS in observations done with ACIS-S in 2001, (see also Di Stefano et al. 2004) 98 days after the C-3 XMM-Newton observation. However, it was never detected before, and even the detection of a SSS in the C-3 observation (Pietsch et al. 2005) cannot be confirmed above the 3 level in the pn image (note that one of the two SSS transients of Section 6.1 is displaced by 10”, making the detection of a nearby, soft and very faint source almost impossible). However, the spectrum in the C-4 exposure, taken 107 days after the SSS detection with ACIS-S, is shown in Fig. 6a: it has a lower blackbody luminosity, but shows now an important hard component, fit as a power law. There is a chance of casual overlap with a hard X-ray transient that cannot be spatially resolved, but since the source is away from the bulge, this is unlikely. A source whose spectrum is becoming harder and less luminous in time suggests the behaviour of an X-ray nova, with an outburst recurring every few years, casually observed after an outburst with XMM-Newton. A similar transition from supersoft to harder X-ray spectrum was also observed in two peculiar sources, the Ultra Luminous one in M101 (followed by Mukai et al. 2003 and Kong & Di Stefano 2003) and the SSS of M300 (Kong & Di Stefano 2005). Di Stefano et al. (2004) identify r3-115 with a very red star at V22 in Hubble archival images, and propose the identification with a symbiotic. In any case, the optical counterpart is likely to host a giant, which would be unusual, albeit not impossible for a black hole X-ray nova system.
The most interesting case is the one of recurrent nova Rosino 140 (see Ciardullo et al. 1987), which is found in the position of the hard X-ray source r3-13 (=00,43,13.4 and =+41,18,13), observed with Chandra and XMM- Newton. This source is not mentioned in Pietsch et al. (2005) but it is a faint and probably it is variable star. In exposure core-3 the source appears brighter than in the other bulge observations, but a comparison is made difficult by the presence of another faint source 6-7” away. In the MOS, it is easy to avoid the nearby source and extract a clean spectrum, with a count rate 0.00140.00031 cts s-1, that appears relatively hard (see Fig. 6.b) The statistics are very poor for a detailed spectral fit, but it is clear that r3-13 has both a soft portion and also a much harder and luminous tail than a classical nova. Since it is classified as a recurrent nova, and there is some evidence of X-ray variability, the possibility of a black hole transient should certainly be considered.
8 Quasi-Soft Sources: a real new class?
In order to analyse the nature of the QSS, it must be remembered that no single X-ray observations ever went so deep imaging any an area of the sky effected by low N(H), allowing for the first time the discovery of new, soft and faint sources. Whether these sources belong to a uniform class is an intriguing problem.
Table 3 contains 18 sources, most of which were previously selected by Di Stefano et al (2004). A few more with HR30.98 in at least one observation, detected at least or above the 3 level, are included. Three of the Chandra QSS were not detected again, but the XMM-Newton upper limits are not significant to assess variability . For the Chandra source no. 8, r1-9, which is in the inner nucleus of M31, using the XMM detectors I can only assess the detection and give an upper limit to the count rate, because source confusion cannot be avoided. 5 more QSS are in table 4 because of their association with a SNR: they represent 5 out of 23 sources.
A close look at table 3 reveals that relatively high count rates were measured only for two sources, r1-9 and r3-111. With the exception of source no. 18, which as mentioned above may be Galactic, all the other non-SNR QSS have no detectable counterpart at other wavelengths. For the sources detected with better statistics, a power-law with slope 2-2.5 fits the XMM-Newton EPIC-pn spectra better than a black-body model. The special case r3-115 has been discussed in Section 6.3. I note that source no.4, no. 5 (r3-111), no. 9 (r2-62), no. 10 (r2-54) show some evidence of variability in count rate, although it exceeds the 3 level only for for r2-54. For 8 sources a blackbody at TBB=110-190 eV appears as a better spectral fit than a power-law, but they are all faint, with maximum count rate (8.93 cts s-1 measured with EPIC-pn. It cannot be ruled out that the blackbody fit appears to be the best because of the low statistics, like for the SNR in Table 4 (see discussion above). Comparing count rates and spectral fits in Tables 3 and 4, it seems that the faint, non variable QSS may be SNR. I do not think that this is probably true for QSS in external galaxies, which seem to be intrinsically more luminous (Di Stefano & Kong 2004) but it is a possibility that cannot be ruled out for M31. The database on SNR in M31 is probably not complete yet, and this possibility would have important implications for the supernova rate in M31. However, I note that a point against the SNR hypothesis is however the lack of GALEX counterparts among QSS (only one GALEX source among 18). Most known SNR do have a UV counterpart at M31 distance.
If deeper observations reveal that the blackbody is indeed a good fit, the alternative possibility of Galactic neutron stars must also be considered. The lack of optical counterpart, the blackbody temperature and the would-be luminosity at a distance 8 kpc, erg s-2, all fit this possibility. Finding several neutron stars at this high Galactic latitude would imply a great re-heating efficiency, which is somewhat surprising, but not impossible. Many cooling neutron stars are probably unidentified among the faint X-ray sources without optical counterparts, but comparisons with the known Galactic sample of such sources are not statistically significant yet. Since the study of “blank field sources” relies up to now mostly on ROSAT HRI data because a large field of view and a relatively precise position are needed, there is still very little spectral information on the faint neutron star candidates (see Chieregato 2005, Chieregato et al. 2006).
On the other hand, if part of the QSS are neutron stars in M31, they have large luminosities (a few times 1036 erg s-1), which would be consistent with anomalous X-ray pulsars (AXP) rather than regular neutron stars (AXP however are usually less soft).
9 Conclusions
I have performed a systematic search of SSS and QSS in the XMM-Newton observations of M31. When possible, I have studied the spectra and the time variability characteristics of these sources and searched counterparts at other wavelengths. These are a few conclusions that can be drawn from this study:
1) This “close look” M31 SSS population clearly confirms that, as noted in other studies, using only hardness ratio criteria we cannot select a uniform type of sources undergoing the same physical mechanisms.
2) Using hardness ratios based on broad spectral bands like in Di Stefano et al. (2004), at least 11 SNR are selected as SSS. However, SNR tend to have on average harder spectra than H-burning WD in CBSS, so the number of SNR among SSS is reduced if hardness ratios with narrower band-passes are used, like for ROSAT (Supper et al. 1997) or in the XMM-Newton catalog (Pietsch et al. 2005a). The presence of SNR in the SSS data bases in external galaxies may be assessed not only with multiwavelength observations, but especially complementing Chandra observations, necessary for the good spatial resolution, with XMM-Newton observations, in order to detect more signal in the soft band.
3) Post-outburst novae make up a quarter of all SSS, but only less than 1 in 10 nova of the last 25 years is detected as SSS. Up to now, in M31 like in the Galaxy and the in the Magellanic Clouds, no nova was detected in X-rays after more than 10 years.
4) 1 out of 10 novae in outburst in M31 is associated with a SSS, indicating ongoing shell hydrogen burning. Yungelson et al. (1996) evaluated the SNe Ia rate, the nova rate and the interacting binary formation rate (e.g. Yungelson et al. 1996). Following their reasoning, we find that, if only 10% classical and recurrent novae keeps on burning hydrogen in a shell for several years, these systems are not the main class of progenitors of type Ia supernovae.
5) Large flux variations by more than one order of magnitude, consistent with the limit cycle of thermonuclear flash models or with “wind-regulated” sources, are detected in 20% of those SSS that are not SNR (3 out of 15 sources), allowing for the possibility that they are CBSS, and that a relatively large number of CBSS may be burning hydrogen in a shell at the high rate required by type Ia supernova models,
6) At least one variable SSS has a very large luminosity, of a few 1039 erg s-1 at M31 distance; the spectrum is surely not a simple blackbody and must be produced by two or more components. This source, detected with Chandra as well, may be the missing link with ULX of external galaxies. This is a very interesting finding. I dare suggest that monitoring this close-by source in Andromeda we may be able to find a substantial clue to the nature of ULX.
7) Looking at the present statistics, it seems that QSS may include a large number of SNR candidates, although it is puzzling that counterparts at FUV/NUV wavelengths are not detected. QSS may also include foreground neutron stars, or even softer-than-usual AXP in M31.
8) Cross correlating the novae with with the positions of all X-ray sources observed with XMM-Newton (not only X-ray sources), two non- supersoft X-ray sources have been found. Both are variable, one can be classified as “transient” and seems to be variable not only in flux but also in spectral characteristics. These two objects are candidate black-hole transients. It will be interesting to monitor the X-ray behaviour of X-ray sources that are spatially coincident with classical novae, not only in order to study H-burning WD, but also with the aim of selecting black-hole transients in the Local Group galaxies.
I would like to conclude reminding that M31 gives us a wonderful opportunity to obtain statistics of whole classes of X-ray sources, and that both XMM-Newton (because of the large effective area) and Chandra (because of the low background and especially of the high spatial resolution, of unique value in the very crowded central region) are exceptional instruments to study X-ray sources populations and monitor the variable sources.
References
- (1) Balman, S., Krautter, J., & Oegelman, H. 1998, ApJ, 499, 395
- (2) Bystedt, J.E.V., et al. 1984, A&AS, 56, 245
- (3) Braun, R. 1990, ApJS, 72, 761
- (4) Bearda, H. et al. 2002, A&A, 385, 511
- (5) Burwitz, V., Starrfield, S., Krautter, J., & Ness, J.-U. 2002, in Classical Nova Explosions, ed. M. Hernanz and J. Jose’, AIP, 2002, 377
- (6) Chieregato, M. 2005, PhD thesis
- (7) Chieregato, M. et al., 2006, A&A, in press (astroph/0505292)
- (8) Ciardullo, R., Ford, H.C., Neill, J.D., Jacoby, G.H., & Shafter, A.W. 1987, ApJ, 318, 520
- (9) Darnley, M.J.. et al. 2004, MNRAS, 355, 571
- (10) Di Stefano R., & Kong A.K.H. 2003, ApJ, 592, 884
- (11) Di Stefano R., & Kong A.K.H. 2004, ApJ, 609, 710
- (12) Di Stefano, R., et al. 2004, ApJ, 610, 247
- (13) Drake, J., et al 2002, ApJ, 437, 733
- (14) Fujimoto, M.Y. 1982, ApJ, 257, 757
- (15) Gehrz, R.D., Truran, J.W., Williams, R.E., & Starrfield, S.E. 1998, PASP, 110, 3
- (16) Greiner, J. 2000, NewA, 5, 37
- (17) Greiner, J., & Di Stefano, R. 2002, A&A, 578, L59
- (18) Greiner, J., & Di Stefano, R., Kong, A., Primini, F. 2004a, ApJ, 610, 261
- (19) Greiner, J., et al. 2004b, in Compact Binaries in the Galaxy and Beyond, IAU Coll. 194, E. Sion & G. Tovmassian editors, RevMexAA(SC), 20, 182
- (20) Greiner, J., Orio, M., & Schartel, N. 2003, A&A, 405, 703
- (21) Hachisu, I., & Kato, M. 2000, ApJ, 558, 323
- (22) Hartmann, H.W., Heise, J. 1997, A&A, 322, 591
- (23) Hill, J.K., et al. 1995, ApJS, 98, 595
- (24) Hodge, P.W. 1981, An atlas of the Andromeda Galaxy, University of Washington Press
- (25) Joshi, Y.C., et al. 2004, A&A, 415, 471
- (26) Kahabka, P. 1999, A&A, 344, 459
- (27) Kahabka, P., & van den Heuvel, E. 1997, ARA&A, 35, 69
- (28) Kato, T., Yamahoka, H., Liller, W., & Monard, B. 2002, A&A, 391, L7
- (29) King, A.R., Osborne, J.P., & Shenker, K. 2002, MNRAS, 329, L43
- (30) King, A.R., Rolfe, D. J., & Schenker, K. 2003, MNRAS, 341, L35
- (31) Kong, A.K.H., & Di Stefano, R. 2003, ApJ, 590, L13
- (32) Kong, A.K.H., & Di Stefano, R. 2005, ApJ, 632, L107
- (33) Kong, A.K.H., Garcia, M.R., Primini, F.A. & Murray, S.S., 2002, ApJ, 580, L125
- (34) Kong, A.K.H., Sjouverman, L.O., Williams, B.F., Garcia, M.R., & Dickel, J.R. 2003, ApJ, 590, L21
- (35) Lanz, T., Telis, G.A., Audard, M., Paerels, F., Rasmussen, A.P., & Hubeny, I. 2005, ApJ, 619, 517
- (36) Leibowitz, E., Orio, M. et al., 2005, preprint
- (37) Livio, M. & Truran, J.W. 1994, ApJ, 425, 797
- (38) Massey, P. et al. 2001, BAAS, 199, 130.05
- (39) Motch., C., Bearda, H. & Neiner, C. 2002, A&A, 393, 913
- (40) Mukai, K., & Ishida, M. 2001, ApJ, 551, 1024
- (41) Mukai, K., Pence, W.D., & Snowden, S.L. 2003, ApJ, 582, 184
- (42) Nedialkov, P., et al. 2002, A&A, 339, 439
- (43) Ness, J.-U., et al. 2003, ApJ, 549, L127
- (44) Orio, M. 2004, in Compact Binaries in the Galaxy and Beyond, IAU Coll. 194, E. Sion & G. Tovmassian editors, RevMexAA(SC), 20, 182
- (45) Orio, M., Covington, J., & Ögelman, H. 2002, A&A, 373, 542
- (46) Orio, M., & Greiner, J. 1999, A&A, 344, L13
- (47) Orio, M., Ebisawa, K., Heise, J., & Hartmann, W. 2004, in Compact Binaries in the Galaxy and Beyond, IAU Coll. 194, E. Sion & G. Tovmassian editors, RevMexAA(SC), 20, 210
- (48) Orio, M., Hartman, W., Still, M., & Greiner, J. 2003, ApJ, 594, 435
- (49) Osborne, J.P., et al., 2001, A&A, 378, 800
- (50) Pietsch, W., Freyberg, M., & Haberl, F. 2005a, A&A, 434, 483
- (51) Pietsch, W. et al. 2005b, &A, 442, 879
- (52) Prialnik, D., Livio, M., Shaviv, G., & Kovetz, A. 1982, ApJ 257, 312
- (53) Rauch, T., Werner, K., & Orio, M. 2006, astroph/0501012
- (54) Reinsch, K., van Teaseling, A., King, A.R., & Beuermann, K. 2000, A&A, 354, L37
- (55) Riffeser, A., Jürgen, F., Bender, R., Seitz, S., & Gössl, C.A. 2003, ApJ, 599, 17
- (56) Riffeser, A.,et al. 2001, 379, 362
- (57) Rosino, L., Capaccioli, M., & D’Onofrio, M. 1989, AJ, 97, 83
- (58) Roth, M.M., Becker, T., Kelz, A., & Schmoll, J. 2004, ApJ, 603, 531
- (59) Sharov, A.S., & Alksnis, A. 1998, AstL, 24, 641
- (60) Sharov, A.S., Alksnis, A., & Nedialkov, P. 1998, AstL, 24, 445
- (61) Sharov, A.S., & Alksnis, A. 1997, AstL, 23, 540
- (62) Sharov, A.S., & Alksnis, A. 1996, AstL, 22, 680
- (63) Sharov, A.S., & Alksnis, A. 1995, AstL, 21, 579
- (64) Sharov, A.S., & Alksnis, A. 1994, AstL, 20, 711
- (65) Sharov, A.S., 1993, AstL, 19, 230
- (66) Sharov, A.S., & Alksnis, A. 1992, Ap&SS, 188, 143
- (67) Sharov, A.S., Alksnis, A., & Zharova, A.V. 2003, AstL, 26, 433
- (68) Shafter, A.W. & Irby, B.K. 2001, ApJ, 563, 749
- (69) Shirey, R. 2001, IAUC 7659
- (70) Sparke, L., & Gallagher, J.S. 2000, Galaxies in the Universe, Cambridge University Press
- (71) Sulentic., Marziani, P. & Dultzin-Hacyan, D. 2000, ARA&A, 38, 521
- (72) Supper, R. et al. 1997, A&A, 317, 328
- (73) Supper, R. et al. 2001, A&A, 373, 63
- (74) Starrfield, S., et al. 2004, ApJ, 612, L53
- (75) van den Heuvel, E.P.J., Bhattacharya, D., Nomoto, K., & Rappaport, S.A 1992, A&A, 262, 97
- (76) Swartz, D.A., Ghosh, K.K., Suleimanov, V., Tennant, A.F., & Wu, K. 2002, ApJ, 474, 382
- (77) Vaucler, G., et al. 1993, A &A, 267, L35
- (78) Walterbros, R.A.M., & Braun, R. 1992, A&AS, 92, 625
- (79) Williams, B.F., Garcia, M.R., McClintock, J.E., & Kong, A.K.H. 2004a, AJ, 128, 1588
- (80) Williams, B.F., et al. 2004b, ApJ, 615, 720
- (81) Yungelson, L., Livio, M., Truran, J. W., Tutukov, A., & Fedorova, A. 1996, ApJ, 466, 890
- (82) Yoon, S.-C., & Langer, N. 2003, A&A, 412, L53


| obs. ID | region | filter | exposure | effective | date | old SSS | old QSS | new SSS |
|---|---|---|---|---|---|---|---|---|
| time (ksec) | time (ksec) | |||||||
| 0109270701 | North1 | M | 58.2 | 54.8 | 2002-1-5 | 0/1 | 1 | |
| 0109270301 | North2 | M | 57.2 | 24.3 | 2002-1-26 | 1/3 | ||
| 0109270401 | North3 | M | 64.3 | 53.6 | 2002-6-29 | 0/2 | ||
| 0151580401 | Halo4 | 11.4 | 11.4 | 2003-2-6 | 0/1 | |||
| 0112570401 | Core1 | M | 46.0 | 28.0 | 2000-6-25 | 5/14 | 4/5 | 2 |
| 0112570601 | Core2 | M | 13.3 | 9.9 | 2000-12-28 | 4/13 | 4/5 | 1 |
| 0109270101 | Core3 | M | 57.9 | 33.3 | 2001-6-29 | 6/12 | 3 | |
| 0112570101 | Core4 | T | 64.3 | 61.1 | 2002-1-6 | 8/12 | 4/5 | 4 |
| 0112570201 | South1 | T | 67.3 | 54.4 | 2002-1-12 | 3/5 | 1/1 | 2 |
| 0112570301 | South2 | 62.8 | 46.7 | 2002-1-24 | 0/2 |
| N | exp. | ID/ref. | pn | MOS-2 | N(H) | T(bb) | L | ||||
|---|---|---|---|---|---|---|---|---|---|---|---|
| (2000) | (2000) | 10-3cts s-1 | 10-3cts s-1 | 1021 cm-2 | (eV) | erg s-1 | |||||
| 1 | 00 42 16.24 | 40 48 03.9 | S-1 | GS, OB ass. (1) | 1.480.27 | 1.4 | 122 | 1.12 | |||
| RX J004217.4+404812 (2) | |||||||||||
| 2 | 00 42 12.8 | 41 05 58.9 | C-3 | r3-122 | 1.250.48 | ||||||
| B=18.7, R=18.4 | |||||||||||
| 3 | 00 41 54.08 | 41 07 23.3 | C-2 | N 92-01 (3) | 4.30 | ||||||
| C-4 | 3.050.25 | 0.8 | 54 | 786 | |||||||
| S-1 | 5.720.56 | 0.510.10 | 1.9 | 51 | 162 | ||||||
| 4 | 00 43 08.60 | 41 07 30.6 | C-1 | r3-131, SG,V18 | 1.240.54 | 1.7 | 138 | 1.4 | |||
| C-2 | GS | 5.65 | |||||||||
| C-3 | 1.310.38 | ||||||||||
| C-4 | 1.300.43 | 1.0 | 153 | ||||||||
| 5 | 00 42 42.13 | 41 12 20.1 | C-4 | GS, N-1995 (3) | 2.310.80 | ||||||
| 6 | 00 42 47.0 | 41 14 12.4 | C-1 | r2-65 | 7.15 | ||||||
| C-2 | 4.272.05 | ||||||||||
| C-4 | 3.490.74 | 1 | 50 | 20.2 | |||||||
| 7 | 00 42 52.4 | 41 15 39.7 | C-1 | r2-12 | 60.481.57 | 1.1 | 68 | 2.9 | 417 | ||
| C-2 | 47.102.30 | 0.8 | 63 | 2.5 | 337 | ||||||
| C-3 | 64.051.34 | 1.8 | 60 | 2484 | |||||||
| C-4 | 63.351.11 | 1.7 | 60 | 2.5 | 1178 | ||||||
| 8 | 00 42 50.4 | 41 15 56.2 | C-1 | r2-56 | 1.730.79 | ||||||
| C-2 | 4.070.80 | ||||||||||
| C-3 | 5.860.50 | ||||||||||
| C-4 | 3.970.55 | ||||||||||
| 9 | 00 42 59.2 | 41 16 44.3 | C-1 | N95-05/r2-63 | 1.02 | ||||||
| C-2 | (3) | 4.64 | 0.37 | ||||||||
| C-3 | 8.811.35 | ||||||||||
| C-4 | 2.820.39 | 0.8 | 34 | 364 | |||||||
| 10 | 00 42 43.90 | 41 17 55.5 | C-1 | r2-60/N-2000 (3) | 1.36 | ||||||
| C-2 | 8.07 | ||||||||||
| C-3 | 4.221.28 | 1.010.41 | |||||||||
| C-4 | 4.340.74 | 0.970.30 | 0.7 | 49 | 20 | ||||||
| 11 | 00 43 19.4 | 41 17 59.0 | C-1 | GS, (4) | 30.2211.11 | 0.81 | 65 | 295 | |||
| C-2 | 2.28 | ||||||||||
| C-3 | 0.97 | ||||||||||
| C-4 | 0.71 | ||||||||||
| 12 | 00 43 08.30 | 41 18 20.0 | C-1 | (5) | 0.98 | 0.66 | |||||
| C-2 | 2.60 | ||||||||||
| C-3 | 10.681.01 | 1.730.35 | 0.7f | 34 | 300 | ||||||
| C-4 | 0.84 | ||||||||||
| 13 | 00 42 49.0 | 41 19 47.1 | C-1 | r2-66 | 1.00 | ||||||
| C-2 | GS | 0.37 | |||||||||
| C-3 | 0.82 | ||||||||||
| C-4 | 0.02 | ||||||||||
| 14 | 00 43 18.85 | 41 20 18.5 | C-1 | r3-8 | 75.14 | 16.640.84 | 2.5 | 64 | 653 | ||
| C-2 | RX J004318.6+412024 (2) | 12.302.78 | 1.4 | 73 | 31 | ||||||
| C-3 | GS | 6.951.10 | 0.7 | 48 | 28 | ||||||
| C-4 | 47.161.26 | 9.430.46 | 2.3 | 64 | 367 | ||||||
| 15 | 00 42 55.34 | 41 20 44.7 | C-1 | N96-05 (3) | 1.77 | ||||||
| C-2 | 2.21 | ||||||||||
| C-3 | 1.02 | ||||||||||
| C-4 | 3.490.70 | 0.85 | 39 | 155 |
Note. — References: 1) Hill et al. 1995, 2) Kahabka 1999, 3) Shafter & Irby 2001, 4) Osborne et al., 2001, 5) Shirey, 2001.
| N | exp. | ID/ref. | total | S | M | H | N(H) | T(bb) | L | |||
|---|---|---|---|---|---|---|---|---|---|---|---|---|
| (2000) | (2000) | 10-3cts s-1 | 10-3cts s-1 | 10-3cts s-1 | 10-3cts s-1 | 1021 cm-2 | (eV) | erg s-1 | ||||
| 1 | 00 39 57.78 | 40 27 23.7 | S-2/pn | GS | 8.030.84 | 7.090.57 | 1.230.31 | 1.7 | 156 | 5.4 | ||
| S-2/MOS2 | 1.760.45 | 1.010.28 | 0.070.11 | 0.460.21 | ||||||||
| 2 | 00 41 08.34 | 40 51 29.0 | S-1/pn | 1.760.45 | 1.010.28 | 0.070.11 | 0.460.21 | 2.4 | 80 | 3.3 | ||
| 3 | 00 41 36.5 | 41 00 17.0 | S-1/pn | s1-41 | 1.510.47 | 0.960.31 | 0.960.31 | 0.110.23 | 3.6 | 155 | 2.3 | |
| 4 | 00 42 07.91 | 41 04 34.2 | C-1/pn | RX J004208.2 | 5.370.64 | 2.710.43 | 1.190.27 | 0.180.20 | 0.9 | 2.1 | 7.6 | |
| C-2/pn | +410438? (1) | 2.680.86 | 0.8 | 2.3 | 10 | |||||||
| C-3/pn | 7.070.76 | 4.250.50 | 2.160.32 | 0.470.39 | 0.9 | 2.3 | 9.2 | |||||
| C-4/MOS2 | 1.920.22 | 0.420.21 | 1.610.32 | 0.440.14 | 0.9 | 1.6 | 8.9 | |||||
| 5 | 00 42 28.67 | 41 04 36.3 | C-1/pn | r3-111 (2) | 41.571.87 | 26.361.13 | 10.750.85 | 3.600.82 | 1.4 | 2.8 | 40 | |
| C-2/pn | 54.782.40 | 29.632.1 | 14.371.47 | 5.561.08 | 1.4 | 2.7 | 63 | |||||
| C-3/pn | 51.781.62 | 29.671.17 | 12.060.74 | 6.810.67 | 1.4 | 2.6 | 46 | |||||
| C-4/pn | 55.931.62 | 29.260.99 | 16.560.68 | 8.710.59 | 1.4 | 2.3 | 54 | |||||
| 7 | 00 42 36.5 | 41 13 50.1 | C-1/MOS2 | r2-42 | 1.040.37 | 0.580.29 | 0.080.17 | |||||
| C-2/MOS2 | 2.640.88 | 1.180.69 | 0.910.45 | |||||||||
| C-3/MOS2 | 3.310.50 | 2.100.41 | 0.870.25 | 0.240.19 | ||||||||
| C-4/MOS2 | 2.100.41 | |||||||||||
| 8 | 00 42 44.3 | 41 16 07.3 | C-1/pn | r1-9 | 39.91 | 1.3 | 2.7 | 13 | ||||
| C-2/pn | PN (3) | 39.75 | 0.7 | 2.4 | 66 | |||||||
| C-3/pn | 46.24 | |||||||||||
| C-4/pn | 188.40 | 0.72 | 2.1 | 68.6 | ||||||||
| 9 | 00 42 39.2 | 41 14 24.4 | C-1/MOS2 | r2-62 | 7.470.69 | 2.840.45 | 2.450.36 | 1.110.22 | 1 | 2.1 | 10.6 | |
| C-2/MOS2 | 7.320.67 | 3.170.50 | 2.610.35 | 0.500.16 | 1.0 | 2.5 | 14 | |||||
| C-3/MOS2 | 4.540.53 | 2.390.49 | 1.190.12 | 0.400.16 | 1.0 | 2.6 | 8.2 | |||||
| C-4/MOS2 | 8.940.56 | 4.010.43 | 2.620.27 | 1.560.19 | 1.08 | 2.3 | 10.7 | |||||
| 10 | 00 42 38.6 | 41 15 26.3 | C-1/pn | r2-54 | 1.50 | |||||||
| C-2/pn | 8.36 | |||||||||||
| C-3/MOS2 | 3.960.65 | 3.040.60 | 0.690.24 | 1 | 2.0 | 6.2 | ||||||
| C-4/MOS2 | 3.470.47 | 2.820.44 | 1.860.38 | 0.480.15 | 1 | 2.4 | 6.3 | |||||
| 11 | 00 43 14.3 | 41 16 50.1 | C-1/pn | r3-11 | 1.970.98 | 1.210.82 | 0.700.30 | 0.280.22 | ||||
| C-2/pn | 2.33 | |||||||||||
| C-3/pn | 2.15 | |||||||||||
| C-4/pn | 3.720.98 | 2.320.80 | 0.720.35 | |||||||||
| 12 | 00 43 06.9 | 41 18 09.0 | C-1/pn | r3-115 | 1.0 | |||||||
| C-2/pn | 3.24 | |||||||||||
| C-3/pn | 1.10 | |||||||||||
| C-4/pn | 8.290.42 | 4.050.30 | 2.230.21 | 1.410.17 | 1.16 | 69 | 1.9 | 13.3 | ||||
| 13 | 00 45 58.1 | 41 35 02.2 | H-4/pn | n1-31 | 4.30 | |||||||
| 14 | 00 46 49.27 | 42 09 26.2 | N-3/pn | 1.330.28 | 0.100.11 | 10 | 117 | 1.1 | ||||
| 15 | 00 46 16.7 | 41 36 56.0 | H-4/pn | n1-8 | 4.30 | |||||||
| 16 | 00 46 23.81 | 42 21 33.7 | N-3/pn | 1.790.45 | 1.410.34 | 0.170.11 | 0.190.25 | 1.5 | 123 | 0.6 | ||
| 17 | 00 47 00.71 | 42 21 51.9 | N-3/pn | 3.190.45 | 0.300.15 | 0.260.15 | 3.1 | 129 | 3.0 | |||
| 18 | 00 46 03.00 | 42 24 31.8 | N-3/pn | B15 | 2.240.51 | 1.310.34 | 0.050.30 | 0.500.23 | 1.3 | 137 | 1.61 |
Note. — References: 1) Supper et al. 1997, 2) Kong et al. 2002, 3) Ciardullo et al. 2002
| N | exp. | ID | ref. | total | S | M | H | N(H) | T(bb) | L | ||
|---|---|---|---|---|---|---|---|---|---|---|---|---|
| (2000) | (2000) | 10-3 s-1 | 10-3 s-1 | 10-3 s-1 | 10-3 s-1 | 1021 cm-2 | (eV) | erg s-1 | ||||
| 1 | 00 41 35.6 | 41 06 56.8 | S-1 | SSS s1-42 | 1,2,3 | 1.86 | ||||||
| RX J004135.8+4110657 | ||||||||||||
| 2 | 00 42 43.0 | 41 16 03.1 | SSS r1-35, S And | 1 | ||||||||
| 3 | 00 42 49.0 | 41 19 47.1 | C-1 | QSS r2-66 | 2 | 1.11 | ||||||
| C-2 | B-96 | 0.82 | ||||||||||
| C-3 | 1.62 | |||||||||||
| C-4 | 0.42 | |||||||||||
| 4 | 00 43 43.80 | 41 12 32.4 | C-1 | RX J004344.1+411219 | 1,2,4,5 | 4.850.75 | 4.260.55 | 0.4120 | 2.8 | 144 | 7.5 | |
| QSS | ||||||||||||
| C-2 | radio s. | 2.68 | ||||||||||
| C-3 | SSS | 4.520.95 | 4.060.33 | 0.300.33 | 0.280.43 | 4.3 | 119 | 18.1 | ||||
| C-4 | B-166 | 5.460.65 | 4.890.48 | 0.430.22 | 3.0 | 140 | 10.8 | |||||
| 5 | 00 43 27.78 | +41 18 29.2 | C-1 | r3-63 | 1,6 | 27.911.52 | 27.361.32 | 0.800.36 | 0.00.41 | |||
| C-3 | B-142 | 26.201.13 | 25.031.15 | 0.420.24 | 0.340.33 | 1.3 | 129 | 16.3 | ||||
| C-4 | SSS | 27.200.95 | 23.770.83 | 1.510.26 | 0.810.25 | 1.4 | 133 | 18.0 | ||||
| 6 | 00 42 48.97 | 41 24 06.9 | C-2 | B-95,r3-84 | 1,7 | 3.161.0 | 3.110.77 | |||||
| C-3 | SSS | 3.110.77 | 2.910.50 | 0.020.20 | ||||||||
| C-4 | 3.920.67 | 3.000.50 | 0.640.27 | 1. | 126 | 2.4 | ||||||
| 7 | 00 43 39.22 | 41 26 55.3 | C-2 | B-158 | 2,3,9,10 | 6.831.34 | 6.811.21 | 1.3 | 148 | 6.0 | ||
| C-4 | SSS | 5.330.66 | 4.360.41 | 0.080.17 | 0.510.21 | 1.3 | 148 | 5.3 | ||||
| N-1 | 8.110.61 | 8.000.54 | 0.190.15 | 0.160.19 | 1.3 | 123 | 6.9 | |||||
| 8 | 00 44 51.00 | 41 29 05.8 | N-1 | WB92a, QSS | 5 | 3.770.66 | 2.7 | 116 | 9.7 | |||
| 9 | 00 45 14.35 | +41 36 16.9 | N-1 | B-90,r3-67, QSS | 1,9 | 2.840.57 | 2.670.40 | 0.250.15 | 4.2 | 123 | 17.5 | |
| 10 | 00 46 27.75 | 42 08 00.3 | N-3 | B-476, QSS | 2 | 2.470.51 | 1.400.36 | 0.400.15 | 0.150.20 | 2.1 | 123 | 2.9 |
Note. — References: 1) Di Stefano et al. 2004, 2) Braun 1995, 3) Supper et al. 1997, 4) Bystedt et al. 1984, 5) Walterbros & Braun 1992, 6) Kong et al., 2002, 7) Kong et al. 2003, 8) Williams et al. 2004a, 9) Williams et al. 2004b, 10) Roth et al. 2004, 11) Kahabka 1999.
| observation | N(H) | T(bb) | L |
|---|---|---|---|
| 1021 cm-2 | eV | erg s-1 | |
| Core-1, pn | 3.8-4.7 | 52-60 | 46.20 |
| Core-1, MOS | 4.1-5 | 52-55 | 11.55 |
| Core-2, pn | 3.7 | 32-130 | 2.89 |
| Core-3, pn | 0.9 | 35-79 | 4.04 |
| Core-4, pn | 6.6-7.6 | 44-52 | 19.47-30. |
| Core-4, MOS | 2.1-3.7 | 53-66 | 33 |
| observation | N(H) | T(bb) | L | Td,in | |
|---|---|---|---|---|---|
| 1021 cm-2 | eV | erg s-1 | keV | ||
| Core-1 | 0.83-1.26 | 65-75 | 2.54-5.70 | 0.26-4.12 | |
| Core-2 | 0.27-1.18 | 40-78 | 1.53-10.22 | 4.4 | |
| Core-3 | 1.63-2.04 | 58-63 | 10.51-24.07 | 1.57 | |
| Core-4 | 1.65-1.93 | 57-63 | 10.40-20.22 | 1.8-3.4 |