INWARD MOTIONS OF THE COMPACT SiO MASERS AROUND VX SAGITTARII
Abstract
We report Very Long Baseline Array (VLBA) observations of 43 GHz =1, =1–0 SiO masers in the circumstellar envelope of the M-type semi-regular variable star VX Sgr at 3 epochs during 1999 April–May. These high-resolution VLBA images reveal a persistent ringlike distribution of SiO masers with a projected radius of 3 stellar radii. The typical angular size of 0.5 mas for individual maser feature was estimated from two-point correlation function analysis for maser spots. We found that the apparent size scale of maser features was distinctly smaller than that observed in the previous observations by comparing their fractions of total power imaged. This change in the size scale of maser emission may be related to stellar activity that caused a large SiO flare during our observations. Our observations confirmed the asymmetric distribution of maser emission, but the overall morphology has changed significantly with the majority of masers clustering to the north-east of the star compared to that lying to the south-west direction in 1992. By identifying 42 matched maser features appearing in all the three epochs, we determined the contraction of an SiO maser shell toward VX Sgr at a proper motion of 0.069 mas yr-1, corresponding to a velocity of about 4 km s-1 at a distance of 1.7 kpc to VX Sgr. Such a velocity is on the order of the sound speed, and can be easily explained by the gravitational infall of material from the circumstellar dust shell.
1 Introduction
Circumstellar SiO masers associated with late-type stars provide a unique probe of the kinematics in the extended atmosphere. Dominated by the mass-loss process and permeated by shocks, magnetic fields and density gradients, the extended atmosphere is a complex region located between the photosphere and the inner dust formation shell. VLBI experiments have demonstrated that SiO masers lie in ringlike configurations, presumably centered on the star, with tangential rather than radial maser gain paths (Diamond et al. 1994; Greenhill et al. 1995; Boboltz, Diamond & Kemball 1997; Phillips et al. 2003; Soria-Ruiz et al. 2004; Boboltz & Wittkowski 2005). The maser ring is not static, its diameter changes with phase of stellar pulsation, which has been observed in Mira variables R Aqr (Boboltz et al. 1997) and TX Cam (Diamond & Kemball 2003).
VX Sagittarii (VX Sgr) is a semi-regular variable with an optical period of 732 days (Kukarkin et al. 1970) and a spectral classification between M4e-Ia and M9.8. The optical light curve of VX Sgr exhibited some interesting quiescent phases intercepting a regular 732-d oscillation during the past 75 years: 1945-1950, 1963-1967 and 1997-2002 (Kamohara et al. 2005). From high-resolution optical interferometry data, Monnier et al. (2004) fitted a stellar radius (R∗) of 4.35 mas, 3 times smaller than that of 13 mas obtained by Greenhill et al. (1995). Its circumstellar envelope exhibits strong OH, H2O and SiO maser radiation (Chapman & Chohen, 1986; Greenhill et al. 1995; Murakawa et al. 2003; Kamohara et al. 2005). The distance to VX Sgr remains uncertain; for comparison with previous work by Greenhill et al. (1995), we adopt a distance of 1.7 kpc, at which VX Sgr can be classified as a red supergiant. The systemic velocity of VX Sgr is estimated to be about 5.3 km s-1 based on a dynamical model of an expanding envelope fitting to the interferometric maps of OH maser emission at 1612 MHz (Chapman & Cohen 1986).
The typical lifetime of an SiO maser feature, which is both spatially and velocity coherent, is of order one month. This limits the time interval of the monitoring observations to study the kinematics of the extended atmosphere. In this paper, we report 3-epoch (in 39 days) VLBI monitoring observations of the SiO maser emission toward VX Sgr in 1999. The observations and data reduction are described in 2; results and discussion are presented in 3, followed by conclusions in 4.
2 Observations and data reduction
The 43 GHz =1, =1–0 SiO maser emission toward VX Sgr was observed at 3 epochs (1999 April 24, May 23 and May 31) using the Very Long Baseline Array (VLBA) of the NRAO111The National Radio Astronomy Observatory is a facility of the National Science Foundation operated under cooperative agreement by Associated Universities, Inc.. The data were recorded in left circular polarization in an 8 MHz band and correlated with the FX correlator in Socorro, New Mexico. The correlator output data had 256 spectral channels, corresponding to a velocity resolution of 0.22 km s-1. A rest line frequency of 43.122027 GHz was adopted for the maser transition.
The data reduction was performed using the Astronomical Image Processing System (AIPS) package. The continuum calibrators were used to calibrate phase gradients along frequency (group delays) and bandpass characteristics. The amplitude calibration was done by estimating the scaling factors necessary to best fit a time series of the total power spectra for each station to a single calibrated total power spectrum obtained from the Mauna Kea station. A zenith opacity of about 0.05 at Mauna Kea was estimated from the variation in system temperature with zenith angle during these observations. Residual fringe-rates were obtained by performing a fringe-fitting on a reference channel (at VLSR=0.1 km s-1), which has a relatively simple structure in the maser emission. At this stage in the reduction, fringes are detected on all baselines of the VLBA including the longest SC-MK baseline. In practice, several maser components were overlapped in the reference channel. Therefore, self-calibration on the reference channel was performed to remove any structural phase. The solutions of fringe-fitting and self-calibration were then applied to the data in all the velocity channels.
Synthesis images were constructed using the standard imaging techniques. Image cubes consisting of individual channel maps were made for velocities between 22 and 8 km s-1. Uniformly weighted visibility data created a synthesized beam of 0.18 mas 0.65 mas with a position angle . The detection limit was 150 mJy beam-1, which is about 5 times the noise level in these images. The positions and flux densities of the detected maser components in each channel map were estimated by fitting a two-dimension Gaussian brightness distribution using the AIPS task SAD. The typical uncertainty of the fitted position of maser components was smaller than 10 as.
3 Results and Discussion
3.1 Maser spots and features
3.1.1 statistics for SiO maser spots and features
In each of the velocity channel maps, there are some spatially distinguished components, each of which has a bright peak. The component is called a “maser spot”. We usually see several maser spots that are clustered within a small region in space and Doppler velocity, typically 1 AU and 1 km s-1, respectively. We call such a group of maser spots a “maser feature”. Thus, spots within the same velocity channel can belong to different features. In order to study the characteristics of SiO masers, individual features were determined for each of the three epochs. The maser spots in different channels were deemed as the same feature according to the following criterion, these spots (i) appear in at least three adjacent channels, (ii) have peak flux densities greater than 200 mJy (7), and (iii) lie within 0.5 mas (see Section 3.1.2). Finally, 110, 110, and 105 maser features were selected for epochs 1, 2 and 3, respectively.
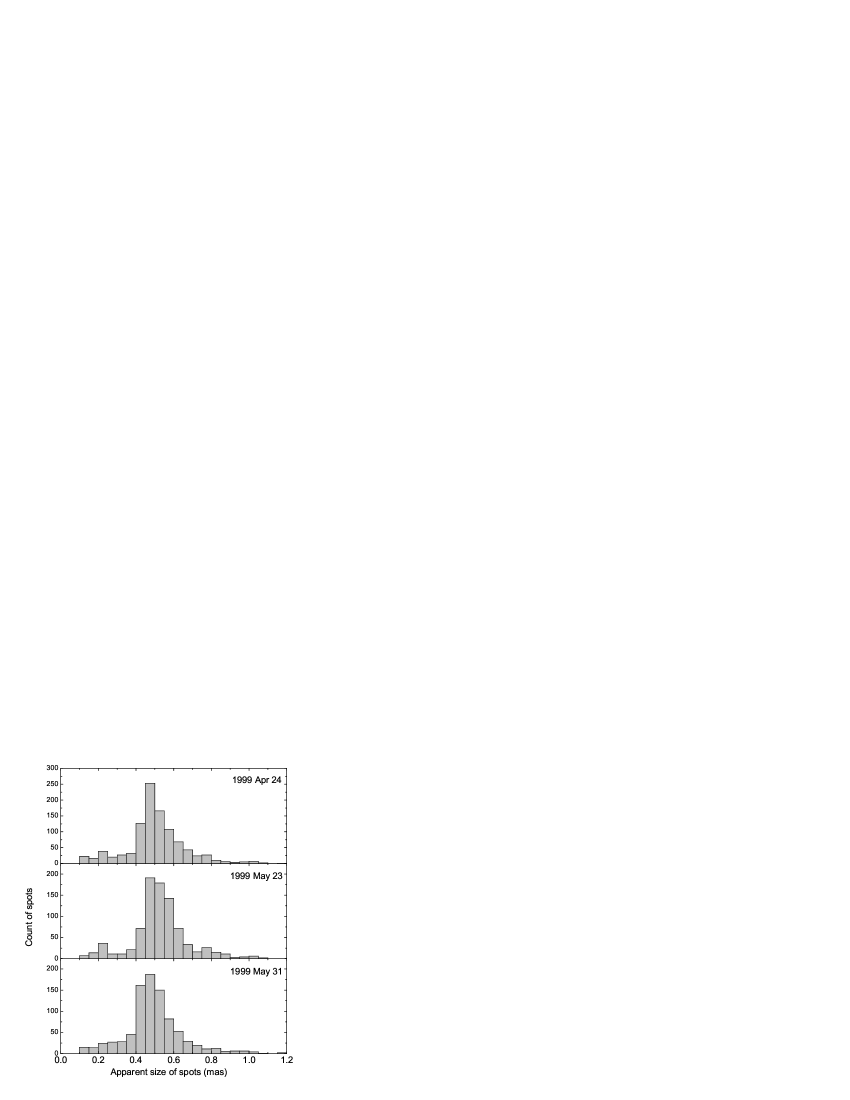
Table 1 lists both the average and median values of the sizes for the identified maser spots and features and the velocity ranges across features. The spot size was estimated from arithmetic average of sizes of the major and minor axes of the spot image, which were obtained by fitting to an elliptical Gaussian brightness distribution in the CLEAN map. Figure 1 shows the histograms of the spot size. A typical apparent size of a spot is 0.5 mas, corresponding to 0.85 AU at 1.7 kpc distance, which is slightly larger than the geometric mean of the VLBA beam of 0.35 mas at 43 GHz. The size of a feature, , is defined by
| (1) |
where is the fitted size of the brightest spot in the feature, and is the standard deviation in the estimated feature positions. Thus, the feature size indicates the extent of the distribution of the accompanying spots. It can be seen from Table 1 that the feature sizes are almost the same as the spot sizes, of 0.5 mas, suggesting significant clustering of spots in the feature. The velocity range across the feature, , is defined to be the difference between the maximal and minimal velocities of the spots in the feature. A typical value of is 0.86-1.74 km s-1 (see column (4) in Tables 2, 3 and 4), corresponding to 4-8 spots in an individual feature, with the average and median values of 1.4-1.6 and 1.3-1.5 km s-1 (see Table 1).
The full lists of parameters measured for each feature are available in Tables 2, 3 and 4, for epochs 1, 2 and 3, respectively. We fit a Gaussian curve to the velocity profile of feature containing at least four spots to determine VLSR at the peak of velocity profile and its uncertainty , full width at half maximum (FWHM) V and its uncertainty and peak flux density . For some features which can not be well represented by a Gaussian curve (labelled by a “” in Tables 2, 3 and 4), intensity weighted mean VLSR and uncertainty =0.03 km s-1 were adopted; the FWHM velocity V was equal to /2, with uncertainty =68%V=34%; the flux density of the brightest spot in each feature was deemed as its peak flux density. Feature positions (x, y) in right ascension (R.A.) and declination (Dec.) were determined from an intensity weighted average over maser spots in the feature. The uncertainty () of a feature position was defined as squared root of the square sum of (1) the mean spot distance from the defined feature position and (2) the mean measurement error of the spot positions. The weights proportional to the intensity of the spot were applied in the uncertainty estimation. The typical position uncertainties of features are 0.01 mas and 0.02 mas for R.A. and Dec., respectively. The positions are measured with respect to the reference feature at (0, 0) (labelled by a “r” in Tables 2, 3, and 4).
3.1.2 Two-Point Correlation Function of Maser Spots
To determine the criterion of angular separation for identifying the maser features, we performed the “two-point correlation function” analysis. The technique has been used in the analysis of distributions of water masers in W49N (Walker 1984; Gwinn 1994), and W3 IRS5 (Imai, Deguchi & Sasao 2002). The two-point correlation function of maser spots describes the number of spots per unit angular area (1′′1′′) with a given separation, , on the sky (x-y) plane from an arbitrary spot. This function can be expressed as (Imai, Deguchi & Sasao, 2002)
| (2) |
where
| (3) |
Here dr is a separation of between the successive bins in the plot, is the area of annulus, is the total spot number, and the indices run over all spots.
Figure 2 shows the two-point correlation functions of SiO maser spots around VX Sgr at each epoch. The function for spots can be fitted by a power law, , on certain ranges. Interestingly, we found two power-law fits on scale ranges of 0.03-0.25 mas and 0.5-20 mas at each epoch, corresponding to a linear-scale range of 0.05-0.43 AU and 0.85-34 AU. The two steep slopes with an index show that the maser spots are strongly clustered within the corresponding scales. The distribution between 0.25 and 0.5 mas is consistent with being flat, indicating no clustering on these scales. The break of the power-law at 0.25 mas suggests a characteristic scale size for clustering of spots to make a feature. Therefore, the angular diameter should be 0.5 mas for each feature. Consequently, combining spots separated by less than 0.5 mas yields physical maser features. Another large region of 0.5-20 mas is more likely to be the clusters of features since it covers almost the entire mapping region of the detected masers. Because the uncertainty of relative spot positions is 0.01 mas, the plot shown in Figure 2 at separations less than 0.01 mas may not be accurate.
From above two-point correlation function analysis, we obtained a typical angular diameter of 0.5 mas for clustering of spots to create maser features. But, this criterion may be uncertain for some maser features. In addition, this technique does not include any information of Doppler velocity of masers. Thus it only provides a crude criterion for identifying maser features. Actually, in the procedure of identifying maser features, we also examined the intensity-velocity profiles of features and, we treated them as separate features if they were distinctly multiple peaks within 0.5 mas.
3.2 Images of the SiO maser Shell
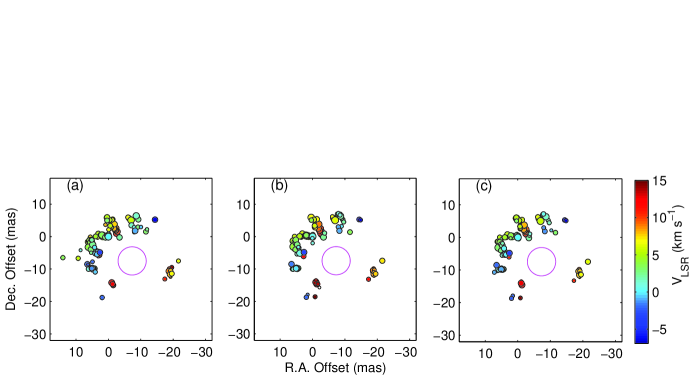
Figure 3 shows the distributions of maser features for three epochs. A persistent ringlike distribution of SiO masers around VX Sgr with the strongest emission lying to the north-east (NE) of the star can be seen from these images. The SiO maser shell should be close to, but above, the stellar photosphere of VX Sgr. If we adopt a stellar radius R∗=4.35 mas and an inner radius of dust shell of 60 mas (Monnier et al. 2004), an estimated radius of 12.5 mas (Fig. 3) indicates that the maser shell lies close to the stellar surface within about 3 R∗ and of course in the inner dust shell. This is well consistent with the typical 2-4 R∗ for late-type stars (Diamond et al. 1994).
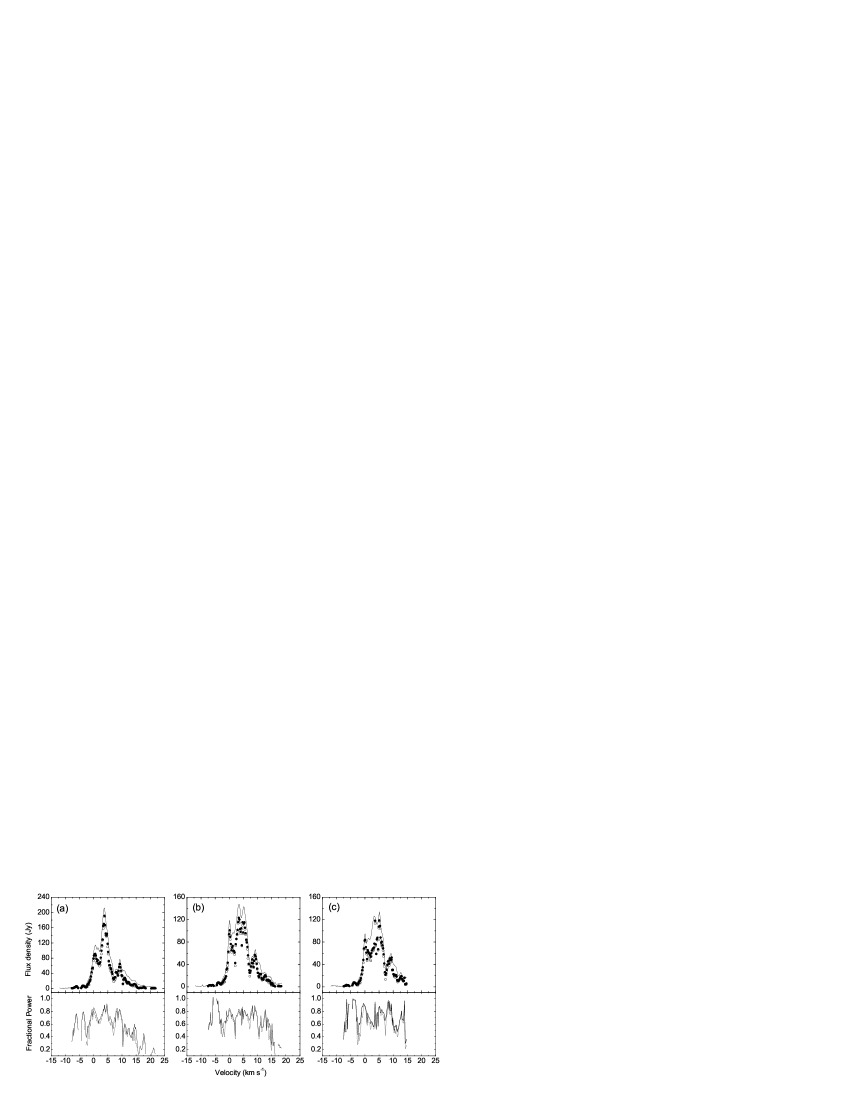
In the upper panel of Figure 4, we compare the total power imaged by the VLBA (filled circle) to the total power (solid line) obtained from the Mauna Kea antenna. The total power imaged is obtained by fitting 2-dimension Gaussian components (maser spots) in all the channels and then by summing all spots belonging to features for a given channel rather than flux collected from image pixels. Lower panel shows that the fraction of total power imaged (solid line) is mostly between 0.5 and 0.9. On average, about 70% of the total luminosity of masers were detected in our observations. As shown in Figure 1, the apparent sizes of maser spots mostly ranged from 0.3 to 0.7 mas, with a mean of 0.5 mas. This mean scale size is slightly larger than the geometric mean of the VLBA beam of 0.35 mas at 43 GHz. Therefore, 30% missing flux in our map is mainly due to the high spatial resolution of the interferometric array. That is, most of maser components are detected in our VLBI observations and have a compact scale size of about 0.5 mas. Greenhill et al. (1995) detected some dense velocity coherent structures with a characteristic size of 0.2 mas in the extended atmosphere; but 74% of the maser flux was resolved by their observations of the 43 GHz SiO =1 =1–0 transition in 1992, suggesting that the extended atmosphere also had a lot of undetected masers with the angular scales larger than about 3 mas. Doeleman et al. (1998) showed that only of the total flux density were detected in a single baseline VLBI observation of the 86 GHz SiO =1 =2-1 transition in 1994, inferring that most of 86 GHz SiO maser emission were larger than the beam size of 0.4 mas. Because the flux density threshold is about 1.8 Jy (5) on each channel image in the observations of Greenhill et al. (1995), for comparison, we also calculate the fraction of total power imaged with the 1.8 Jy threshold for 2-dimension Gaussian components (open circle and dotted line in Figure 4). We find that the fraction of total power imaged for components with the 1.8 Jy threshold (dotted line) is almost the same as that for all maser components (solid line). Hence, our result is significantly different from that of Greenhill et al. (1995), implying that the apparent size scale of maser features became distinctly smaller in our observations than the previous ones. It should be noted that the earlier VLBI observations suffered from some kind of electronic noise in the VLBI systems that decorrelated the signals, which would result in a net loss in the observed flux density.
Kamohara et al. (2005) showed that the 43 GHz =1, =1–0 SiO masers flared around 1999 March, which was within the 6-yr (1997-2003) quiescent phase when the regular pulsation was terminated. They proposed that the flare of SiO masers was due to the increase of the gas ejected from the photosphere to excite SiO maser emission under collisional pumping in a shock. If this model is correct, it can be applied to the diminished size of maser emission toward VX Sgr observed in 1999. The larger kinetic energy of the outflow from the photosphere may produce larger turbulent motions in maser regions in 1999. Such turbulent motions can then create steeper velocity gradients in a smaller coherent path length in a postshock region, i.e., forming the compact maser features. This can also explain why more extended maser clouds were seen from VLBI observations in 1992 August (Greenhill et al. 1995), because a weak outflow can be inferred from the observed low SiO maser emission presumably due to the decrease in the mass loss rate (Kamohara et al. 2005).
We also notice that the SiO maser emission in the NE is distinctly stronger than that in the south-west (SW). This suggests an asymmetric mass loss rate, i.e., the mass loss toward the NE should be more significant in our observation sessions. This is quite different from the VLBI observations in 1992 (Greenhill et al. 1995) and 1994 (Doeleman et al. 1998), which showed major maser emission concentrating in the SW region and thus suggested a larger mass loss from the SW part. Combined together, these data show a remarkable change in the major mass loss direction from the SW (in 1992 and 1994) to the NW in 1999. However, the mechanism responsible for the variation of the mass loss from the SW to the NE remains to be understood. This may also be related to the optical stellar phase and can be clarified in the future with multi-epoch VLBI observations.
3.3 Proper Motion
From Figure 3, it is apparent that some SiO maser features live longer than 39 days, the maximum time separation among three epochs. This enables us to study their proper motions and the kinematics of the circumstellar envelope of VX Sgr by comparing the matched features that appear in all the three epochs.
Because of the nature of standard VLBI data reduction, the absolute position of the phase center in each image is lost. For studying the proper motion, we must align multi-epoch maps. The feature used for registration is the one with a velocity V0 km s-1 (labelled by a “r” in Tables 2, 3 and 4) at all the three epochs. This feature was chosen because of its similarity in both morphology and velocity. The coordinate frames for the three epochs were then shifted to align the origin (0, 0) with this feature. At an assumed distance of 1.7 kpc, a proper motion of 0.1 mas in 39 days corresponds to 7.5 km s-1. The expansion velocity of the H2O masers, estimated from a standard expanding outflow model, is 10 and 20 km s-1 at the inner and outer of the H2O maser shell, respectively (Murakawa et al. 2003). The maximum proper motion for SiO masers should be less than these values according to the standard expanding outflow model (Chapman & Cohen 1986). Thus the allowable change in position is less than 0.13 mas during our observations, corresponding to the largest possible velocity of 10 km s-1. Allowing the maximum position uncertainty of (0.05, 0.07) mas (see Tables 2, 3 and 4), the angular separation during all observation sessions should not exceed 0.2 mas. We can match these features from one epoch to another using this criterion. However, there may be some maser features lying within the angular separation of less than 0.2 mas at a single epoch, this gives some difficulties to match them among three epochs. Thus, we also examined the velocity profiles and flux densities of the likely matched features. We only selected the matched feature with the similarity in both velocity profile and flux density if a feature at one epoch has multiple possible matched features at another. As a result, 58 commonly matched maser features were found between first two epoches and 42 features were identified among all three epoches (see Tables 2, 3 and 4). This suggests that lifetime of SiO maser features around VX Sgr could be larger than one month. Assuming an exponential decay of SiO maser features, we estimated a scale lifetime of 444 days from our 3-epoch data.
Actually, the process of aligning maps for all the three epochs on a feature located on the shell could introduce a systematic bias in the proper motion estimate; individual maser proper motions are uncertain by a constant offset vector that represents the motion of the reference feature. If we assume that the average of motions for all matched features represents the motion of the reference feature, it was only about (-0.01, 0.01) mas in (R.A., Dec.) during our observation sessions (39 days), and can be ignored compared to the possible position errors discussed above. For the following proper motion study, 42 matched maser features detected in all three observing sessions were chosen. Figure 5 shows the velocity profiles of these 42 SiO maser features. The velocity profile and flux density for each matched feature is very similar from one epoch to another.
One way to look into the global proper motion is to compute separations between pairwise combinations of features. The pairwise separations technique has been applied to SiO masers toward R Aqr (Boboltz et al. 1997) and has no dependence on the alignment of maps. In this procedure, a separation between two features at one epoch and that between the corresponding features at another epoch are calculated. The difference between these two separations is referred to as the pairwise separation. When the calculation is repeated for all the possible combinations of matched feature pairs, mean values of these pairwise separations are 0.003, and 0.003 mas in an interval of 8, 31 and 39 days, respectively, where the uncertainties are the standard error of the mean. By performing a weighted linear least-squares fit to these values, we obtained a proper motion of 0.048 mas yr-1. However, the fitted motion may decrease toward zero due to the bias caused by calculating all the possible pairs, including small separations. To minimize this effect and determine a representative value for the shift due to the proper motion, we only computed pairwise separations for those pairs separated by more than 12 mas, here 12 mas represents the radius of maser shell. The separation of 12 mas is important because the centers of the pairs are located on the star and the pairwise separations of such pairs directly indicates the global motion of the SiO maser shell. Figures 6 (a), (b) and (c) show results from those pairs separated by more than 12 mas over time intervals of 8, 31 and 39 days, respectively. As indicated by bold lines in Figure 6, the mean of each of these distributions is negative, implying an overall contraction of the maser shell. These mean shift values are 0.004, 0.004 and 0.005 mas in an interval of 8, 31 and 39 days, respectively. This gives a proper motion 0.069 mas yr-1 or a velocity of 0.6 km s-1. Actually, this velocity should be taken as the upper limit to the true contraction because the pairwise separations for those pairs separated by more than the radius of maser shell would be greater than the real separation of the maser ring. In above analysis of proper motion, the uncertainty quoted for the mean shift of pair separations is the standard error, which is different from the method used by Boboltz et al. (1997). For comparison, we obtained an infall velocity of 4.20.2 km s-1 for those pairs separated by more than 12 mas, by using exactly the same method of Boboltz et al. (1997). These are consistent with our estimates with even smaller errors. Thus, as a conservative estimation, we adopt the standard error in the paper.
We conclude that the maser shell contracts toward the star with a velocity of about 4 km s-1. However, converting from proper motion (mas yr to velocity (km s-1) depends on the distance D (kpc), . Under the assumption of a distance of 1.7 kpc, the infall velocity of 4 km s-1 in VX Sgr is similar to 4.20.9 km s-1 in R Aqr (Boboltz et al. 1997). This speed of contraction can be easily obtained through the gravitational infall. For the central star mass of 10 M⊙ (Chapman & Cohen 1986), the velocity of a particle gravitationally falling from the inner dust shell at 60 mas to the SiO maser shell at 12 mas would be about 25 km s-1. Assuming a temperature of 1500 K (Doel et al. 1995) and adiabatic condition of SiO maser region, the sound speed should not exceed 3 km s-1. Thus, the inward proper motion of SiO maser shell is on the order of the sound speed. In addition, our measured infall velocity is comparable to the shock velocity in the radio photospheres of long-period variables of 5 km s-1 at a distances beyond approximately 2 R∗ (Reid & Menten 1997).
The possible existence of a bipolar outflow was speculated by Kamohara et al. (2005) to explain the distribution and the velocity structure of SiO masers toward VX Sgr seen at a single epoch. After adding more data overlapping their observing epoch, we have measured an inward proper motion of SiO masers toward VX Sgr, which excludes the proposed bipolar outflow model. Actually, the kinematics in SiO maser regions could be very complicated. An SiO maser movie of Mira variable TX Cam has displayed the co-existence of both local infall and outflow motions at a certain stellar phase (Dimond & Kemball 2003). Our current data are insufficient to reveal such a complicated kinematics in VX Sgr.
The contraction of SiO maser shell has been reported in two Mira variables R Aqr (Boboltz et al. 1997) and TX Cam (Diamond & Kemball 2003). Our observations provide the first direct evidence for an inward motion of SiO maser shell around red supergiant variable star. The corresponding optical pulsation phases of three VLBA observations that revealed an inward motion toward R Aqr are =0.78, 0.87 and 0.04, respectively (Boboltz et al. 1997). Diamond and Kemball (2003) found the expansion of SiO maser shell in TX Cam with a ballistic gravitational deceleration over the stellar phase interval from =0.7 to 1.5; but beyond the optical minimum at 1.5, a new shell forms interior to the previously expanding outer shell. For the motion of the maser shell around VX Sgr in 1999, the accurate stellar phase is unknown because of the temporary quench of the optical pulsation from 1997 to 2003. Assuming that the pulsating period was kept even in the quiescent phase, we estimated the stellar optical phase of our observation sessions to be from 0.75 to 0.80 (Kamohara et al. 2005). Thus, we can see that the stellar optical phase of red supergiant VX Sgr is very close to that of Mira variables R Aqr and TX Cam when the SiO maser shell contracts. These results can be compared with that seen in the theoretical kinematical model adopted in Humphreys et al. (2002). Our analysis shall provide another test for such a theoretical model.
In order to investigate the effect of stellar pulsation on the SiO maser emission, Humphreys et al. (1996, 2002) and Gray & Humphreys et al. (2000) coupled an SiO maser model (Doel et al. 1995; Gray et al. 1995) to an M-type Mira hydrodynamic pulsation model (Bowen 1988). These numerical simulations show that masing material starts to contract after a shock wave in the envelope arrives at the maser zone, and such an infall under gravity lasts for about one third of the stellar pulsation cycle; while for the remainder of the cycle, a shock-driven expansion of the maser ring dominates. So the contraction of the SiO maser shell only appears in a certain stellar phase range, during which a shock front disrupts the existing maser ring and new features then form in the postshock region. The newly forming maser ring has a smaller angular extent than previously existing ring. Humphreys et al. (2002) quote a mean stellar phase of the arrival of the shock in the SiO maser zone of . However, these simulations have a difficulty in relating the model phase to optical stellar phase. That is, these simulations did not offer the accurate optical stellar phase range when the SiO maser shell contracts. The relationship between the optical and model phases could be reliably fixed by a combination of interferometric observations and theory in the future. For the moment, the analysis of the inward proper motions of SiO masers toward VX Sgr, R Aqr and TX Cam suggests that the contraction of SiO maser shell could occur during an optical stellar phase =0.5 to 1.
4 Conclusions
We summarize the main results obtained from 3-epoch (in 39 days) monitoring observations of the 43 GHz SiO circumstellar maser emission toward VX Sgr, covering a stellar optical phase range from 0.75 to 0.80.
-
(1).
The two-point correlation function of spots shows a power-law relation on scales of 0.03-0.25 mas and 0.5-20 mas. The break of the power-law at 0.25 mas suggests an angular size of 0.5 mas for clustering of spots to make a feature.
-
(2).
Our observations confirmed a persistent ringlike structure of SiO masers with a projected radius of about 3 stellar radii (R∗), which is consistent with the typical 2-4 R∗ for late-type stars. The overall morphology has changed significantly with the majority of masers appearing in North-East of the star in 1999, compared to that lying to the South-West direction in 1992 and 1994, suggesting the change of mass loss rate over 5-7 years.
-
(3).
We found that the apparent size scale of maser features in 1999 is distinctly smaller than that observed in 1992, by comparing their fractions of total power imaged. This may be related to stellar activity that caused a large SiO flare during our observations.
-
(4).
Analysis of pairwise separation of 42 matched features suggests that the maser shell contracts toward VX Sgr with a velocity of about 4 km s-1. This infall velocity is similar in number to that seen in R Aqr. The stellar optical phase of red supergiant VX Sgr is very close to that of Mira variables R Aqr and TX Cam when the SiO maser shell contracts.
We thank an anonymous referee for helpful comments that improved the manuscript. Z.-Q. Shen also acknowledges the support by the One-Hundred-Talent Program of Chinese Academy of Sciences.
References
- (1) Boboltz, D. A., Diamond, P. J., & Kemball, A. J. 1997, ApJ, 487, L147
- (2) Boboltz, D. A., & Wittkowski, M. 2005, ApJ, 618, 953
- (3) Bowen, G. H. 1988, ApJ, 329, 299
- (4) Chapman, J. M., & Cohen, R. J. 1986, MNRAS, 220, 513
- (5) Diamond, P. J., Kemball, A. J., Junor, W., Zensus, A. Benson, J., & Dhawan, V. 1994, ApJ, 430, L61
- (6) Diamond, P. J., & Kemball, A. J. 2003, ApJ, 599, 1372
- (7) Doel, R. C., Gray M. D., Humphreys, E. M. L., Braithwaite, M. F., & Field, D. 1995, A&A, 302, 797
- (8) Doeleman, S. S., Lonsdale, C. J., & Greenhill, L. J. 1998, ApJ, 494, 400
- (9) Elitzur, M., 1992, Astronomical Masers (Dordrecht: Kluwer)
- (10) Goldreich, P., & Keeley, D. A., 1972, ApJ, 174, 517
- (11) Goldreich, P., Kwan, J., 1974, ApJ, 190, 27
- (12) Gray, M. D., Humphreys, E. M. L., & Field, D. 1995, Ap&SS, 224, 63
- (13) Gray, M. D., & Humphreys, E. M. L. 2000, New Astron., 5, 155
- (14) Greenhill, L. J., Colomer, F., Moran, J. M., Danchi, W. C., & Bester, M. 1995, ApJ, 449, 365
- (15) Gwinn, C. R. 1994, ApJ, 429, 241
- (16) Humphreys, E. M. L., Gray, M. D., Yates, J. A., Field, D., Bowen, G., & Diamond, P. J. 1996, MNRAS, 282, 1359
- (17) Humphreys, E. M. L., Gray, M. D., Yates, J. A., Field, D., Bowen, G. H., & Diamond, P. J. 2002, A&A, 386, 256
- (18) Imai, H., Deguchi, S., & Sasao, T. 2002, ApJ, 567, 971
- (19) Kamohara, R., Deguchi, S., Miyoshi, M., & Shen, Z.-Q., 2005, PASJ, 57, 341
- (20) Kukarkin, B. V., Khopopov, P. N., Efremov, Yu, N., Kukarkina, N.P., Kurochkin, N. E., Medvedeva, G. I., Perova, N. B., Federovich, V. P., & Frolov, M. S. 1970. Catalogue of Variable Stars, Astronomical Council of the Academy of Sciences in the USSR, Moscow.
- (21) Monnier, J. D. et al. 2004, ApJ, 605, 436
- (22) Murakawa, K., Yates, J. A., Richards, A. M. S., & Cohen, R . J. 2003, MNRAS, 344, 1
- (23) Phillips, R. B., Straughn, A. H., Doeleman, S. S., & Lonsdale, C. J. 2003, ApJ, 588, L105
- (24) Reid, M. J., & Menten, K. M. 1997, ApJ, 476, 327
- (25) Soria-Ruiz, R., Alcolea, J., Colomer, F., Bujarrabal, V., Desmurs, J. F., Marvel, K. B., & Diamond, P. J. 2004, A&A, 426, 131
- (26) Walker, R. C. 1984, ApJ, 280, 618


| Spot Size | Feature Size | Feature Velocity Range | |||||||||||
|---|---|---|---|---|---|---|---|---|---|---|---|---|---|
| Average | Average | Median | Median | Average | Average | Median | Median | Average | Median | ||||
| Epoch | Nsa | (mas) | (AU) | (mas) | (AU) | Nfb | (mas) | (AU) | (mas) | (AU) | (km s-1) | (km s-1) | |
| 1 | 780 | 0.51 | 0.87 | 0.51 | 0.87 | 110 | 0.53 | 0.90 | 0.50 | 0.85 | 1.61 | 1.52 | |
| 2 | 720 | 0.53 | 0.90 | 0.52 | 0.88 | 110 | 0.55 | 0.94 | 0.52 | 0.88 | 1.42 | 1.33 | |
| 3 | 670 | 0.50 | 0.85 | 0.48 | 0.82 | 105 | 0.50 | 0.85 | 0.48 | 0.82 | 1.41 | 1.33 | |
| ID | VLSR | V | x | y | P | S | Match ID | |||||||
|---|---|---|---|---|---|---|---|---|---|---|---|---|---|---|
| (km s-1) | (km s-1) | (km s-1) | (mas) | (mas) | (mas) | (Jy) | (Jy km s-1) | Epoch 2 | 3 | |||||
| (1) | (2) | (3) | (4) | (5) | (6) | (7) | (8) | (9) | (10) | (11) | (12) | (13) | (14) | |
| 1 | 21.14 | 0.04 | 1.74 | 0.87 | 0.27 | -6.819 | 0.008 | -19.732 | 0.021 | 0.47 | 1.3 | 8.1 | ||
| 2 | 17.75 | 0.01 | 1.52 | 0.55 | 0.04 | -1.113 | 0.004 | -15.783 | 0.012 | 0.46 | 3.8 | 14.5 | 1 | |
| 3∗ | 17.47 | 0.03 | 0.65 | 0.33 | 0.22 | -6.737 | 0.010 | -24.075 | 0.029 | 0.48 | 0.7 | 2.1 | ||
| 4 | 16.63 | 0.07 | 1.09 | 1.14 | 0.78 | -0.676 | 0.012 | -17.328 | 0.026 | 0.49 | 0.7 | 6.6 | ||
| 5∗ | 16.62 | 0.03 | 0.65 | 0.33 | 0.22 | -1.437 | 0.008 | -14.512 | 0.029 | 0.45 | 0.8 | 2.1 | ||
| 6 | 14.91 | 0.03 | 2.17 | 0.65 | 0.07 | -0.822 | 0.011 | -14.311 | 0.011 | 0.51 | 5.3 | 24.7 | ||
| 7 | 14.67 | 0.03 | 1.30 | 0.54 | 0.12 | -0.919 | 0.008 | -18.247 | 0.020 | 0.55 | 2.0 | 9.0 | 3 | |
| 8 | 14.47 | 0.02 | 1.09 | 0.63 | 0.11 | -19.553 | 0.004 | -9.521 | 0.014 | 0.47 | 1.7 | 6.3 | ||
| 9 | 14.16 | 0.01 | 1.52 | 1.49 | 0.69 | -1.483 | 0.011 | -14.986 | 0.015 | 0.52 | 7.8 | 23.8 | ||
| 10 | 12.78 | 0.05 | 1.95 | 1.55 | 0.55 | -1.280 | 0.003 | -14.632 | 0.014 | 0.48 | 3.9 | 21.6 | ||
| 11 | 12.61 | 0.04 | 3.48 | 0.95 | 0.11 | -1.010 | 0.003 | -14.191 | 0.009 | 0.49 | 9.3 | 75.9 | 8 | 5 |
| 12 | 12.38 | 0.02 | 1.09 | 0.71 | 0.24 | -18.858 | 0.010 | -10.848 | 0.013 | 0.54 | 3.6 | 13.2 | ||
| 13 | 11.41 | 0.03 | 2.61 | 1.34 | 0.21 | -2.476 | 0.008 | 1.001 | 0.015 | 0.55 | 13.7 | 91.1 | 11 | 7 |
| 14 | 11.03 | 0.05 | 0.87 | 0.30 | 0.20 | -18.777 | 0.005 | -9.871 | 0.015 | 0.49 | 1.9 | 5.7 | ||
| 15 | 10.91 | 0.02 | 0.87 | 0.41 | 0.27 | -17.394 | 0.006 | -13.077 | 0.017 | 0.50 | 2.0 | 6.5 | 12 | 10 |
| 16 | 10.87 | 0.02 | 1.09 | 0.39 | 0.09 | 2.764 | 0.025 | -5.737 | 0.030 | 0.57 | 2.9 | 11.8 | ||
| 17 | 10.33 | 0.03 | 1.96 | 0.68 | 0.12 | -2.752 | 0.016 | 1.517 | 0.016 | 0.80 | 14.7 | 57.8 | 13 | |
| 18∗ | 9.92 | 0.03 | 0.65 | 0.33 | 0.22 | 3.126 | 0.019 | -6.055 | 0.021 | 0.51 | 1.8 | 4.6 | ||
| 19 | 9.56 | 0.01 | 1.52 | 0.41 | 0.02 | -2.447 | 0.014 | 2.603 | 0.028 | 0.39 | 15.0 | 30.6 | 16 | 14 |
| 20 | 9.39 | 0.02 | 1.52 | 0.55 | 0.09 | -2.224 | 0.011 | 2.008 | 0.022 | 0.61 | 31.7 | 128.9 | 17 | |
| 21 | 9.00 | 0.01 | 1.52 | 0.67 | 0.04 | -0.816 | 0.002 | 3.522 | 0.013 | 0.52 | 9.0 | 35.9 | 20 | 18 |
| 22 | 8.61 | 0.02 | 1.74 | 0.57 | 0.07 | -1.948 | 0.016 | 2.327 | 0.029 | 0.59 | 16.4 | 56.2 | ||
| 23 | 8.02 | 0.02 | 1.52 | 0.83 | 0.10 | -1.442 | 0.008 | 4.007 | 0.018 | 0.63 | 5.0 | 24.3 | 23 | |
| 24 | 8.02 | 0.05 | 2.39 | 0.68 | 0.09 | -19.006 | 0.008 | -11.645 | 0.024 | 0.50 | 11.1 | 42.2 | 27 | 26 |
| 25 | 7.99 | 0.03 | 1.52 | 2.05 | 4.02 | -18.705 | 0.002 | -10.504 | 0.007 | 0.44 | 6.2 | 32.8 | 24 | |
| 26 | 7.99 | 0.05 | 0.87 | 0.69 | 0.24 | -2.224 | 0.014 | 1.989 | 0.032 | 0.45 | 21.8 | 56.1 | ||
| 27∗ | 7.96 | 0.03 | 1.09 | 0.54 | 0.37 | -19.172 | 0.015 | -12.393 | 0.024 | 0.37 | 1.0 | 3.1 | ||
| 28∗ | 7.93 | 0.03 | 0.65 | 0.33 | 0.22 | -19.192 | 0.036 | -10.487 | 0.054 | 1.43 | 7.5 | 9.7 | 26 | 28 |
| 29 | 7.86 | 0.03 | 1.96 | 0.63 | 0.10 | -1.874 | 0.012 | 3.840 | 0.011 | 0.51 | 9.7 | 47.2 | 25 | 25 |
| 30 | 7.86 | 0.03 | 1.74 | 0.55 | 0.08 | -1.681 | 0.008 | 2.554 | 0.012 | 0.54 | 8.3 | 33.7 | 22 | |
| 31 | 7.74 | 0.01 | 0.87 | 0.40 | 0.03 | 0.904 | 0.007 | 3.643 | 0.019 | 0.48 | 1.3 | 4.4 | ||
| 32∗ | 7.70 | 0.03 | 1.09 | 0.54 | 0.37 | 5.554 | 0.017 | -0.181 | 0.022 | 0.57 | 2.3 | 9.7 | ||
| 33∗ | 7.17 | 0.03 | 0.87 | 0.43 | 0.30 | -0.591 | 0.005 | 2.829 | 0.019 | 0.52 | 2.5 | 7.8 | 30 | 30 |
| 34 | 6.84 | 0.02 | 1.52 | 0.54 | 0.09 | -19.553 | 0.007 | -11.422 | 0.024 | 0.77 | 3.6 | 14.5 | 31 | 31 |
| 35 | 6.60 | 0.04 | 1.96 | 0.91 | 0.25 | -6.365 | 0.004 | 5.655 | 0.005 | 0.45 | 6.2 | 34.4 | 32 | 32 |
| 36 | 6.45 | 0.04 | 1.74 | 0.83 | 0.25 | -6.083 | 0.004 | 5.928 | 0.011 | 0.44 | 3.6 | 18.7 | ||
| 37 | 6.43 | 0.02 | 1.30 | 0.62 | 0.11 | -0.786 | 0.010 | 2.773 | 0.017 | 0.66 | 5.5 | 19.4 | 34 | |
| 38∗ | 6.42 | 0.03 | 0.65 | 0.33 | 0.22 | -0.114 | 0.029 | 2.157 | 0.025 | 0.53 | 2.4 | 7.5 | ||
| 39 | 6.40 | 0.06 | 1.30 | 0.49 | 0.33 | 5.028 | 0.008 | -1.440 | 0.021 | 0.61 | 4.4 | 15.7 | ||
| 40 | 6.28 | 0.04 | 1.09 | 0.70 | 0.43 | -21.632 | 0.004 | -7.501 | 0.016 | 0.47 | 2.0 | 8.1 | 35 | 33 |
| 41 | 6.19 | 0.03 | 2.39 | 0.84 | 0.11 | 0.431 | 0.004 | 5.829 | 0.014 | 0.48 | 7.7 | 43.9 | 37 | 36 |
| 42 | 6.11 | 0.03 | 1.30 | 0.68 | 0.25 | -1.270 | 0.005 | 5.285 | 0.010 | 0.44 | 4.8 | 19.2 | 38 | 38 |
| 43∗ | 5.99 | 0.03 | 0.65 | 0.33 | 0.22 | -1.106 | 0.020 | 5.189 | 0.021 | 0.81 | 5.7 | 15.6 | ||
| 44∗ | 5.98 | 0.03 | 0.65 | 0.33 | 0.22 | -1.072 | 0.008 | 2.873 | 0.019 | 0.50 | 1.6 | 4.2 | ||
| 45∗ | 5.61 | 0.03 | 0.87 | 0.43 | 0.30 | 3.375 | 0.008 | -0.204 | 0.022 | 0.63 | 3.5 | 8.5 | 39 | |
| 46 | 5.61 | 0.03 | 1.09 | 0.58 | 0.24 | 9.343 | 0.004 | -6.678 | 0.012 | 0.49 | 2.4 | 9.4 | ||
| 47 | 5.45 | 0.04 | 3.26 | 1.42 | 0.16 | -6.999 | 0.003 | 5.063 | 0.005 | 0.48 | 22.0 | 174.9 | 40 | 40 |
| 48 | 5.39 | 0.08 | 0.87 | 0.70 | 0.14 | 0.412 | 0.012 | 5.933 | 0.020 | 0.50 | 9.5 | 33.3 | ||
| 49∗ | 5.37 | 0.03 | 0.87 | 0.43 | 0.30 | -0.410 | 0.011 | 5.122 | 0.018 | 0.61 | 5.1 | 16.1 | 45 | 43 |
| 50 | 5.32 | 0.06 | 1.52 | 0.74 | 0.40 | 3.134 | 0.007 | 0.891 | 0.012 | 0.56 | 8.5 | 31.9 | 42 | 42 |
| 51 | 5.26 | 0.05 | 1.09 | 1.45 | 0.65 | 6.405 | 0.005 | -1.626 | 0.022 | 0.46 | 6.5 | 15.8 | 53 | |
| 52 | 5.26 | 0.03 | 0.87 | 0.70 | 0.47 | 4.796 | 0.007 | -2.225 | 0.021 | 0.52 | 1.9 | 6.8 | ||
| 53 | 4.94 | 0.01 | 1.09 | 0.69 | 0.08 | -0.547 | 0.005 | 3.340 | 0.010 | 0.48 | 3.9 | 16.5 | 44 | 41 |
| 54 | 4.92 | 0.02 | 2.39 | 0.65 | 0.07 | 1.797 | 0.004 | -0.044 | 0.010 | 0.53 | 19.6 | 60.3 | 49 | 51 |
| 55 | 4.67 | 0.02 | 1.09 | 0.43 | 0.11 | 3.964 | 0.004 | 0.075 | 0.007 | 0.47 | 4.7 | 15.1 | 52 | 48 |
| 56 | 4.65 | 0.02 | 1.52 | 0.75 | 0.14 | 5.790 | 0.013 | -3.775 | 0.012 | 0.27 | 4.4 | 19.6 | ||
| 57 | 4.61 | 0.01 | 1.52 | 2.61 | 1.44 | 5.625 | 0.004 | -2.553 | 0.021 | 0.29 | 15.5 | 45.8 | ||
| 58 | 4.50 | 0.05 | 2.82 | 1.00 | 0.15 | 5.661 | 0.005 | -2.649 | 0.014 | 0.18 | 10.9 | 31.3 | ||
| 59∗ | 4.45 | 0.03 | 1.09 | 0.54 | 0.37 | 6.025 | 0.011 | -1.322 | 0.031 | 0.63 | 8.8 | 27.8 | 53 | 53 |
| 60 | 4.24 | 0.02 | 1.09 | 0.33 | 0.04 | 2.370 | 0.015 | 0.584 | 0.052 | 0.48 | 5.0 | 16.8 | ||
| 61 | 4.10 | 0.06 | 1.74 | 0.90 | 0.51 | 5.825 | 0.015 | -1.132 | 0.006 | 0.47 | 8.2 | 44.4 | ||
| 62 | 3.93 | 0.03 | 3.69 | 1.24 | 0.09 | 5.758 | 0.004 | -3.184 | 0.003 | 0.52 | 74.5 | 550.5 | 58 | |
| 63 | 3.73 | 0.03 | 3.04 | 1.13 | 0.12 | 5.465 | 0.003 | -1.864 | 0.009 | 0.54 | 19.9 | 131.5 | ||
| 64 | 3.68 | 0.02 | 1.96 | 0.57 | 0.09 | 6.222 | 0.005 | -3.250 | 0.012 | 0.47 | 28.2 | 112.3 | ||
| 65 | 3.50 | 0.05 | 2.82 | 0.96 | 0.15 | 2.026 | 0.011 | 0.476 | 0.011 | 0.63 | 19.9 | 114.2 | 57 | 56 |
| 66 | 3.47 | 0.05 | 3.26 | 1.00 | 0.16 | 1.786 | 0.011 | 0.439 | 0.009 | 0.55 | 35.6 | 177.5 | 62 | |
| 67 | 3.34 | 0.04 | 1.96 | 0.83 | 0.16 | 0.896 | 0.008 | -0.185 | 0.007 | 0.51 | 12.6 | 61.9 | 61 | |
| 68 | 3.31 | 0.07 | 1.96 | 1.34 | 0.41 | 5.400 | 0.011 | -3.989 | 0.022 | 0.55 | 8.0 | 50.9 | 68 | 64 |
| 69 | 3.29 | 0.06 | 1.09 | 1.44 | 0.67 | 14.045 | 0.012 | -6.473 | 0.014 | 0.52 | 2.6 | 11.3 | ||
| 70 | 3.28 | 0.05 | 1.30 | 0.97 | 0.41 | 0.406 | 0.008 | 5.000 | 0.021 | 0.48 | 4.2 | 17.3 | 65 | 60 |
| 71 | 3.17 | 0.03 | 1.52 | 2.06 | 0.62 | -11.558 | 0.012 | 1.507 | 0.028 | 0.56 | 3.1 | 17.5 | 67 | 61 |
| 72 | 3.05 | 0.02 | 0.87 | 0.24 | 0.16 | -9.136 | 0.005 | 2.954 | 0.010 | 0.45 | 3.1 | 9.1 | ||
| 73 | 2.93 | 0.03 | 1.30 | 0.62 | 0.14 | 5.212 | 0.005 | -0.963 | 0.010 | 0.47 | 7.5 | 27.7 | 70 | |
| 74∗ | 2.62 | 0.03 | 0.87 | 0.43 | 0.30 | -11.922 | 0.008 | 2.225 | 0.019 | 0.42 | 1.3 | 4.3 | ||
| 75 | 2.58 | 0.03 | 1.52 | 0.42 | 0.07 | 0.384 | 0.015 | 0.453 | 0.032 | 0.69 | 4.9 | 21.7 | ||
| 76 | 2.54 | 0.02 | 2.61 | 0.95 | 0.08 | 4.862 | 0.006 | -2.501 | 0.007 | 0.50 | 18.7 | 116.6 | 76 | 62 |
| 77 | 2.45 | 0.04 | 2.17 | 0.66 | 0.10 | 4.317 | 0.010 | -9.857 | 0.015 | 0.58 | 5.9 | 33.3 | 71 | 66 |
| 78∗ | 2.39 | 0.03 | 0.87 | 0.43 | 0.30 | 5.347 | 0.010 | -4.956 | 0.037 | 0.36 | 1.3 | 4.5 | ||
| 79 | 2.31 | 0.05 | 1.30 | 0.66 | 0.38 | -9.234 | 0.008 | 5.303 | 0.016 | 0.55 | 5.9 | 24.7 | 75 | 71 |
| 80 | 2.06 | 0.03 | 1.09 | 1.37 | 0.30 | 5.139 | 0.007 | -1.037 | 0.013 | 0.44 | 3.3 | 12.1 | ||
| 81 | 2.06 | 0.01 | 1.74 | 0.85 | 0.06 | -3.417 | 0.007 | -0.244 | 0.008 | 0.49 | 7.3 | 36.3 | 77 | 74 |
| 82 | 1.91 | 0.03 | 1.96 | 0.85 | 0.17 | -0.002 | 0.007 | 0.601 | 0.021 | 0.64 | 7.2 | 31.9 | 74 | |
| 83 | 1.54 | 0.01 | 1.30 | 0.59 | 0.02 | -7.121 | 0.002 | 3.493 | 0.004 | 0.42 | 8.8 | 29.4 | ||
| 84 | 1.46 | 0.01 | 2.39 | 0.87 | 0.06 | -8.600 | 0.004 | 6.395 | 0.008 | 0.50 | 21.1 | 107.3 | 83 | 78 |
| 85 | 1.38 | 0.01 | 2.39 | 0.82 | 0.11 | 4.738 | 0.007 | -9.977 | 0.009 | 0.48 | 10.5 | 100.1 | 84 | 79 |
| 86 | 1.12 | 0.01 | 1.30 | 0.86 | 0.06 | 6.113 | 0.018 | -9.991 | 0.022 | 0.55 | 3.9 | 17.0 | 88 | 84 |
| 87∗ | 1.03 | 0.03 | 0.87 | 0.43 | 0.30 | 0.081 | 0.015 | -0.666 | 0.044 | 0.38 | 1.1 | 3.0 | ||
| 88 | 0.90 | 0.02 | 1.74 | 1.32 | 0.65 | 3.959 | 0.008 | -5.067 | 0.007 | 0.45 | 10.4 | 49.6 | 91 | 82 |
| 89 | 0.84 | 0.01 | 0.87 | 0.33 | 0.15 | 5.015 | 0.023 | -10.357 | 0.017 | 0.21 | 2.0 | 4.4 | ||
| 90 | 0.74 | 0.04 | 2.82 | 0.94 | 0.14 | 4.981 | 0.002 | -9.771 | 0.004 | 0.45 | 18.9 | 126.6 | 93 | 88 |
| 91∗ | 0.74 | 0.03 | 0.65 | 0.33 | 0.22 | 8.593 | 0.005 | -4.193 | 0.017 | 0.46 | 1.2 | 3.1 | ||
| 92∗ | 0.72 | 0.03 | 0.65 | 0.33 | 0.22 | -7.969 | 0.004 | 1.370 | 0.013 | 0.47 | 2.1 | 5.3 | ||
| 93 | 0.47 | 0.05 | 1.52 | 1.97 | 0.82 | 3.903 | 0.007 | -4.423 | 0.036 | 0.30 | 1.7 | 8.2 | ||
| 94 | 0.46 | 0.05 | 2.17 | 0.61 | 0.13 | 3.626 | 0.010 | -4.652 | 0.010 | 0.68 | 19.9 | 103.5 | 94 | |
| 95∗ | 0.43 | 0.03 | 0.87 | 0.43 | 0.30 | -7.921 | 0.009 | 2.883 | 0.027 | 0.56 | 1.6 | 5.1 | ||
| 96r | 0.07 | 0.01 | 4.78 | 0.96 | 0.02 | 0.000 | 0.002 | 0.000 | 0.005 | 0.48 | 35.6 | 243.2 | 98 | 91 |
| 97 | -0.14 | 0.02 | 1.52 | 0.61 | 0.07 | 4.013 | 0.005 | -5.216 | 0.030 | 0.59 | 4.6 | 31.7 | ||
| 98 | -0.33 | 0.07 | 1.30 | 0.48 | 0.23 | 4.275 | 0.009 | -3.324 | 0.021 | 0.50 | 2.2 | 9.6 | 96 | 89 |
| 99 | -0.52 | 0.03 | 1.52 | 0.57 | 0.11 | 3.509 | 0.014 | -5.435 | 0.024 | 0.58 | 7.2 | 25.0 | ||
| 100∗ | -0.54 | 0.03 | 0.65 | 0.33 | 0.22 | -10.051 | 0.008 | 2.962 | 0.020 | 0.54 | 1.7 | 5.0 | ||
| 101 | -0.60 | 0.03 | 2.61 | 0.83 | 0.09 | 3.197 | 0.011 | -4.776 | 0.012 | 0.58 | 9.4 | 48.7 | ||
| 102 | -0.70 | 0.01 | 1.09 | 0.71 | 0.02 | 4.082 | 0.002 | -10.888 | 0.007 | 0.43 | 3.0 | 11.0 | ||
| 103 | -0.90 | 0.03 | 1.09 | 2.11 | 1.43 | 5.114 | 0.003 | -9.818 | 0.009 | 0.50 | 3.7 | 14.8 | 102 | 95 |
| 104 | -1.22 | 0.01 | 2.82 | 0.79 | 0.02 | -8.239 | 0.004 | 1.805 | 0.010 | 0.49 | 7.8 | 45.9 | 103 | 98 |
| 105 | -1.94 | 0.02 | 1.30 | 1.23 | 0.34 | 1.945 | 0.004 | -18.794 | 0.011 | 0.44 | 2.4 | 10.0 | 107 | 102 |
| 106 | -2.00 | 0.02 | 2.17 | 1.34 | 0.34 | 6.491 | 0.004 | -8.510 | 0.008 | 0.47 | 6.8 | 35.2 | 106 | 100 |
| 107∗ | -2.07 | 0.03 | 0.65 | 0.33 | 0.22 | 4.910 | 0.009 | -7.760 | 0.012 | 0.51 | 1.9 | 5.0 | ||
| 108∗ | -2.94 | 0.03 | 0.65 | 0.33 | 0.22 | 6.326 | 0.005 | -8.597 | 0.019 | 0.46 | 1.1 | 2.9 | ||
| 109 | -3.71 | 0.03 | 1.96 | 0.94 | 0.15 | 2.612 | 0.007 | -4.860 | 0.010 | 0.48 | 8.3 | 41.1 | 108 | 103 |
| 110 | -6.17 | 0.04 | 2.39 | 0.75 | 0.10 | -14.401 | 0.003 | 5.235 | 0.010 | 0.45 | 6.2 | 35.5 | 109 | 104 |
Note. — column (1): ID number; columns (2) and (3): VLSR at the peak of velocity profile and its uncertainty ; column (4): the velocity range across the feature ; columns (5) and (6): the FWHM velocity V and its uncertainty ; columns (7) and (9): the intensity weighted centroid of each feature (); columns (8) and (10): the corresponding uncertainties (); column (11): the angular size of each feature ; column (12): the peak flux density of each feature ; column (13): the integrated flux density of all spots in the feature S; and column (14): the ID numbers of matched features at other two epoches, determined by criteria in section 3.3.
| ID | VLSR | V | x | y | P | S | Match ID | |||||||
|---|---|---|---|---|---|---|---|---|---|---|---|---|---|---|
| (km s-1) | (km s-1) | (km s-1) | (mas) | (mas) | (mas) | (Jy) | (Jy km s-1) | Epoch 1 | 3 | |||||
| (1) | (2) | (3) | (4) | (5) | (6) | (7) | (8) | (9) | (10) | (11) | (12) | (13) | (14) | |
| 1∗ | 17.78 | 0.03 | 1.30 | 0.65 | 0.44 | -1.150 | 0.005 | -15.676 | 0.012 | 0.49 | 1.6 | 7.8 | 2 | |
| 2∗ | 15.96 | 0.03 | 0.65 | 0.33 | 0.22 | -1.827 | 0.009 | -15.747 | 0.024 | 0.48 | 0.9 | 2.5 | ||
| 3 | 14.85 | 0.03 | 1.09 | 0.36 | 0.08 | -0.929 | 0.012 | -18.419 | 0.029 | 0.59 | 1.3 | 6.0 | 8 | |
| 4∗ | 14.00 | 0.03 | 0.65 | 0.33 | 0.22 | -2.117 | 0.010 | -15.698 | 0.028 | 0.55 | 1.1 | 2.9 | ||
| 5 | 13.93 | 0.01 | 1.09 | 0.64 | 0.08 | -0.793 | 0.011 | -18.550 | 0.027 | 0.55 | 1.3 | 6.1 | ||
| 6 | 13.59 | 0.06 | 3.48 | 2.14 | 0.55 | -1.292 | 0.007 | -14.613 | 0.015 | 0.52 | 6.9 | 68.8 | ||
| 7∗ | 12.72 | 0.03 | 0.65 | 0.33 | 0.22 | -1.658 | 0.012 | -14.664 | 0.027 | 0.61 | 1.9 | 5.2 | ||
| 8 | 12.60 | 0.03 | 4.13 | 0.93 | 0.09 | -1.014 | 0.004 | -14.094 | 0.011 | 0.54 | 8.9 | 82.8 | 11 | 5 |
| 9 | 12.60 | 0.06 | 1.74 | 1.20 | 0.64 | -1.047 | 0.005 | -13.455 | 0.008 | 0.24 | 0.9 | 3.2 | ||
| 10 | 12.46 | 0.14 | 1.30 | 1.85 | 0.98 | -2.620 | 0.020 | 0.597 | 0.028 | 0.59 | 5.8 | 19.8 | ||
| 11 | 11.36 | 0.04 | 1.74 | 1.27 | 0.99 | -2.437 | 0.010 | 1.101 | 0.020 | 0.51 | 11.5 | 67.5 | 13 | 7 |
| 12 | 10.83 | 0.03 | 1.09 | 1.59 | 0.50 | -17.282 | 0.007 | -13.148 | 0.023 | 0.52 | 2.1 | 8.2 | 15 | 10 |
| 13 | 10.66 | 0.03 | 1.74 | 0.96 | 0.19 | -2.767 | 0.013 | 1.656 | 0.025 | 0.67 | 10.0 | 48.6 | 17 | |
| 14 | 10.61 | 0.03 | 1.52 | 0.61 | 0.11 | 2.793 | 0.021 | -6.060 | 0.025 | 0.53 | 3.0 | 16.8 | ||
| 15 | 10.28 | 0.04 | 1.74 | 1.55 | 0.92 | -18.665 | 0.015 | -10.742 | 0.047 | 0.61 | 5.9 | 20.2 | ||
| 16 | 9.51 | 0.02 | 1.52 | 0.72 | 0.12 | -2.483 | 0.011 | 2.471 | 0.018 | 0.53 | 14.1 | 76.6 | 19 | 14 |
| 17 | 9.34 | 0.04 | 2.17 | 0.90 | 0.15 | -2.102 | 0.018 | 1.967 | 0.013 | 0.56 | 17.5 | 88.4 | 20 | |
| 18∗ | 9.24 | 0.03 | 0.65 | 0.33 | 0.22 | -18.862 | 0.006 | -9.939 | 0.020 | 0.60 | 2.5 | 6.9 | ||
| 19 | 9.22 | 0.01 | 0.87 | 0.61 | 0.14 | -18.715 | 0.019 | -11.049 | 0.028 | 0.62 | 3.8 | 13.1 | ||
| 20 | 9.08 | 0.01 | 1.30 | 0.61 | 0.01 | -0.834 | 0.002 | 3.511 | 0.008 | 0.51 | 15.2 | 53.8 | 21 | 18 |
| 21 | 8.37 | 0.07 | 1.74 | 0.82 | 0.35 | -1.894 | 0.006 | 3.247 | 0.018 | 0.33 | 2.3 | 8.6 | ||
| 22 | 8.33 | 0.02 | 1.52 | 0.95 | 0.07 | -1.739 | 0.008 | 2.491 | 0.009 | 0.51 | 14.1 | 58.7 | 30 | |
| 23 | 8.22 | 0.05 | 1.52 | 0.46 | 0.14 | -1.512 | 0.013 | 3.924 | 0.019 | 0.64 | 5.1 | 20.8 | 23 | |
| 24 | 8.03 | 0.02 | 1.74 | 0.95 | 0.21 | -18.650 | 0.015 | -10.414 | 0.010 | 0.51 | 5.0 | 27.2 | 25 | |
| 25 | 8.00 | 0.02 | 2.61 | 0.95 | 0.08 | -1.947 | 0.006 | 3.832 | 0.007 | 0.49 | 13.0 | 80.3 | 29 | 25 |
| 26∗ | 7.79 | 0.03 | 1.09 | 0.54 | 0.37 | -19.068 | 0.005 | -10.307 | 0.021 | 0.45 | 2.4 | 7.1 | 28 | 28 |
| 27 | 7.68 | 0.02 | 2.39 | 1.30 | 0.22 | -18.945 | 0.005 | -11.610 | 0.014 | 0.56 | 7.4 | 50.0 | 24 | 26 |
| 28∗ | 7.49 | 0.03 | 0.65 | 0.33 | 0.22 | -18.954 | 0.012 | -12.280 | 0.009 | 0.33 | 0.6 | 1.7 | ||
| 29 | 7.40 | 0.01 | 1.09 | 0.57 | 0.03 | -18.938 | 0.052 | -11.020 | 0.028 | 0.48 | 2.1 | 5.8 | ||
| 30∗ | 7.34 | 0.03 | 1.30 | 0.65 | 0.44 | -0.645 | 0.006 | 2.829 | 0.011 | 0.51 | 3.4 | 15.1 | 33 | 30 |
| 31∗ | 6.81 | 0.03 | 1.30 | 0.65 | 0.44 | -19.467 | 0.007 | -11.494 | 0.022 | 0.55 | 3.3 | 15.0 | 34 | 31 |
| 32 | 6.66 | 0.03 | 1.96 | 0.66 | 0.10 | -6.440 | 0.003 | 5.700 | 0.005 | 0.44 | 11.2 | 52.9 | 35 | 32 |
| 33∗ | 6.63 | 0.03 | 0.65 | 0.33 | 0.22 | -6.361 | 0.004 | 5.129 | 0.006 | 0.20 | 0.4 | 1.1 | ||
| 34 | 6.43 | 0.03 | 1.09 | 0.61 | 0.19 | -0.854 | 0.008 | 2.780 | 0.025 | 0.58 | 5.6 | 17.0 | 37 | |
| 35 | 6.37 | 0.02 | 1.74 | 0.70 | 0.07 | -21.551 | 0.003 | -7.459 | 0.009 | 0.45 | 5.6 | 24.8 | 40 | 33 |
| 36 | 6.23 | 0.05 | 0.87 | 0.46 | 0.21 | -6.116 | 0.007 | 6.167 | 0.019 | 0.50 | 2.0 | 6.6 | ||
| 37 | 6.21 | 0.07 | 3.04 | 1.14 | 0.25 | 0.424 | 0.002 | 5.899 | 0.006 | 0.44 | 19.1 | 158.9 | 41 | 36 |
| 38 | 6.21 | 0.02 | 1.30 | 0.79 | 0.20 | -1.286 | 0.006 | 5.333 | 0.017 | 0.52 | 7.6 | 32.4 | 42 | 38 |
| 39 | 5.58 | 0.04 | 1.30 | 0.26 | 0.10 | 3.492 | 0.015 | -0.133 | 0.025 | 0.61 | 7.2 | 16.5 | 45 | |
| 40 | 5.54 | 0.01 | 3.26 | 1.25 | 0.05 | -6.976 | 0.002 | 5.043 | 0.004 | 0.45 | 56.0 | 381.9 | 47 | 40 |
| 41 | 5.53 | 0.01 | 1.09 | 0.65 | 0.13 | 5.167 | 0.008 | -1.416 | 0.021 | 0.47 | 7.3 | 21.6 | ||
| 42 | 5.32 | 0.06 | 1.96 | 0.62 | 0.16 | 3.166 | 0.006 | 0.938 | 0.017 | 0.56 | 7.5 | 40.5 | 50 | 42 |
| 43∗ | 5.30 | 0.03 | 0.65 | 0.33 | 0.22 | 5.521 | 0.004 | -2.062 | 0.036 | 0.63 | 4.2 | 8.0 | ||
| 44 | 5.26 | 0.03 | 1.52 | 0.73 | 0.22 | -0.651 | 0.008 | 3.347 | 0.019 | 0.51 | 4.3 | 23.8 | 53 | 41 |
| 45 | 5.26 | 0.04 | 1.30 | 0.53 | 0.18 | -0.419 | 0.019 | 5.212 | 0.025 | 0.64 | 5.8 | 26.5 | 49 | 43 |
| 46∗ | 5.12 | 0.03 | 0.87 | 0.43 | 0.30 | 6.324 | 0.008 | -1.470 | 0.019 | 0.56 | 3.3 | 8.1 | 51 | |
| 47∗ | 5.11 | 0.03 | 0.65 | 0.33 | 0.22 | 1.289 | 0.006 | -0.340 | 0.022 | 0.60 | 2.3 | 5.7 | ||
| 48 | 5.11 | 0.01 | 1.09 | 0.57 | 0.07 | 5.578 | 0.008 | 0.005 | 0.014 | 0.56 | 3.4 | 12.4 | ||
| 49 | 4.89 | 0.03 | 1.09 | 0.42 | 0.01 | 1.665 | 0.013 | 0.062 | 0.016 | 0.62 | 10.6 | 28.4 | 54 | 51 |
| 50∗ | 4.83 | 0.03 | 0.87 | 0.43 | 0.30 | 3.547 | 0.019 | 0.053 | 0.033 | 1.07 | 8.2 | 19.5 | ||
| 51∗ | 4.65 | 0.03 | 0.87 | 0.43 | 0.30 | 2.120 | 0.066 | 0.800 | 0.067 | 0.68 | 4.1 | 7.7 | ||
| 52 | 4.65 | 0.02 | 1.52 | 0.38 | 0.05 | 4.005 | 0.008 | 0.071 | 0.015 | 0.51 | 9.0 | 35.7 | 55 | 48 |
| 53 | 4.60 | 0.02 | 1.74 | 0.56 | 0.05 | 6.033 | 0.007 | -1.326 | 0.011 | 0.63 | 21.9 | 76.0 | 59 | 53 |
| 54 | 4.40 | 0.01 | 0.87 | 0.27 | 0.04 | 1.777 | 0.007 | -0.276 | 0.042 | 0.47 | 2.1 | 5.8 | ||
| 55∗ | 3.96 | 0.03 | 1.30 | 0.65 | 0.44 | 5.789 | 0.035 | -3.921 | 0.054 | 0.40 | 1.3 | 4.2 | ||
| 56 | 3.93 | 0.05 | 1.52 | 1.12 | 0.90 | 1.432 | 0.005 | 0.359 | 0.007 | 0.49 | 10.6 | 46.0 | ||
| 57 | 3.90 | 0.03 | 1.52 | 0.46 | 0.09 | 2.151 | 0.005 | 0.416 | 0.021 | 0.60 | 15.0 | 59.5 | 65 | 56 |
| 58∗ | 3.59 | 0.03 | 0.65 | 0.33 | 0.22 | 5.700 | 0.004 | -3.202 | 0.038 | 0.53 | 14.2 | 25.8 | 62 | |
| 59 | 3.52 | 0.02 | 1.74 | 0.32 | 0.06 | 5.431 | 0.004 | -1.619 | 0.016 | 0.55 | 18.6 | 74.0 | ||
| 60∗ | 3.51 | 0.03 | 1.09 | 0.54 | 0.37 | 2.198 | 0.008 | -0.150 | 0.038 | 0.59 | 3.9 | 6.0 | ||
| 61∗ | 3.49 | 0.03 | 0.87 | 0.43 | 0.30 | 0.993 | 0.015 | -0.072 | 0.025 | 0.58 | 2.1 | 3.8 | 67 | |
| 62 | 3.43 | 0.03 | 1.30 | 0.66 | 0.10 | 1.825 | 0.022 | 0.472 | 0.008 | 0.62 | 23.1 | 74.7 | 66 | |
| 63 | 3.39 | 0.04 | 3.48 | 1.76 | 0.24 | 5.914 | 0.011 | -3.121 | 0.007 | 0.63 | 56.1 | 441.6 | ||
| 64∗ | 3.23 | 0.03 | 0.87 | 0.43 | 0.30 | 0.547 | 0.017 | -0.370 | 0.024 | 0.62 | 3.5 | 7.2 | ||
| 65 | 3.22 | 0.01 | 1.09 | 0.50 | 0.04 | 0.380 | 0.004 | 5.093 | 0.012 | 0.47 | 3.9 | 13.4 | 70 | 60 |
| 66 | 2.97 | 0.01 | 1.09 | 0.46 | 0.03 | 5.153 | 0.007 | -2.083 | 0.025 | 0.56 | 13.6 | 37.8 | ||
| 67 | 2.93 | 0.02 | 1.30 | 0.67 | 0.12 | -11.555 | 0.008 | 1.372 | 0.013 | 0.53 | 3.9 | 17.6 | 71 | 61 |
| 68 | 2.86 | 0.01 | 1.52 | 0.77 | 0.06 | 5.277 | 0.005 | -3.978 | 0.017 | 0.52 | 5.4 | 31.5 | 68 | 64 |
| 69 | 2.84 | 0.02 | 1.30 | 0.44 | 0.07 | 1.923 | 0.020 | 0.395 | 0.017 | 0.66 | 12.2 | 35.3 | ||
| 70 | 2.79 | 0.03 | 1.96 | 0.91 | 0.20 | 5.183 | 0.004 | -1.006 | 0.007 | 0.49 | 11.0 | 56.2 | 73 | |
| 71∗ | 2.75 | 0.03 | 1.30 | 0.65 | 0.44 | 4.422 | 0.009 | -9.763 | 0.008 | 0.54 | 6.4 | 29.1 | 77 | 66 |
| 72 | 2.63 | 0.01 | 1.09 | 0.22 | 0.01 | -0.220 | 0.007 | -0.402 | 0.016 | 0.57 | 4.3 | 11.5 | ||
| 73 | 2.59 | 0.04 | 1.09 | 0.65 | 0.41 | -7.691 | 0.004 | 6.941 | 0.012 | 0.47 | 2.6 | 10.3 | ||
| 74 | 2.33 | 0.01 | 1.30 | 1.55 | 0.19 | -0.077 | 0.007 | 0.559 | 0.020 | 0.65 | 4.2 | 14.8 | 82 | |
| 75 | 2.32 | 0.01 | 1.09 | 1.32 | 1.79 | -9.318 | 0.006 | 5.233 | 0.020 | 0.59 | 3.7 | 14.0 | 79 | 71 |
| 76 | 2.26 | 0.06 | 2.17 | 0.91 | 0.25 | 4.755 | 0.003 | -2.500 | 0.009 | 0.50 | 10.2 | 51.5 | 76 | 62 |
| 77 | 2.08 | 0.02 | 1.74 | 0.62 | 0.06 | -3.385 | 0.004 | -0.186 | 0.004 | 0.45 | 16.7 | 65.8 | 81 | 74 |
| 78 | 2.02 | 0.03 | 0.87 | 0.26 | 0.18 | -9.049 | 0.008 | 5.693 | 0.027 | 0.67 | 3.0 | 7.8 | ||
| 79∗ | 1.77 | 0.03 | 0.87 | 0.43 | 0.30 | -8.574 | 0.005 | 5.706 | 0.018 | 0.21 | 0.6 | 2.1 | ||
| 80 | 1.61 | 0.03 | 0.87 | 0.33 | 0.22 | -3.717 | 0.020 | 1.073 | 0.037 | 0.59 | 2.9 | 9.9 | ||
| 81 | 1.60 | 0.04 | 1.09 | 0.51 | 0.30 | -9.622 | 0.004 | 4.514 | 0.012 | 0.44 | 1.9 | 8.1 | ||
| 82∗ | 1.53 | 0.03 | 0.87 | 0.43 | 0.30 | -8.571 | 0.017 | 6.949 | 0.024 | 0.42 | 2.7 | 6.2 | ||
| 83 | 1.49 | 0.02 | 2.17 | 0.89 | 0.09 | -8.643 | 0.002 | 6.317 | 0.004 | 0.49 | 26.6 | 127.8 | 84 | 78 |
| 84 | 1.32 | 0.02 | 1.09 | 1.61 | 3.57 | 4.748 | 0.006 | -9.974 | 0.008 | 0.50 | 10.9 | 41.3 | 85 | 79 |
| 85∗ | 1.21 | 0.03 | 0.65 | 0.33 | 0.22 | 0.591 | 0.011 | 0.287 | 0.020 | 0.52 | 2.0 | 5.8 | ||
| 86 | 1.20 | 0.01 | 0.87 | 0.40 | 0.04 | 4.802 | 0.008 | -5.389 | 0.028 | 0.52 | 2.3 | 7.9 | ||
| 87∗ | 1.17 | 0.03 | 0.65 | 0.33 | 0.22 | 4.922 | 0.010 | -9.204 | 0.009 | 0.21 | 0.5 | 1.4 | ||
| 88 | 1.04 | 0.06 | 1.30 | 0.72 | 0.35 | 6.219 | 0.005 | -10.002 | 0.013 | 0.50 | 3.2 | 12.2 | 86 | 84 |
| 89 | 0.96 | 0.03 | 1.09 | 0.51 | 0.12 | 5.990 | 0.016 | -10.074 | 0.023 | 0.48 | 2.6 | 9.4 | ||
| 90∗ | 0.76 | 0.03 | 0.65 | 0.33 | 0.22 | -7.961 | 0.051 | 7.123 | 0.022 | 0.58 | 3.0 | 8.2 | ||
| 91 | 0.65 | 0.03 | 2.82 | 0.95 | 0.09 | 3.928 | 0.004 | -5.107 | 0.010 | 0.50 | 14.4 | 120.9 | 88 | 82 |
| 92∗ | 0.61 | 0.03 | 0.65 | 0.33 | 0.22 | -8.511 | 0.011 | 6.655 | 0.011 | 0.50 | 3.9 | 7.9 | ||
| 93 | 0.58 | 0.03 | 1.96 | 0.94 | 0.17 | 5.000 | 0.004 | -9.749 | 0.004 | 0.52 | 16.3 | 87.5 | 90 | 88 |
| 94∗ | 0.53 | 0.03 | 1.09 | 0.54 | 0.37 | 3.803 | 0.006 | -4.631 | 0.060 | 0.67 | 8.2 | 10.9 | 94 | |
| 95 | 0.51 | 0.06 | 1.52 | 1.92 | 0.92 | 3.502 | 0.011 | -4.979 | 0.017 | 0.53 | 10.7 | 54.8 | ||
| 96 | 0.37 | 0.14 | 1.30 | 0.74 | 0.46 | 4.263 | 0.005 | -3.463 | 0.018 | 0.49 | 3.4 | 13.4 | 98 | 89 |
| 97∗ | 0.34 | 0.03 | 0.65 | 0.33 | 0.22 | 0.004 | 0.009 | -2.021 | 0.024 | 0.52 | 1.8 | 4.8 | ||
| 98r | -0.01 | 0.01 | 3.04 | 0.69 | 0.01 | 0.000 | 0.001 | 0.000 | 0.003 | 0.45 | 66.7 | 292.8 | 96 | 91 |
| 99∗ | -0.12 | 0.03 | 0.87 | 0.43 | 0.30 | 4.364 | 0.017 | -3.247 | 0.024 | 0.54 | 1.8 | 4.8 | ||
| 100∗ | -0.21 | 0.03 | 1.30 | 0.65 | 0.44 | 0.068 | 0.029 | -0.535 | 0.012 | 0.31 | 2.3 | 5.0 | ||
| 101 | -0.74 | 0.03 | 0.87 | 0.37 | 0.08 | -8.951 | 0.006 | 3.190 | 0.017 | 0.49 | 1.6 | 5.2 | ||
| 102 | -0.79 | 0.03 | 1.74 | 1.07 | 0.36 | 5.102 | 0.002 | -9.821 | 0.006 | 0.48 | 10.7 | 51.5 | 103 | 95 |
| 103 | -1.23 | 0.07 | 2.17 | 0.77 | 0.21 | -8.289 | 0.005 | 1.792 | 0.011 | 0.52 | 4.3 | 26.2 | 104 | 98 |
| 104 | -1.26 | 0.02 | 1.30 | 1.00 | 0.54 | -7.949 | 0.006 | 2.980 | 0.015 | 0.48 | 2.0 | 9.5 | ||
| 105∗ | -1.85 | 0.03 | 0.65 | 0.33 | 0.22 | 1.513 | 0.005 | -17.936 | 0.014 | 0.46 | 1.3 | 3.3 | ||
| 106 | -1.87 | 0.02 | 2.17 | 0.84 | 0.07 | 6.518 | 0.004 | -8.514 | 0.007 | 0.45 | 6.3 | 34.8 | 106 | 100 |
| 107 | -2.31 | 0.03 | 1.09 | 0.48 | 0.21 | 1.943 | 0.003 | -18.748 | 0.008 | 0.44 | 2.7 | 9.4 | 105 | 102 |
| 108 | -3.76 | 0.05 | 2.17 | 1.21 | 0.30 | 2.643 | 0.006 | -4.849 | 0.007 | 0.50 | 7.6 | 50.4 | 109 | 103 |
| 109 | -5.99 | 0.02 | 1.96 | 0.66 | 0.04 | -14.404 | 0.004 | 5.277 | 0.014 | 0.48 | 3.1 | 17.0 | 110 | 104 |
| 110 | -6.92 | 0.01 | 1.09 | 0.46 | 0.12 | -14.811 | 0.005 | 5.100 | 0.013 | 0.46 | 1.3 | 7.2 | ||
Note. — The representations of columns (1)-(14) are the same as Table 2.
| ID | VLSR | V | x | y | P | S | Match ID | |||||||
|---|---|---|---|---|---|---|---|---|---|---|---|---|---|---|
| (km s-1) | (km s-1) | (km s-1) | (mas) | (mas) | (mas) | (Jy) | (Jy km s-1) | Epoch 1 | 2 | |||||
| (1) | (2) | (3) | (4) | (5) | (6) | (7) | (8) | (9) | (10) | (11) | (12) | (13) | (14) | |
| 1∗ | 14.34 | 0.03 | 0.87 | 0.43 | 0.30 | -1.155 | 0.006 | -14.441 | 0.024 | 0.71 | 4.5 | 15.0 | ||
| 2∗ | 14.33 | 0.03 | 0.87 | 0.43 | 0.30 | -0.799 | 0.009 | -18.578 | 0.025 | 0.53 | 1.6 | 5.6 | ||
| 3∗ | 13.36 | 0.03 | 0.65 | 0.33 | 0.22 | -1.081 | 0.009 | -13.426 | 0.029 | 0.34 | 0.9 | 2.3 | ||
| 4 | 12.96 | 0.02 | 1.96 | 1.28 | 0.14 | -1.271 | 0.003 | -14.575 | 0.010 | 0.46 | 6.5 | 40.2 | ||
| 5 | 12.86 | 0.03 | 2.61 | 1.64 | 0.39 | -1.027 | 0.003 | -14.067 | 0.009 | 0.48 | 8.2 | 60.5 | 11 | 8 |
| 6∗ | 12.64 | 0.03 | 0.65 | 0.33 | 0.22 | -2.708 | 0.031 | 0.607 | 0.015 | 0.54 | 4.3 | 12.4 | ||
| 7 | 11.24 | 0.02 | 2.17 | 0.70 | 0.06 | -2.494 | 0.011 | 1.141 | 0.019 | 0.51 | 11.4 | 78.7 | 13 | 11 |
| 8∗ | 11.19 | 0.03 | 0.87 | 0.43 | 0.30 | -2.481 | 0.013 | 1.679 | 0.009 | 0.15 | 0.8 | 2.3 | ||
| 9 | 10.91 | 0.03 | 1.09 | 0.45 | 0.15 | -2.832 | 0.008 | 1.797 | 0.028 | 0.47 | 8.1 | 25.2 | ||
| 10∗ | 10.73 | 0.03 | 0.65 | 0.33 | 0.22 | -17.251 | 0.006 | -13.271 | 0.023 | 0.51 | 1.8 | 4.8 | 15 | 12 |
| 11 | 10.60 | 0.03 | 1.09 | 0.43 | 0.11 | 2.732 | 0.024 | -6.018 | 0.026 | 0.52 | 2.2 | 8.8 | ||
| 12∗ | 10.02 | 0.03 | 1.09 | 0.54 | 0.37 | -18.617 | 0.013 | -10.822 | 0.030 | 0.56 | 2.8 | 9.1 | ||
| 13 | 9.94 | 0.02 | 1.52 | 0.45 | 0.05 | -2.408 | 0.007 | 1.695 | 0.015 | 0.48 | 13.2 | 38.7 | ||
| 14 | 9.65 | 0.01 | 1.52 | 0.74 | 0.06 | -2.500 | 0.014 | 2.480 | 0.018 | 0.53 | 16.4 | 75.4 | 19 | 16 |
| 15 | 9.58 | 0.03 | 0.87 | 0.63 | 0.43 | -2.434 | 0.010 | 1.846 | 0.021 | 0.22 | 2.1 | 3.9 | ||
| 16 | 9.33 | 0.03 | 0.87 | 0.13 | 0.09 | -18.876 | 0.009 | -9.876 | 0.023 | 0.60 | 3.0 | 10.8 | ||
| 17 | 9.20 | 0.01 | 1.09 | 0.69 | 0.10 | -1.998 | 0.016 | 2.068 | 0.029 | 0.49 | 18.0 | 56.8 | ||
| 18 | 9.11 | 0.01 | 1.30 | 0.60 | 0.06 | -0.848 | 0.002 | 3.495 | 0.010 | 0.49 | 14.4 | 49.8 | 21 | 20 |
| 19 | 9.08 | 0.02 | 0.87 | 0.26 | 0.07 | -0.898 | 0.006 | 4.148 | 0.009 | 0.31 | 1.1 | 3.2 | ||
| 20∗ | 8.88 | 0.03 | 0.87 | 0.43 | 0.30 | -18.756 | 0.006 | -11.103 | 0.022 | 0.62 | 4.3 | 10.8 | ||
| 21 | 8.35 | 0.02 | 1.96 | 0.88 | 0.11 | -1.771 | 0.008 | 2.488 | 0.018 | 0.55 | 13.3 | 61.0 | ||
| 22 | 8.35 | 0.01 | 1.74 | 0.56 | 0.04 | -1.557 | 0.013 | 3.762 | 0.019 | 1.11 | 12.1 | 42.8 | ||
| 23∗ | 8.33 | 0.03 | 1.09 | 0.54 | 0.37 | -1.920 | 0.009 | 3.195 | 0.023 | 0.30 | 1.7 | 5.9 | ||
| 24 | 8.20 | 0.03 | 1.09 | 0.48 | 0.32 | -19.002 | 0.024 | -12.257 | 0.023 | 0.32 | 0.6 | 2.2 | ||
| 25 | 8.05 | 0.02 | 2.82 | 1.15 | 0.10 | -1.969 | 0.006 | 3.797 | 0.011 | 0.50 | 11.3 | 74.8 | 29 | 25 |
| 26 | 7.96 | 0.06 | 3.26 | 1.24 | 0.26 | -18.931 | 0.005 | -11.600 | 0.015 | 0.50 | 6.2 | 51.6 | 24 | 27 |
| 27 | 7.92 | 0.01 | 1.52 | 0.65 | 0.05 | -18.575 | 0.004 | -10.408 | 0.009 | 0.43 | 3.2 | 20.0 | ||
| 28 | 7.74 | 0.03 | 1.09 | 1.28 | 4.72 | -19.056 | 0.005 | -10.322 | 0.020 | 0.48 | 2.8 | 10.8 | 28 | 26 |
| 29∗ | 7.29 | 0.03 | 0.65 | 0.33 | 0.22 | -19.071 | 0.016 | -10.997 | 0.030 | 0.42 | 1.6 | 3.3 | ||
| 30 | 6.92 | 0.06 | 1.96 | 0.45 | 0.17 | -0.712 | 0.014 | 2.683 | 0.033 | 0.57 | 4.6 | 14.4 | 33 | 30 |
| 31 | 6.68 | 0.02 | 1.52 | 0.29 | 0.06 | -19.418 | 0.010 | -11.416 | 0.036 | 0.54 | 4.4 | 15.9 | 34 | 31 |
| 32 | 6.65 | 0.01 | 1.74 | 0.73 | 0.06 | -6.451 | 0.003 | 5.673 | 0.006 | 0.41 | 7.8 | 34.8 | 35 | 32 |
| 33 | 6.32 | 0.01 | 1.52 | 0.67 | 0.04 | -21.521 | 0.002 | -7.460 | 0.008 | 0.42 | 6.2 | 27.4 | 40 | 35 |
| 34 | 6.31 | 0.11 | 2.17 | 0.55 | 0.25 | -0.782 | 0.016 | 2.936 | 0.024 | 0.58 | 5.0 | 18.7 | ||
| 35∗ | 6.20 | 0.03 | 0.65 | 0.33 | 0.22 | 0.006 | 0.009 | 5.287 | 0.028 | 0.45 | 1.0 | 2.9 | ||
| 36 | 6.13 | 0.04 | 3.04 | 1.27 | 0.19 | 0.411 | 0.002 | 5.883 | 0.005 | 0.41 | 23.9 | 173.4 | 41 | 37 |
| 37 | 6.11 | 0.04 | 1.52 | 0.37 | 0.11 | -6.156 | 0.005 | 6.260 | 0.015 | 0.48 | 3.7 | 17.3 | ||
| 38 | 5.94 | 0.02 | 1.52 | 0.49 | 0.07 | -1.264 | 0.006 | 5.367 | 0.017 | 0.50 | 7.0 | 26.6 | 42 | 38 |
| 39∗ | 5.61 | 0.03 | 0.87 | 0.43 | 0.30 | 5.160 | 0.003 | -1.382 | 0.016 | 0.48 | 5.1 | 16.3 | ||
| 40 | 5.45 | 0.04 | 3.04 | 1.20 | 0.15 | -6.982 | 0.001 | 5.029 | 0.004 | 0.43 | 44.9 | 310.3 | 47 | 40 |
| 41 | 5.34 | 0.03 | 1.09 | 1.12 | 3.50 | -0.667 | 0.004 | 3.358 | 0.018 | 0.47 | 3.7 | 13.2 | 53 | 44 |
| 42 | 5.22 | 0.03 | 1.96 | 0.95 | 0.11 | 3.189 | 0.008 | 0.917 | 0.018 | 0.56 | 5.3 | 35.0 | 50 | 42 |
| 43 | 5.21 | 0.01 | 1.52 | 0.86 | 0.08 | -0.417 | 0.012 | 5.166 | 0.019 | 0.53 | 6.2 | 29.2 | 49 | 45 |
| 44∗ | 5.10 | 0.03 | 1.09 | 0.54 | 0.37 | 0.457 | 0.005 | 6.084 | 0.015 | 0.51 | 9.4 | 25.9 | ||
| 45 | 5.07 | 0.01 | 1.09 | 1.07 | 0.92 | 5.549 | 0.008 | 0.018 | 0.012 | 0.49 | 3.2 | 12.9 | ||
| 46 | 5.06 | 0.10 | 0.87 | 0.27 | 0.24 | 5.541 | 0.008 | -2.314 | 0.036 | 1.03 | 13.8 | 33.0 | ||
| 47∗ | 5.06 | 0.03 | 0.65 | 0.33 | 0.22 | 5.214 | 0.047 | -1.518 | 0.011 | 0.49 | 3.2 | 5.6 | ||
| 48 | 4.90 | 0.02 | 1.09 | 1.36 | 3.58 | 3.794 | 0.023 | -0.012 | 0.041 | 0.66 | 3.3 | 12.7 | 55 | 52 |
| 49 | 4.88 | 0.01 | 1.52 | 1.72 | 1.32 | 6.223 | 0.007 | -1.330 | 0.017 | 0.46 | 4.8 | 19.4 | ||
| 50∗ | 4.81 | 0.03 | 1.09 | 0.54 | 0.37 | 3.449 | 0.021 | -0.003 | 0.034 | 0.55 | 3.9 | 10.8 | ||
| 51 | 4.80 | 0.11 | 1.09 | 0.41 | 0.41 | 1.791 | 0.008 | -0.127 | 0.027 | 0.50 | 2.0 | 6.2 | 54 | 49 |
| 52 | 4.74 | 0.03 | 1.52 | 0.74 | 0.22 | 4.011 | 0.006 | 0.029 | 0.012 | 0.44 | 5.4 | 27.9 | ||
| 53 | 4.57 | 0.01 | 1.52 | 0.72 | 0.05 | 5.984 | 0.005 | -1.325 | 0.010 | 0.46 | 11.6 | 42.6 | 59 | 53 |
| 54 | 4.22 | 0.03 | 1.74 | 0.54 | 0.08 | 1.446 | 0.012 | 0.308 | 0.014 | 0.48 | 13.8 | 65.0 | ||
| 55∗ | 3.91 | 0.03 | 1.09 | 0.54 | 0.37 | 5.525 | 0.007 | -1.481 | 0.015 | 0.68 | 17.2 | 45.4 | ||
| 56 | 3.89 | 0.06 | 2.39 | 1.58 | 0.85 | 2.153 | 0.009 | 0.544 | 0.013 | 0.51 | 11.9 | 66.0 | 65 | 57 |
| 57 | 3.56 | 0.03 | 0.87 | 0.39 | 0.26 | 5.553 | 0.015 | -3.821 | 0.014 | 0.60 | 4.5 | 12.4 | ||
| 58 | 3.55 | 0.03 | 3.69 | 1.84 | 0.18 | 5.947 | 0.008 | -3.132 | 0.004 | 0.53 | 51.6 | 410.2 | ||
| 59∗ | 3.47 | 0.03 | 0.87 | 0.43 | 0.30 | 2.210 | 0.012 | -0.227 | 0.018 | 0.34 | 1.3 | 3.8 | ||
| 60 | 3.14 | 0.01 | 0.87 | 0.29 | 0.01 | 0.378 | 0.004 | 5.068 | 0.014 | 0.44 | 3.1 | 7.9 | 70 | 65 |
| 61 | 3.01 | 0.01 | 1.30 | 1.42 | 0.93 | -11.580 | 0.007 | 1.435 | 0.016 | 0.50 | 3.0 | 13.9 | 71 | 67 |
| 62∗ | 3.00 | 0.03 | 0.87 | 0.43 | 0.30 | 4.792 | 0.025 | -2.460 | 0.042 | 0.51 | 3.3 | 8.6 | 76 | 76 |
| 63 | 2.78 | 0.01 | 1.96 | 1.18 | 0.13 | 5.125 | 0.005 | -2.129 | 0.017 | 0.49 | 6.6 | 27.3 | ||
| 64 | 2.77 | 0.05 | 1.30 | 2.03 | 1.21 | 5.271 | 0.005 | -4.017 | 0.019 | 0.49 | 3.0 | 13.6 | 68 | 68 |
| 65 | 2.75 | 0.02 | 1.09 | 0.42 | 0.09 | -0.263 | 0.005 | -0.451 | 0.013 | 0.45 | 3.1 | 10.9 | ||
| 66 | 2.71 | 0.06 | 1.30 | 1.10 | 0.85 | 4.368 | 0.005 | -9.760 | 0.008 | 0.53 | 6.5 | 25.8 | 77 | 71 |
| 67 | 2.69 | 0.02 | 1.09 | 0.89 | 1.18 | 5.125 | 0.005 | -0.451 | 0.008 | 0.21 | 0.6 | 2.2 | ||
| 68 | 2.68 | 0.02 | 1.30 | 1.94 | 3.08 | 0.297 | 0.009 | 0.884 | 0.017 | 0.55 | 2.7 | 12.8 | ||
| 69 | 2.42 | 0.07 | 1.52 | 0.50 | 0.20 | -7.687 | 0.005 | 6.960 | 0.014 | 0.44 | 2.8 | 15.4 | ||
| 70∗ | 2.36 | 0.03 | 1.09 | 0.54 | 0.37 | 5.118 | 0.011 | -2.799 | 0.038 | 0.53 | 1.4 | 3.9 | ||
| 71∗ | 2.31 | 0.03 | 0.65 | 0.33 | 0.22 | -9.334 | 0.015 | 5.246 | 0.052 | 0.74 | 3.3 | 8.0 | 79 | 75 |
| 72 | 2.09 | 0.02 | 1.96 | 0.77 | 0.10 | 4.746 | 0.003 | -2.487 | 0.013 | 0.51 | 10.6 | 56.3 | ||
| 73 | 2.09 | 0.03 | 1.30 | 1.90 | 4.34 | -0.111 | 0.007 | 0.554 | 0.015 | 0.52 | 4.0 | 19.2 | ||
| 74 | 2.03 | 0.01 | 1.52 | 0.62 | 0.06 | -3.393 | 0.004 | -0.167 | 0.005 | 0.41 | 13.5 | 49.5 | 81 | 77 |
| 75∗ | 1.99 | 0.03 | 0.87 | 0.43 | 0.30 | -3.553 | 0.019 | 0.563 | 0.047 | 0.35 | 2.0 | 5.6 | ||
| 76 | 1.83 | 0.06 | 1.30 | 0.60 | 0.31 | -9.629 | 0.005 | 4.477 | 0.014 | 0.44 | 1.8 | 8.7 | ||
| 77 | 1.75 | 0.03 | 1.08 | 0.37 | 0.11 | 4.725 | 0.010 | -1.812 | 0.017 | 0.30 | 1.5 | 5.5 | ||
| 78 | 1.40 | 0.01 | 1.95 | 0.95 | 0.11 | -8.638 | 0.003 | 6.337 | 0.004 | 0.48 | 26.0 | 122.6 | 84 | 83 |
| 79 | 1.39 | 0.04 | 1.30 | 1.98 | 6.29 | 4.773 | 0.019 | -9.910 | 0.013 | 0.49 | 9.8 | 45.8 | 85 | 84 |
| 80 | 1.31 | 0.03 | 1.52 | 2.00 | 3.01 | 4.796 | 0.007 | -5.491 | 0.026 | 0.51 | 1.8 | 9.8 | ||
| 81∗ | 1.21 | 0.03 | 0.65 | 0.33 | 0.22 | -3.746 | 0.018 | 1.087 | 0.022 | 0.57 | 2.5 | 5.9 | ||
| 82 | 1.14 | 0.05 | 1.52 | 0.39 | 0.14 | 3.849 | 0.005 | -4.973 | 0.007 | 0.49 | 10.2 | 51.1 | 88 | 91 |
| 83∗ | 0.98 | 0.03 | 0.65 | 0.33 | 0.22 | 3.755 | 0.025 | -4.222 | 0.056 | 0.44 | 2.0 | 4.6 | ||
| 84 | 0.79 | 0.03 | 1.74 | 0.80 | 0.19 | 6.187 | 0.005 | -10.030 | 0.013 | 0.54 | 4.5 | 21.0 | 86 | 88 |
| 85 | 0.74 | 0.01 | 1.09 | 0.49 | 0.02 | 5.954 | 0.021 | -10.164 | 0.024 | 0.48 | 1.2 | 3.5 | ||
| 86 | 0.70 | 0.02 | 1.09 | 0.67 | 0.23 | 3.420 | 0.006 | -5.000 | 0.015 | 0.51 | 3.2 | 13.0 | ||
| 87 | 0.53 | 0.03 | 1.09 | 1.44 | 1.72 | -7.879 | 0.011 | 7.185 | 0.017 | 0.57 | 4.6 | 14.2 | ||
| 88 | 0.48 | 0.02 | 2.17 | 0.91 | 0.07 | 5.020 | 0.005 | -9.761 | 0.006 | 0.52 | 14.2 | 64.7 | 90 | 93 |
| 89 | 0.19 | 0.02 | 2.17 | 1.84 | 0.86 | 4.239 | 0.007 | -3.375 | 0.012 | 0.51 | 4.8 | 32.1 | 98 | 96 |
| 90∗ | -0.04 | 0.03 | 0.87 | 0.43 | 0.30 | 3.652 | 0.011 | -5.212 | 0.034 | 0.71 | 6.9 | 22.5 | ||
| 91r | -0.07 | 0.01 | 2.61 | 0.67 | 0.01 | 0.000 | 0.001 | 0.000 | 0.004 | 0.43 | 51.7 | 219.6 | 96 | 98 |
| 92 | -0.16 | 0.01 | 2.61 | 1.83 | 0.29 | 3.900 | 0.006 | -5.191 | 0.014 | 0.50 | 13.5 | 95.1 | ||
| 93∗ | -0.52 | 0.03 | 1.09 | 0.54 | 0.37 | 5.026 | 0.010 | -9.175 | 0.012 | 0.26 | 0.8 | 3.4 | ||
| 94∗ | -0.56 | 0.03 | 0.65 | 0.33 | 0.22 | -10.277 | 0.007 | 2.154 | 0.017 | 0.44 | 1.2 | 3.3 | ||
| 95 | -0.77 | 0.03 | 1.74 | 0.87 | 0.17 | 5.071 | 0.007 | -9.820 | 0.005 | 0.46 | 9.7 | 46.6 | 103 | 102 |
| 96∗ | -0.80 | 0.03 | 0.65 | 0.33 | 0.22 | 5.165 | 0.009 | -10.461 | 0.020 | 0.23 | 0.5 | 1.2 | ||
| 97 | -0.92 | 0.01 | 1.08 | 0.31 | 0.01 | 7.218 | 0.008 | -10.699 | 0.018 | 0.45 | 2.1 | 7.4 | ||
| 98 | -1.17 | 0.03 | 1.74 | 0.75 | 0.15 | -8.310 | 0.005 | 1.840 | 0.016 | 0.53 | 2.9 | 17.4 | 104 | 103 |
| 99 | -1.30 | 0.03 | 0.87 | 0.14 | 0.09 | -7.956 | 0.004 | 2.987 | 0.010 | 0.45 | 3.0 | 6.9 | ||
| 100 | -1.85 | 0.02 | 1.96 | 0.85 | 0.10 | 6.521 | 0.003 | -8.519 | 0.006 | 0.42 | 6.1 | 32.8 | 106 | 106 |
| 101 | -1.95 | 0.02 | 0.87 | 1.05 | 2.03 | 1.521 | 0.007 | -17.894 | 0.015 | 0.44 | 1.2 | 4.3 | ||
| 102 | -2.32 | 0.01 | 1.09 | 1.27 | 0.22 | 1.936 | 0.004 | -18.712 | 0.010 | 0.41 | 1.9 | 7.5 | 105 | 107 |
| 103 | -3.69 | 0.04 | 1.96 | 1.11 | 0.33 | 2.599 | 0.006 | -4.839 | 0.006 | 0.45 | 8.0 | 48.7 | 109 | 108 |
| 104 | -6.03 | 0.01 | 1.30 | 0.59 | 0.06 | -14.399 | 0.005 | 5.342 | 0.011 | 0.46 | 2.9 | 12.7 | 110 | 109 |
| 105 | -6.89 | 0.03 | 1.30 | 0.80 | 0.42 | -14.811 | 0.004 | 5.139 | 0.010 | 0.42 | 1.9 | 9.0 | ||
Note. — The representations of columns (1)-(14) are the same as Table 2.