Spitzer Number Counts of AGN in the GOODS fields
Abstract
We present mid-infrared observations of active galactic nuclei (AGN) in the Great Observatories Origins Deep Survey (GOODS) fields, performed with the Spitzer Space Telescope. These are the deepest infrared and X-ray fields to date and cover a total area of 0.1 square degrees. AGN are selected on the basis of their hard (2-8 keV) X-ray emission. The median AGN infrared luminosity is at least 10 times larger than the median for normal galaxies with the same redshift distribution, suggesting that the infrared emission is dominated by the central nucleus. The X-ray to infrared luminosity ratios of GOODS AGN, most of which are at 0.51.5, are similar to the values obtained for AGN in the local Universe. The observed infrared flux distribution has an integral slope of 1.5 and there are 1000 sources per square degree brighter than 50 Jy at 3-6 microns. The counts approximately match the predictions of models based on AGN unification, in which the majority of AGN are obscured. This agreement confirms that the faintest X-ray sources, which are dominated by the host galaxy light in the optical, are obscured AGN. Using these Spitzer data, the AGN contribution to the extragalactic infrared background light is calculated by correlating the X-ray and infrared catalogues. This is likely to be a lower limit given that the most obscured AGN are missed in X-rays. We estimate the contribution of AGN missed in X-rays, using a population synthesis model, to be 45% of the observed AGN contribution, making the AGN contribution to the infrared background at most 2-10% in the 3-24 micron range, depending on wavelength, lower than most previous estimates. The AGN contribution to the infrared background remains roughly constant with source flux in the IRAC bands but decreases with decreasing flux in the MIPS 24 m band, where the galaxy population becomes more important.
1 Introduction
Hard X-ray surveys are not strongly affected by dust obscuration and thus provide a relatively unbiased view of the AGN phenomenon. Deep Chandra X-ray surveys have allowed us to test the basic prediction of population synthesis models of the X-ray background, namely, that a combination of obscured and unobscured AGN is needed to explain the X-ray background hard spectral shape (Setti & Woltjer, 1989; Gilli et al., 2001). According to the AGN unification paradigm, obscuration comes from optically thick dust blocking the central engine along some lines of sight. The temperature in this structure, which can range up to 1000 K (dust sublimation temperature), and the roughly isotropic emission toward longer wavelengths should make both obscured and unobscured AGN very bright in the mid-far infrared bands.
This prediction was tested by IRAS (e.g., Rush et al., 1993) and ISO (e.g., Fadda et al., 2002; Matute et al., 2002; Franceschini et al., 2002) observations, which discovered a population of very luminous infrared sources coincident with X-ray emitters and therefore very good candidates to be obscured AGN. With relatively bright flux limits, however, these surveys sample the nearby Universe or extremely luminous, rare AGN. Very deep surveys were possible with ISO (e.g., Fadda et al., 2002), but only over a very small area. With the Spitzer Space Telescope, it is now possible to perform very deep infrared surveys, 100-1000 times deeper than typical IRAS observations, over appreciable areas, 10-1,000 times more area than the deep ISO surveys, thus permitting us, for the first time, to study a representative sample of the AGN population at cosmologically-significant distances.
Since AGN comprise most of the X-ray background and are also very bright infrared sources, it is natural to ask what fraction of the extragalactic infrared background they may contribute. Based on previous observations, the predicted contribution of AGN to the infrared background ranged from 20% (Fabian & Iwasawa, 1999) to just a few percent (Xu et al., 2001), depending mostly on the assumptions for the amount of energy re-radiated in the infrared and the spatial density of obscured AGN. The deeper infrared observations possible with Spitzer are important for understanding the true contribution of AGN to the extragalactic infrared background light.
Multiwavelength observations of a large, uniformly selected sample of moderate-luminosity AGN at cosmologically significant distances provide a complete picture of the AGN emission across the frequency spectrum and establish the total contribution of these sources to the energy budget of the Universe. This is one of the main goals of the Great Observatories Origins Deep Survey (GOODS), a 0.1-square-degree study divided in two fields that overlap with the deepest X-ray observations, the Chandra Deep Fields North (Brandt et al., 2001) and South (Giacconi et al., 2001). It consists of deep imaging in the optical with the Hubble Space Telescope (Giavalisco et al., 2004) and in the infrared with the Spitzer Space Telescope (Dickinson & Giavalisco, 2002). These very deep multiwavelength observations allow a highly complete, relatively unbiased, view of the AGN phenomenon and a test of the AGN unification paradigm, well established in the local Universe, at higher redshifts.
In this paper we present Spitzer observations of the AGN in the GOODS fields, from 3.6 to 24 microns. In § 2 we describe the Spitzer IRAC and MIPS observations. Results and discussion are presented in § 3, addressing the infrared luminosities of AGN and normal galaxies, the X-ray to infrared ratios for GOODS and local AGN, the infrared number counts of AGN, and the AGN contribution to the extragalactic infrared background light. Our conclusions are presented in § 4. Throughout this paper we assume km s -1 Mpc-1, and .
2 Spitzer Data and AGN Sample
The GOODS North and South fields, which cover 160 square arcminutes each, were observed with the Spitzer Space Telescope as part of the GOODS Legacy program (PI: Mark Dickinson). Observations were performed using the IRAC camera (Fazio et al., 2004b) in the four available bands (3.6-8m) and the MIPS instrument (Rieke et al., 2004) in the 24 m band. Exposure times per sky-pixel for each field were 23 hours in the IRAC bands. The MIPS 24-micron observations, available to us only in the GOODS-North field, had an exposure time of 10.3 hours. Individual images were processed through the Spitzer Science Center basic calibrated data pipeline, and then post-processed and combined using customized routines developed by the GOODS team111More details about data reduction can be found at the webpage http://data.spitzer.caltech.edu/popular/goods/Documents/goods_dataproducts.html (M. Dickinson et al., in prep). Sources were detected using SExtractor (Bertin & Arnouts, 1996) on a combined 3.6 and 4.5 m band image filtered using a 55 pixel Gaussian profile with a FWHM of 1.8′′. Photometry was performed using SExtractor. The AUTO magnitude was used since aperture corrections, which we do not apply, would be very small, according to simulations222See the webpage http://www.noao.edu/noao/staff/ecm/simulations.html for more details and calculation of aperture corrections and completeness simulations. (M. Dickinson et al., in prep.). If instead we perform aperture photometry (with an aperture diameter of 4′′) and make the corresponding aperture corrections, which range from 0.3 magnitudes in the 3.6 m band to 0.7 at 8 m then the AUTO and aperture-corrected magnitudes differ by less than 0.2 magnitudes on average, with no obvious dependence on magnitude and no significant outliers. Therefore our results do not depend significantly on the method used to perform the photometry.
The formal , background-limited flux limits for an isolated point source in the four IRAC channels are 0.13, 0.22, 1.45, and 1.61 Jy respectively. In practice, the photometric uncertainty for a given source depends on the degree of crowding in the images, and on the details of how the photometry and source deblending are carried out. This increases the photometric errors, which we evaluate using Monte Carlo simulations of artificial sources added to the real data. According to simulations, all the IRAC images are 90% complete at 14 Jy.
The MIPS 24-m image of the GOODS North field was reduced using a combination of the standard Spitzer Science Center pipeline and customized routines created by the GOODS team (R. Chary et al., in prep.). Photometry was obtained at the IRAC-derived positions using a point spread function fitting technique. The 5 flux limit for the MIPS observations is 25 Jy and are 84% complete at that flux. The relatively large aperture used to calculate fluxes in both the IRAC and MIPS observations means that the light from the AGN and the host galaxy are summed; in any case, given the limited spatial resolution, the two contributions cannot be separated from the infrared imaging alone.
In order to define the AGN sample we start with the X-ray catalogs for the Chandra Deep Fields North and South of Alexander et al. (2003), with the associations to the GOODS HST optical catalog from Bauer et al. (2004) which uses the likelihood method described by Bauer et al. (2000). Specifically, our sample consists of sources detected in the hard (2–8 keV) Chandra band that do not have multiple optical counterparts in the GOODS ACS -band image. Only 3 sources in the South field and 6 in the North have multiple optical counterparts, so excluding these sources from the sample does not bias our results. (We do include sources with no -band counterpart down to the limit 27 mag.) A large fraction of the sample, 60%, have spectroscopic redshifts, obtained by Szokoly et al. (2004) in the South field and by Barger et al. (2003) in the North. Most of the X-ray sources are obscured AGN at moderate redshift, 0.51, and unobscured AGN up to 4. More distant obscured AGN are too faint for optical spectroscopy (Treister et al., 2004). Sources with spectroscopic redshifts and hard X-ray luminosity lower than ergs s-1 are probably not AGN dominated, since the most X-ray luminous star-forming galaxy known, NGC 3256, has a total X-ray luminosity ergs s-1 in the 0.5-10 keV band (Lira et al., 2002); so these were removed from our sample. This criterion removes 12 sources in the South field and 25 in the North. With these constraints, the final sample includes 126 X-ray sources in the GOODS-South field and 179 in the -North field.
In order to look for Spitzer counterparts of the Chandra sources, several search radii were tried, looking to maximize the number of sources with counterparts while keeping a low number of sources with multiple counterparts. The best results were obtained using a search radius of 2′′. Typical astrometric errors are 0.5′′ in X-rays and 0.2′′ in the IRAC bands; therefore, astrometric errors can be safely neglected when using a search radius of 2′′. In the North field 160 sources (90%) have a single IRAC counterpart, while in the south field 118 sources (94%) have a single counterpart; the rest have multiple counterparts. This means that 100% of the X-ray sources are also bright in the near-infrared. Most of the X-ray sources have an infrared counterpart separated by less than 1′′, and in many cases this distance is smaller than 0.5′′, as shown in Fig. 1. Assuming a Poissonian spatial distribution of infrared sources, the median chance of a random association is 0.74% and therefore we have high confidence that the correct infrared counterpart was identified correctly in all but one or two cases. The full catalog of AGN detected in the GOODS field used in this work is presented in the on-line version of the Journal, while for clarity a fraction of the information is presented in Table 1.
Our sample only considers AGN selected based on the X-ray information. Because of this, highly obscured AGN in which most of the X-ray emission is absorbed will be missed in our sample. The effects of this incompleteness are discussed in §4. Recently, AGN selection methods based only on IRAC and MIPS colors (e.g., Sajina et al., 2005) or a combination of Spitzer infrared and radio properties (e.g., Martínez-Sansigre et al., 2005) were presented. In the work of Sajina et al. (2005), AGN are found in the region defined by 0.00.3, 0.20.5, 0.30.7, 0.10.3, 0.30.5 and 0.10.3 using only the IRAC bands (Fig. 8 on Sajina et al., 2005). Although this criterion was defined only for AGN at 1, K corrections are very small so this method can be extended to higher redshifts. Only 79 sources satisfy the AGN criterion of Sajina et al. (2005) in both the GOODS North and South fields. Of these, only 18 (6%) sources are detected in hard X-rays. This means that using this selection method misses a large fraction of the AGN in the field, but it is useful to separate AGN continuum-dominated sources from normal galaxies. This can be explained because a power-law continuum is assumed for the infrared emission in AGN, while it is possible that most sources are dominated by the torus thermal emission in the infrared (Van Duyne et al., in prep).
The selection method of Martínez-Sansigre et al. (2005) is based mostly in radio emission and it is effective to detect luminous obscured quasars. Using the infrared criterion of Martínez-Sansigre et al. (2005) on the GOODS North field, where MIPS data were available, only 3 sources have 300 Jy and 45 Jy and are detected in hard X-rays. Unfortunately, neither spectroscopic nor photometric redshifts are available for those sources, so we cannot (yet) classify them as obscured quasars. The fact that only a small number of sources are selected using this criterion is not surprising since only very luminous sources are found in this way and such sources are very rare and thus not easily detected in narrow-field surveys like GOODS.
3 Results and Discussion
3.1 Infrared Luminosity and Colors
When spectroscopic redshifts were not available, we used photometric redshifts computed by Mobasher et al. (2004) for the South field and Barger et al. (2003) for the North field. Using both spectroscopic and photometric redshifts, we were able to calculate luminosities for 93 sources (74%) in the South field and 105 sources (59%) in the North field. In order to study the quality of photometric redshifts we compared them with spectroscopic redshifts for sources in which both measurements are available. The average value of the quantity (-)/(1+) is 0.02, which indicates that photometric redshifts can be used in a statistical sense to study the properties of a sample of sources. However, errors in the photometric redshifts for individual sources can be large. About 30% of the sources compared here had a difference between photometric and spectroscopic redshift determination greater than 0.3. Therefore, photometric redshifts are used only to calculate statistical properties of a sample, not for individual sources.
The observed-frame luminosity distributions for GOODS AGN in the IRAC 3.6 m and MIPS 24 m bands are shown in Fig. 2. The vast majority of the sources can be classified as moderate-luminosity AGN, in the range 1042 to 1044 ergs s-1. No K correction was attempted. However, from the theoretical AGN SED library of Treister et al. (2004), which spans unobscured to fully obscured AGN over 4 decades in luminosity, we estimate that infrared luminosities in the 3-20 micron range would change by at most a factor of two due to K corrections. This is smaller than the bin size used in these histograms, so we do not expect the figure to change significantly were we able to do accurate K corrections.
For comparison, in Fig. 2 we also show the observed-frame 3.6 and 24 micron luminosity distributions for normal galaxies in the GOODS fields, randomly selected to follow the same redshift distribution as the AGN sample. Redshifts for the normal galaxies were obtained from the spectroscopic surveys of Wirth et al. (2004) and Cowie et al. (2004) in the North field and from the VIMOS VLT Deep Survey (Le Fèvre et al., 2004) in the South field. Comparing the median infrared luminosities of AGN and normal galaxies, AGN are brighter by a factor of 10 in the IRAC bands and 15 in the MIPS 24 m band. There is a fair amount of overlap between the two populations, indicating that for low-luminosity AGN (1042–1043 ergs s-1) the host galaxy can provide a significant contribution and perhaps even dominate the infrared emission. Additionally, the luminosity distribution for sources with hard X-ray luminosity lower than 1042 ergs s-1 (and thus removed from our AGN sample) is also shown in Fig. 2. These sources have a luminosity distribution similar to that of normal galaxies and therefore we conclude that the X-ray emission in those sources is not from AGN origin and most likely from star-formation activity.
In order to understand the relative contributions of infrared emission from active nucleus and galaxy, we performed a simple simulation in which we randomly paired a normal galaxy from the redshift-equivalent distribution (infrared emission from stars only) to each AGN in the sample (infrared emission from stars plus active nucleus). We then calculated the distribution of the ratio of galaxy to nuclear light, assuming the assigned galaxy correctly represented the emission from the host galaxy. This process was repeated 150 times with different random pairings. If indeed these normal galaxies correctly represent the host galaxy emission, which is of course uncertain but which is certainly true at optical wavelengths (e.g., Urry et al., 1999; Dunlop et al., 2003), the ensuing distribution indicates the relative importance of the two components. The results of a set of these simulations are shown in Fig. 3 for the 8 and 24 micron bands. We find that at 8 m, % of the sample is dominated by the AGN (i.e., the luminosity of the active nucleus is greater than the galaxy luminosity). Separating the sample in three luminosity bins, each with equal numbers of AGN, we find that for total AGN luminosities below ergs s-1, roughly 3/4 of the sample is AGN-dominated. For ergs s-1, the fraction of AGN-dominated sources is roughly 90%, and for higher luminosities it rises to 97%. At shorter wavelengths and at 24 m, the fractions are similar. At 24 m, 80% of the sources are AGN-dominated in the lowest luminosity bin and 90% at the highest luminosities. Of course, because of the limited spatial resolution, we cannot say from the infrared data alone whether the AGN host galaxies are similar to normal galaxies in the same redshift range. Given the similarity of the optical properties, however, it would require a fairly contrived scenario to have the infrared properties be massively mismatched. The correlation of infrared and X-ray flux (next Section) also supports the idea that the infrared emission from AGN is dominated by the active nucleus.
3.2 X-ray to Infrared Ratios
In Fig. 4 we show the ratio of hard X-ray (2–8 keV) to infrared (8 m) luminosity versus hard X-ray and infrared luminosity for GOODS AGN with spectroscopic redshifts and thus reliable luminosities. Using the X-ray spectrum to separate obscured and unobscured AGN (the separation was set at =1022 cm-2, with inferred from the X-ray hardness ratio, assuming an intrinsic photon slope of =1.7), we find no differences between the two classes of AGN (filled and open triangles in Fig. 4). This is consistent with the AGN unification paradigm since both hard X-ray and infrared emission are relatively isotropic and unaffected by the amount of dust in the line of sight. Similar results are found if the 24 micron fluxes are used instead; however, these fluxes are only available for half of our sample and thus we decided to use the 8 micron fluxes.
In order to compare with previously known sources, in Fig. 4 we also show the average observed-frame hard X-ray to infrared luminosity ratio for both local Seyfert 1 and 2 galaxies in three X-ray luminosity bins, from the compilation of Silva et al. (2004). The average ratio for the local sources is 0.100.02 (standard deviation for the sample, including K correction), considering both obscured and unobscured AGN and excluding the top and bottom 10% values of the distribution. For the GOODS sample this ratio is 0.180.12, also excluding the top and bottom 10% values, and there is also no significant difference in the average values for the obscured and unobscured AGN. The average value for the GOODS sample in three X-ray luminosity bins is shown by the open squares in Fig. 4. There is no statistically significant discrepancy between the GOODS and local samples, although there is a hint that the values might diverge at high X-ray luminosity (2 significance). However, it should be noted that Malmquist bias, which would make the average luminosity to appear to be higher at higher redshifts, can play a role in this difference.
The trend for the average ratio of X-ray to infrared luminosity to increase with X-ray luminosity in the GOODS sample can be explained by the contribution of the host galaxy to the infrared light at low luminosities. Assuming that this ratio has a value of 0.35 for the highest luminosity sources, which are clearly AGN-dominated, and adding to the infrared luminosity the contribution from an average host galaxy (estimated from the median 8 m luminosity for our random sample of galaxies, 7.671042 ergs s-1), we were able to reproduce the observed trend of X-ray to infrared luminosity ratio with X-ray luminosity (solid line in Fig. 4).
The spread in the values of the X-ray to infrared luminosity for the GOODS sample can be explained by the combined effects of ignoring the K correction and the intrinsic spread in the luminosity of the host galaxy. Using the AGN spectra library of Treister et al. (2004), we estimate that the K correction can account for variations of % around the mean observed ratio. The dashed lines in Fig. 4 show the effects of a spread in host galaxy luminosity, which is particularly important for low-luminosity AGN and can account for most of the observed spread in the X-ray to infrared luminosity ratio at these luminosities.
Performing a partial correlation analysis we found no significant correlation between the hard X-ray to infrared luminosity ratio and either hard X-ray or infrared luminosity, or with redshift or absorbing column density (). We found only a mildly significant correlation between hard X-ray and infrared luminosities, with a Pearson coefficient of 0.604 and a correlation of similar significance between hard X-ray and infrared fluxes, indicating that the fluxes in these bands are directly related to the luminosity of the central engine. The lack of correlation of the ratio with redshift or luminosity suggests there is little dependence of the emission mechanism on either redshift or luminosity.
3.3 Infrared Counts of AGN
The cumulative distributions of infrared fluxes in the 3.6, 5.7, 8 and 24 micron bands for the GOODS AGN are presented in Fig. 5. The observed counts were corrected to account for the differences in covered area depending on the X-ray flux (since the sample is X-ray selected) based on the relation given by Fig. 5 in Treister et al. (2004), obtained by adapting the sensitivity versus area function for the Chandra Deep Fields of Alexander et al. (2003) to the portion covered by GOODS (D. Alexander and F. Bauer, priv. comm.). No correction for incompleteness in the X-ray or infrared catalogues is necessary as these are almost complete in the flux ranges sampled in the number counts determination. Error bars in these distributions were calculated following the prescription of Gehrels (1986) for 84% confidence levels on the number of sources. The number counts in the 3.6, 4.5 and 5.7 m bands can be well described by a power-law with integral slope 1.50.2 for fluxes higher than 50 Jy from a maximum likelihood analysis of the unbinned data (Crawford et al., 1970). In the 8 m band the integral slope is slightly shallower, 1.20.2, at fluxes higher than 70 Jy, with a density of 1000 AGN per square degree at a depth of 35 Jy. In the MIPS 24 m band the slope is shallower still, 0.90.2, at all the fluxes sampled by the GOODS sources, and there are 1000 AGN per square degree at a flux density of 200 Jy. The resulting best fits are shown in Fig. 5. In order to test the goodness of these fits we performed a K-S test comparing the observed distribution to the fitting function, finding that the null hypothesis (that both distributions are drawn from the same parent distribution) cannot be rejected at confidence levels higher than 40% in all the bands. The values of the K-S probability for each band are 45%, 50%, 75%, 85% and 40% on the 3.6, 4.5, 5.7, 8 and 24 m bands respectively.
In the unification paradigm for AGN, most of the energy absorbed by the circumnuclear optically thick matter is re-emitted at infrared wavelengths. It is not surprising then that AGN are luminous infrared sources, even when the optical, ultraviolet and soft X-ray emission is faint. Population synthesis models for the X-ray background suggest that a substantial fraction of AGN are obscured along the line of sight, thus will be bright only at mid- to far- infrared and hard X-ray wavelengths. For a simple unification model, in which the material is distributed in a torus and the ratio of obscured to unobscured AGN is set to 3:1, as observed in the local Universe (Risaliti et al., 1999), we can calculate the expected infrared counts. Model details are as described in Treister et al. (2004) and modified by Treister & Urry (2005) to include a decrease in the number of obscured AGN with increasing luminosity, with the exception that we no longer interpolate between the near-infrared and optical spectra because this artificially over-predicts the mid-infrared flux.
The obscured-to-unobscured AGN ratio for sources with spectroscopic redshifts (and thus determinations) in our sample is 1.5:1, but this is consistent with the assumed ratio in the model, given that most of the obscured AGN do not have spectroscopic redshift since they are optically faint, and some obscured AGN are even missed in X-rays. Therefore, the observed value of the ratio only represents a lower limit to the intrinsic ratio, which can easily be higher by a factor of two and therefore consistent with the average value assumed in our model.
This simple AGN unification model agrees within a factor of two with the observed distribution in the GOODS fields over the IRAC 3.6-8 micron and MIPS 24 micron bands, as shown in Fig. 5. Compared to the model, which assumes only an elliptical host galaxy, with a single () luminosity and no star formation, and fixed parameters for the dust torus, there are slightly fewer observed AGN at the bright end (100 Jy). The small area of the GOODS survey causes bright AGN to be poorly sampled, hence the large error bars and the marginal significance of the discrepancy. Additionally, it is important to point out that in a cumulative plot the bins are not independent. Wide area surveys like SWIRE (Lonsdale et al., 2003) and the MIPS GTO333More information can be found at the web site http://lully.as.arizona.edu/ programs will provide a better estimate of the AGN counts at the bright end. At the faint end (10 Jy), the observed number of AGN is higher than the model predictions except in the 3.6 m band where there is very good agreement. These discrepancies are 13% at 4 m and rising to 36% at 8 m and 30% at 24 m. These discrepancies may suggest that for fainter AGN, the host galaxy plays a relatively more important role in some AGN, thus making them brighter. At 3.6 m the stellar component in the host galaxy dominates; the good agreement with our simple model means that the host galaxy must be reasonably well represented by our assumed elliptical galaxy with no recent star formation.
3.4 Extragalactic Infrared Background Light
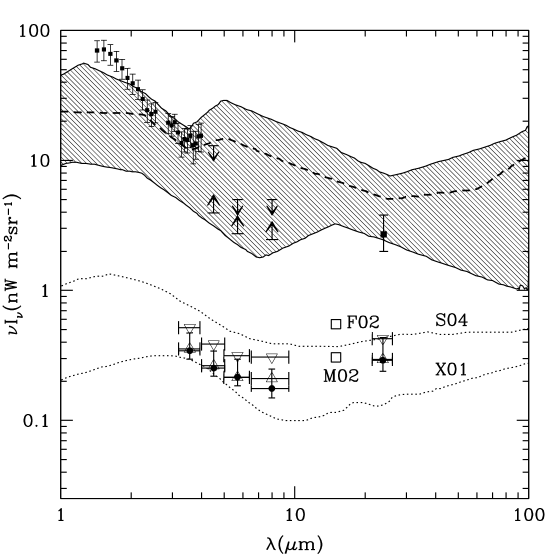
Using the Spitzer data we can estimate the integrated contribution of AGN to the extragalactic infrared background light at IRAC and MIPS wavelengths. A representative lower limit can be obtained simply by summing the infrared emission from the AGN detected in the GOODS fields, weighted by the effective area at that X-ray flux. In Fig. 6, we show the resulting contribution measured from the GOODS sources, compared to the observational limits for the total extragalactic infrared background compiled by Hauser & Dwek (2001; the lower limit is from the integrated extragalactic light, while the upper limit comes from fluctuations analysis) and updated measurements at the IRAC and MIPS 24 m wavelengths (Matsumoto et al., 2005; Fazio et al., 2004a; Kashlinsky et al., 1996; Stanev & Franceschini, 1998; Papovich et al., 2004). AGN and their host galaxies contribute approximately 2.4%, 3.0%, 5.6%, 4.7% in the IRAC 3.6, 4.5, 5.7 and 8 m bands respectively, and 10.7% in the MIPS 24-micron band. (The uncertainties are dominated by the range in the total infrared background light.) These are lower limits to the total AGN contribution, since they exclude the contribution from faint sources below the GOODS X-ray detection limit (including a large expected population of Compton-thick AGN; Treister & Urry, 2005) and from bright sources that are not well sampled in the relatively small GOODS fields. Using our AGN unification model, we can calculate the relative contribution of these X-ray faint sources and add it to the total emission from X-ray detected sources, in order to estimate the total contribution of AGN to the infrared background. We find that sources missed in X-rays can add 45% more flux in the 3–24 micron range, with 30% extra flux coming from obscured AGN that are too faint to be detected in X-rays and the remaining 15% coming from bright sources that are not well sampled in the GOODS fields. Correcting for this factor, the AGN contribution is increased to 3-8% in the IRAC bands and 15% in the MIPS 24-micron band. Given that these values are obtained from the summed emission of AGN and their host galaxies, these are upper limits to the AGN contribution to infrared background, or equivalently, can be seen as the contribution to the infrared background by AGN plus their host galaxies.
We also investigate the flux dependence of the AGN contribution to the integrated infrared emission. This was computed by comparing the total flux from AGN with the integrated flux from all sources for several flux bins. At 3.6 microns the AGN contribution is 2.1% above 600 Jy, rising to 4% above 10 Jy. At 8 microns, the AGN contribution is 6% and remains mostly constant, with a slight increase to 10% at 40 Jy. Only in the MIPS 24 m band do we see a decrease in the AGN contribution with decreasing flux, going from 30% above 1000 Jy to 8% above 100 Jy, as shown in Fig. 7. In other words, at lower fluxes the number of galaxies rises much more steeply than the number of AGN. While this can also mean that many faint AGN are missed by the X-ray selection, in Fig. 7 we use the previously described AGN model to estimate the AGN fraction as a function of infrared flux, correcting for AGN missed by the X-ray selection. As can be seen in Fig. 7, the decrease in the AGN fraction with decreasing infrared flux is still observed, even after correcting for AGN missed in X-rays.
Previous reports of the AGN contribution in general estimated a higher contribution to the integrated emission. Earlier infrared observations with ISO (e.g., Fadda et al., 2002) in the 15-micron band at brighter fluxes give higher values for the AGN contribution (17% at 15m) but depend on large extrapolations to lower fluxes. (The GOODS MIPS observations are 25 times deeper than the ISO data on the Lockman Hole.) Matute et al. (2002) made an estimate based on ISO observations of bright unobscured AGN in the ELAIS S1 field. If, in order to calculate the total AGN contribution from their measured value for unobscured AGN we assume an obscured-to-unobscured ratio of 4:1, their results are consistent with the observed values obtained from the GOODS observations. An estimate based on X-ray samples and an average X-ray-to-infrared ratio by Silva et al. (2004) is 50-80% higher than the values obtained directly from the Spitzer observations. Using a backward evolution model based on IRAS and ISO observations and infrared luminosity functions, the AGN contribution to the infrared background was also calculated by Xu et al. (2001). In this case only an infrared color criterion was used to identify AGN. This prediction is similar to the observed values in the 3.6 and 4.5 m bands but estimates a lower contribution at longer wavelengths, 55% lower at 24 m. A recent study of AGN detected by Chandra using Spitzer performed by Franceschini et al. (2005), reported a value for the AGN contribution to the infrared background of 10%-15% at 24 m in good agreement with our results.
The earlier estimates of the AGN contribution to the integrated extragalactic infrared light are therefore largely consistent with our results; the earlier numbers differ mainly because of large extrapolations to lower fluxes. Summarizing, the more precise values from our deep Chandra and Spitzer observations are 2.4% at 3.6 m, 3.0% at 4.5 m, 5.6% at 5.7 m, 4.7% at 8 m and 10.7% at 24 m. These numbers should be multiplied by a factor of 1.45 in order to account for the contribution by Compton-thick AGN not detected in X-rays by Chandra, namely, 3.5% at 3.6 m, 4.4% at 4.5 m, 8.1% at 5.7 m, 6.8% at 8 m and 15.5% at 24 m.
4 Conclusions
We present here Spitzer observations of the moderate-luminosity, moderate- to high-redshift AGN in the GOODS fields, which include the deepest infrared and X-ray observations to date. In general these sources have similar X-ray to infrared luminosity ratios as AGN in the local Universe. AGN are 10-15 times brighter in the infrared than normal galaxies, although there is some overlap between the luminosity distribution of AGN and normal galaxies, indicating that for low-luminosity AGN the contribution to the infrared light from the host galaxy can be very important and may well dominate the observed emission. This can explain the observed trend of the X-ray-to-infrared luminosity ratio to increase with X-ray luminosity.
We report the observed infrared flux distribution for GOODS AGN, which has a slope of 1.5 to 0.9 for fluxes higher than 100 Jy, with a source density of 1000 AGN per square degree at a depth of 50 Jy in the IRAC bands. Comparing to the expectations of a unification model for AGN, we find reasonable agreement, showing that the basic properties of the moderate to high redshift AGN population are well explained by the same unification paradigm that fits local sources very well, but with a factor of two less dust in the circumnuclear region.
From the Spitzer observations, we calculate the minimum AGN contribution to the extragalactic near-mid infrared background, obtaining a lower value than previously estimated, ranging from 2% to 10% in the 3-24 micron range. Accounting for heavily obscured AGN that are not detected in X-ray, the AGN contribution to the infrared background increases by 45%, to 3-15%.
References
- Alexander et al. (2003) Alexander, D. M., Bauer, F. E., Brandt, W. N., Schneider, D. P., Hornschemeier, A. E., Vignali, C., Barger, A. J., Broos, P. S., Cowie, L. L., Garmire, G. P., Townsley, L. K., Bautz, M. W., Chartas, G., & Sargent, W. L. W. 2003, AJ, 126, 539
- Barger et al. (2003) Barger, A. J., Cowie, L. L., Capak, P., Alexander, D. M., Bauer, F. E., Fernandez, E., Brandt, W. N., Garmire, G. P., & Hornschemeier, A. E. 2003, AJ, 126, 632
- Bauer et al. (2000) Bauer, F. E., Condon, J. J., Thuan, T. X., & Broderick, J. J. 2000, ApJS, 129, 547
- Bauer et al. (2004) Bauer, F. E., Alexander, D. M., Brandt, W. N., Schneider, D. P., Treister, E., Hornschemeier, A. E., & Garmire, G. P. 2004, AJ, 128, 2048
- Bertin & Arnouts (1996) Bertin, E. & Arnouts, S. 1996, A&AS, 117, 393
- Brandt et al. (2001) Brandt, W. N., Alexander, D. M., Hornschemeier, A. E., Garmire, G. P., Schneider, D. P., Barger, A. J., Bauer, F. E., Broos, P. S., Cowie, L. L., Townsley, L. K., Burrows, D. N., Chartas, G., Feigelson, E. D., Griffiths, R. E., Nousek, J. A., & Sargent, W. L. W. 2001, AJ, 122, 2810
- Cowie et al. (2004) Cowie, L. L., Barger, A. J., Hu, E. M., Capak, P., & Songaila, A. 2004, AJ, 127, 3137
- Crawford et al. (1970) Crawford, D. F., Jauncey, D. L., & Murdoch, H. S. 1970, ApJ, 162, 405
- Dickinson & Giavalisco (2002) Dickinson, M. & Giavalisco, M. 2002, in The Mass of Galaxies at Low and High Redshift, in press, astro-ph/0204213
- Dunlop et al. (2003) Dunlop, J. S., McLure, R. J., Kukula, M. J., Baum, S. A., O’Dea, C. P., & Hughes, D. H. 2003, MNRAS, 340, 1095
- Fabian & Iwasawa (1999) Fabian, A. C. & Iwasawa, K. 1999, MNRAS, 303, L34
- Fadda et al. (2002) Fadda, D., Flores, H., Hasinger, G., Franceschini, A., Altieri, B., Cesarsky, C. J., Elbaz, D., & Ferrando, P. 2002, A&A, 383, 838
- Fazio et al. (2004a) Fazio, G. G., Ashby, M. L. N., Barmby, P., Hora, J. L., Huang, J.-S., Pahre, M. A., Wang, Z., Willner, S. P., Arendt, R. G., Moseley, S. H., Brodwin, M., Eisenhardt, P., Stern, D., Tollestrup, E. V., & Wright, E. L. 2004a, ApJS, 154, 39
- Fazio et al. (2004b) Fazio, G. G. et al. 2004b, ApJS, 154, 10
- Franceschini et al. (2002) Franceschini, A., Fadda, D., Cesarsky, C. J., Elbaz, D., Flores, H., & Granato, G. L. 2002, ApJ, 568, 470
- Franceschini et al. (2005) Franceschini, A., Manners, J., Polletta, M. d. C., Lonsdale, C., Gonzalez-Solares, E., Surace, J., Shupe, D., Fang, F., Xu, C. K., Farrah, D., Berta, S., Rodighiero, G., Perez-Fournon, I., Hatziminaoglou, E., Smith, H. E., Siana, B., Rowan-Robinson, M., Nandra, K., Babbedge, T., Vaccari, M., Oliver, S., Wilkes, B., Owen, F., Padgett, D., Frayer, D., Jarrett, T., Masci, F., Stacey, G., Almaini, O., McMahon, R., Johnson, O., Lawrence, A., & Willott, C. 2005, AJ, 129, 2074
- Gehrels (1986) Gehrels, N. 1986, ApJ, 303, 336
- Giacconi et al. (2001) Giacconi, R., Rosati, P., Tozzi, P., Nonino, M., Hasinger, G., Norman, C., Bergeron, J., Borgani, S., Gilli, R., Gilmozzi, R., & Zheng, W. 2001, ApJ, 551, 624
- Giavalisco et al. (2004) Giavalisco, M. et al. 2004, ApJ, 600, L93
- Gilli et al. (2001) Gilli, R., Salvati, M., & Hasinger, G. 2001, A&A, 366, 407
- Hauser & Dwek (2001) Hauser, M. G. & Dwek, E. 2001, ARA&A, 39, 249
- Kashlinsky et al. (1996) Kashlinsky, A., Mather, J. C., & Odenwald, S. 1996, ApJ, 473, L9+
- Le Fèvre et al. (2004) Le Fèvre, O., Vettolani, G., Paltani, S., Tresse, L., Zamorani, G., Le Brun, V., Moreau, C., Bottini, D., Maccagni, D., Picat, J. P., Scaramella, R., Scodeggio, M., Zanichelli, A., Adami, C., Arnouts, S., Bardelli, S., Bolzonella, M., Cappi, A., Charlot, S., Contini, T., Foucaud, S., Franzetti, P., Garilli, B., Gavignaud, I., Guzzo, L., Ilbert, O., Iovino, A., McCracken, H. J., Mancini, D., Marano, B., Marinoni, C., Mathez, G., Mazure, A., Meneux, B., Merighi, R., Pellò, R., Pollo, A., Pozzetti, L., Radovich, M., Zucca, E., Arnaboldi, M., Bondi, M., Bongiorno, A., Busarello, G., Ciliegi, P., Gregorini, L., Mellier, Y., Merluzzi, P., Ripepi, V., & Rizzo, D. 2004, A&A, 428, 1043
- Lira et al. (2002) Lira, P., Ward, M., Zezas, A., Alonso-Herrero, A., & Ueno, S. 2002, MNRAS, 330, 259
- Lonsdale et al. (2003) Lonsdale, C. J., et al. 2003, PASP, 115, 897
- Martínez-Sansigre et al. (2005) Martínez-Sansigre, A., Rawlings, S., Lacy, M., Fadda, D., Marleau, F. R., Simpson, C., Willott, C. J., & Jarvis, M. J. 2005, Nature, 436, 666
- Matsumoto et al. (2005) Matsumoto, T., Matsuura, S., Murakami, H., Tanaka, M., Freund, M., Lim, M., Cohen, M., Kawada, M., & Noda, M. 2005, ApJ, 626, 31
- Matute et al. (2002) Matute, I., La Franca, F., Pozzi, F., Gruppioni, C., Lari, C., Zamorani, G., Alexander, D. M., Danese, L., Oliver, S., Serjeant, S., & Rowan-Robinson, M. 2002, MNRAS, 332, L11
- Mobasher et al. (2004) Mobasher, B., Idzi, R., Benítez, N., Cimatti, A., Cristiani, S., Daddi, E., Dahlen, T., Dickinson, M., Erben, T., Ferguson, H. C., Giavalisco, M., Grogin, N. A., Koekemoer, A. M., Mignoli, M., Moustakas, L. A., Nonino, M., Rosati, P., Schirmer, M., Stern, D., Vanzella, E., Wolf, C., & Zamorani, G. 2004, ApJ, 600, L167
- Papovich et al. (2004) Papovich, C., Dole, H., Egami, E., Le Floc’h, E., Pérez-González, P. G., Alonso-Herrero, A., Bai, L., Beichman, C. A., Blaylock, M., Engelbracht, C. W., Gordon, K. D., Hines, D. C., Misselt, K. A., Morrison, J. E., Mould, J., Muzerolle, J., Neugebauer, G., Richards, P. L., Rieke, G. H., Rieke, M. J., Rigby, J. R., Su, K. Y. L., & Young, E. T. 2004, ApJS, 154, 70
- Rieke et al. (2004) Rieke, G. H. et al. 2004, ApJS, 154, 25
- Risaliti et al. (1999) Risaliti, G., Maiolino, R., & Salvati, M. 1999, ApJ, 522, 157
- Rush et al. (1993) Rush, B., Malkan, M. A., & Spinoglio, L. 1993, ApJS, 89, 1
- Sajina et al. (2005) Sajina, A., Lacy, M., & Scott, D. 2005, ApJ, 621, 256
- Setti & Woltjer (1989) Setti, G. & Woltjer, L. 1989, A&A, 224, L21
- Silva et al. (2004) Silva, L., Maiolino, R., & Granato, G. L. 2004, MNRAS, 355, 973
- Stanev & Franceschini (1998) Stanev, T. & Franceschini, A. 1998, ApJ, 494, L159+
- Szokoly et al. (2004) Szokoly, G. P. et al. 2004, ApJS, 155, 271
- Treister & Urry (2005) Treister, E., & Urry, C. M. 2005, ApJ, 630, 115
- Treister et al. (2004) Treister, E. et al. 2004, ApJ, 616, 123
- Urry et al. (1999) Urry, C. M., Falomo, R., Scarpa, R., Pesce, J. E., Treves, A., & Giavalisco, M. 1999, ApJ, 512, 88
- Wirth et al. (2004) Wirth, G. D., Willmer, C. N. A., Amico, P., Chaffee, F. H., Goodrich, R. W., Kwok, S., Lyke, J. E., Mader, J. A., Tran, H. D., Barger, A. J., Cowie, L. L., Capak, P., Coil, A. L., Cooper, M. C., Conrad, A., Davis, M., Faber, S. M., Hu, E. M., Koo, D. C., Le Mignant, D., Newman, J. A., & Songaila, A. 2004, AJ, 127, 3121
- Xu et al. (2001) Xu, C., Lonsdale, C. J., Shupe, D. L., O’Linger, J., & Masci, F. 2001, ApJ, 562, 179
| Field | ID | Prob.aaProbability of random association assuming a Poissonian distribution of sources. Expression 1-(-n ) was used where n is the density of sources and is the distance between the X-ray and infrared sources. | X-ray Flux (erg cm-2 s-1) | Hardness RatiobbDefined as (H-S)/(H+S) where H and S are the background-substracted counts in the Hard and Soft X-ray bands respectively. | Infrared Flux (Jy) | Redshift | Redshift typeccS: Spectroscopic Redshift, P: Photometric Redshift, N: No redshift measured | ClassificationddB: Broad line AGN, N: Narrow line AGN, G: Galaxy, U: Unknown | |||||
|---|---|---|---|---|---|---|---|---|---|---|---|---|---|
| Soft (0.5-2 keV) | Hard (2-8 keV) | 3.6 m | 4.5 m | 5.7 m | 8 m | 24 m | |||||||
| S | 34 | 0.011 | 3.58e-15 | 7.03e-15 | -0.42 | 24.89 | 26.55 | 30.76 | 33.73 | -1.00 | 1.037 | S | B |
| S | 39 | 0.007 | 2.77e-15 | 5.62e-15 | -0.41 | 8.24 | 8.47 | 9.55 | 14.32 | -1.00 | 2.726 | S | B |
| S | 41 | 0.004 | 4.35e-15 | 8.61e-15 | -0.42 | 52.97 | 60.26 | 59.70 | 53.95 | -1.00 | 1.616 | S | B |
| S | 42 | 0.032 | 2.04e-16 | 6.74e-16 | -0.24 | 5.06 | 6.49 | 9.46 | 5.81 | -1.00 | 9.999 | N | U |
| S | 43 | 0.015 | 6.84e-16 | 8.99e-16 | -0.54 | 7.18 | 7.94 | 6.25 | 6.73 | -1.00 | 2.573 | S | N |
Note. — This table is published in its entirety in the electronic edition of the Astrophysical Journal. A portion is shown here for guidance regarding its form and content.