Na-O Anticorrelation And HB I. The Na-O anticorrelation in NGC 2808 ††thanks: Based on observations collected at ESO VLT-UT2 under programme 72.D-0507
We derived atmospheric parameters and elemental abundances of Fe, O and Na for about 120 red giant stars in the Galactic globular cluster NGC 2808. Our results are based on the analysis of medium-high resolution (R=22000-24000) GIRAFFE spectra acquired with the FLAMES spectrograph at VLT-UT2 as a part of a project aimed at studying the Na-O anticorrelation as a function of physical parameters in globular clusters. We present here the anticorrelation of Na and O abundances in NGC 2808, and we discuss the distribution function of stars along this relation. Besides a bulk of O-normal stars, with composition typical of field halo stars, NGC 2808 seems to host two other groups of O-poor and super O-poor stars. In this regard, NGC 2808 is similar to M 13, the template cluster for the Na-O anticorrelation. However, at variance with M 13, most stars in NGC 2808 are O-rich. This might be related to the horizontal branch morphologies which are very different in these two clusters. The average metallicity we found for NGC 2808 is [Fe/H] (rms=0.065 dex, from 123 stars). We also found some evidence of a small intrinsic spread in metallicity, but more definitive conclusions are hampered by the presence of a small differential reddening.
Key Words.:
Stars: abundances – Stars: atmospheres – Stars: Population II – Galaxy: globular clusters – Galaxy: globular clusters: individual: NGC 28081 Introduction
This is the first paper in a series aimed at uncovering and studying the possible existence of a second generation of stars in Galactic Globular Clusters (GCs). The presence and the properties of these stars, likely born from the ejecta of intermediate mass stars, will be inferred from the analysis of the Na-O anticorrelation, found and extensively studied in a number of GCs mainly by the Lick-Texas group (Kraft, Sneden and coworkers; see Gratton, Sneden & Carretta 2004 for a recent review and a summary of abundance variations in clusters).
The Lick-Texas group found that in most of the surveyed GCs there is a star-to-star anticorrelation between the O and Na abundances. This is a sign of the (unexpected) presence of material processed through the complete CNO cycle in GC stars: at the temperature where this occurs, 22Ne is transformed into 23Na by proton capture (Denisenkov & Denisenkova 1989; Langer et al. 1993). Hence, enhanced Na abundances should accompany O depletions in stars. While early interpretations called for deep mixing processes in the same stars where abundance anomalies are observed, Gratton et al. (2001) and subsequently Carretta et al. (2004b) showed that the CNO cycle processed material must be due to pollution from ejecta of other (more massive) stars, since the Na-O anticorrelation is found also among unevolved stars in clusters of any metallicity (NGC 6397, NGC 6752, 47 Tuc were studied).
Favorite nucleosynthesis sites are thermally pulsating intermediate-mass Asymptotic Giant Branch (AGB) stars undergoing hot bottom burning (Ventura et al. 2001). It is unlikely that the Na-rich, O-poor material was acquired by the stars after their formation (Cohen et al. 2002), because the accreted surface layers would be washed out by the deepening of the convective envelope during the red giant evolutionary phase. Hence, this anticorrelation most probably calls for a second generation of stars, formed within GCs from the kinematically cool ejecta of massive AGB stars (Cottrell and Da Costa 1981).
The age difference between the two populations (a few yr) is too small to be directly detectable as different Turn-Offs (TO’s) in the color-magnitude diagrams. However, we might expect a connection between the distribution of stars along the Na-O anticorrelation and the - so far - unexplained presence of extended Blue Horizontal Branches (BHBs) in several GCs. In fact, O-poor, Na-rich (i.e., polluted) stars should also be enriched in He (by about Y=0.04: D’Antona et al. 2002). In turn, He-rich stars evolve faster on the Main Sequence (MS), so that polluted stars currently at the TO should be less massive (by about 0.05 ) than the ”normal” He-poorer stars. If these stars lost mass at the same rate as normal stars on the Red Giant Branch (RGB), their descendants should become much hotter HB stars, maybe explaining the long blue tails observed in many GCs (e.g. in M 13 and NGC 6752, which display the most extended Na-O anticorrelations).
However, this connection still needs to be statistically proven with significative samples of stars in different clusters, in order to disentangle the possible link(s) between HB morphology (extension and mass distribution) and the other parameters (like metallicity, age and the Na-O anticorrelation distribution function, and even the close binary fraction). A first attempt was made by Carretta et al. (2003) who used data from the FLAMES Science Verification program in order to study the Na distribution along the RGB in NGC 2808, a cluster showing a well known bimodal HB morphology, with a clump of red HB stars and a long distribution of stars on the blue side of the RR Lyrae instability strip, down to very faint magnitudes. FLAMES multiplex capability was used to derive Na abundances for 81 RGB stars. Unfortunately, observations of O indicators were available only for a small fraction of stars with measured Na abundances, since spectra were acquired for another purpose. While we are quite confident about the of the anticorrelation, the Na or O abundances alone would be not enough to reconstruct the distribution function of the anticorrelation, since Na or O saturate at the edges of the distribution. On the other hand, the Na/O does continue to vary even at extreme values along the anticorrelation.
To study the connection between the O-Na anticorrelation and the HB morphology an adequate sample of stars in each cluster is required: assuming a flat distribution (a very rough approximation), the probability to cover at least a fraction of the total range using stars is . Hence, to estimate the extent of the Na-O anticorrelation with 4% accuracy at a 95% level of confidence we need to observe stars in each GC. About 20 GCs with a wide distribution of HB morphologies are required to confidently conclude that a connection indeed exists. To estimate the full extent of the Na-O anticorrelation, observations of stars down to [O/Fe] dex111We use the usual spectroscopic notation: log n(A) is the abundance (by number) of the element A in the usual scale where log n(H)=12; notation [A/H] is the logarithmic ratio of the abundances of elements A and H in the star, minus the same quantity in the Sun. are needed: this implies high resolution, high S/N observations of RGB stars.
The capabilities of VLT+FLAMES (high multiplex gain, high resolution) allow us to gather the required number statistics, both in the number of GCs and of stars studied in each GC. Hence, we started the present project in order to perform a systematic analysis of large number of stars with accurate and homogeneous Na and O abundances in about 20 GCs.
In the present paper we present the method of analysis and the results obtained for NGC 2808. An outline of the observations is given in the next Section. The derivation of atmospheric parameters and the analysis are discussed in Sect. 3, whereas error estimates are given in Sect. 4. Finally, Sect. 5 and 6 are devoted to the reddening and intrinsic scatter in Fe for NGC 2808 and to the results for the Na-O anticorrelation, respectively. Summary and conclusions are presented in Sect. 7.
2 Observations
Our data were collected with the ESO high resolution multifibre spectrograph FLAMES/GIRAFFE (Pasquini et al. 2002), mounted on VLT UT2. Observations were done with two GIRAFFE setups, the high-resolution gratings HR11 (centered at 5728 Å) and HR13 (centered at 6273 Å) to measure the Na doublets at 5682-5688 Å and 6154-6160 Å and the [O I] forbidden lines at 6300, 6363 Å, respectively. Resolution is R=24200 (for HR11) and R=22500 (for HR13), at the centre of spectra.
| Grating | Date | UTbeginning | exptime |
|---|---|---|---|
| HR11 | 2004-02-16 | 05:35:52.011 | 3000 |
| 2004-02-16 | 06:26:45.660 | 3000 | |
| 2004-02-17 | 05:23:11.985 | 2850 | |
| 2004-02-17 | 06:11:42.443 | 2850 | |
| HR13 | 2004-01-12 | 05:36:55.750 | 2850 |
| 2004-01-12 | 06:25:25.730 | 2850 | |
| 2004-01-18 | 05:56:41.205 | 3000 | |
| 2004-01-18 | 06:47:34.701 | 3000 |
We obtained 4 exposures for each grating (for both gratings, 2 exposures of 3000 s, and 2 of 2850 s); the observation log is given in Table 1. Pointings were centered at RA = 09:12:00.1, DEC = 64:51:50.7 (J2000).
Stars were selected from the photometry by Bedin et al. (2000), kindly made available by the authors, and already used for a FLAMES Science Verification program (Carretta et al. 2003, 2004a). We chose stars along the RGB, from about (1 mag below the RGB tip) down to . Targets were selected among isolated stars, i.e. all stars were chosen to be free from any companion closer than 2 arcsec and brighter than mag, where is the target magnitude.
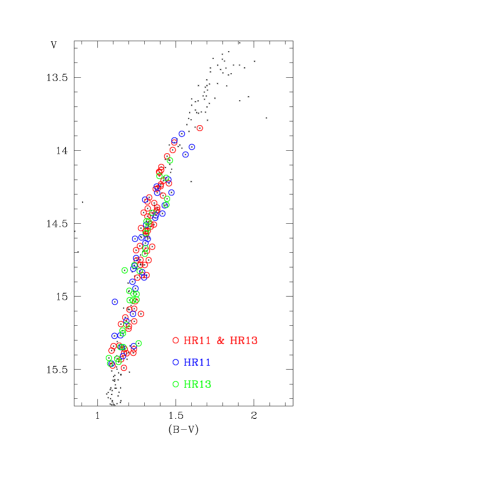
We decided to target different objects with the UVES fibers, in order to observe up to 14 stars per cluster in the highest resolution mode222The analysis of these higher resolution spectra will be presented elsewhere; hence, the GIRAFFE fiber positioning was also slightly different between the pointings used with the two gratings. As a consequence, not all the stars were observed in both gratings; on a grand total of 130 different stars observed, we have 65 objects with spectra for both gratings, 34 with only HR11 observations and 31 with only HR13 observations. Since the Na doublet at 6154-6160 Å falls into the spectral range covered by HR13, we could measure Na abundances for all 130 target stars, whereas we could expect to measure O abundances only up to a maximum of 65+31 stars. A list of all observed targets is given in Table 2, and the colour magnitude diagram (CMD) is shown in Figure 1.
| Star | RA (h m s) | DEC (d p s) | V | B | J | K | RV(HR11) | RV(HR13) | HR | Notes |
|---|---|---|---|---|---|---|---|---|---|---|
| 7183 | 9 12 2.8710 | -64 49 34.069 | 14.854 | 16.168 | 106.58 | 106.55 | 11,13 | |||
| 7315 | 9 11 58.581 | -64 49 29.88 | 14.683 | 15.930 | 12.255 | 11.425 | 98.30 | 98.97 | 11,13 | |
| 7536 | 9 12 31.7065 | -64 49 22.268 | 14.372 | 15.812 | 11.802 | 10.829 | 96.77 | 13 | ||
| 7558 | 9 12 20.1287 | -64 49 21.891 | 15.389 | 16.576 | 13.160 | 12.407 | 117.01 | 118.12 | 11,13 | |
| 7788 | 9 11 57.1979 | -64 49 14.551 | 14.870 | 16.168 | 12.472 | 11.623 | 98.91 | 11 | ||
| 8198 | 9 11 48.9714 | -64 48 59.526 | 15.340 | 16.572 | 13.042 | 12.277 | 100.09 | 11 | ||
| 8204 | 9 11 58.577 | -64 48 59.27 | 15.119 | 16.397 | 12.793 | 11.879 | 109.67 | 109.95 | 11,13 | |
| 8603 | 9 12 14.0510 | -64 48 42.915 | 14.432 | 15.847 | 11.902 | 10.957 | 109.93 | 11 | ||
| 8679 | 9 11 44.5585 | -64 48 39.890 | 14.961 | 16.164 | 12.753 | 12.022 | 43.27 | 13 | Field |
3 Atmospheric parameters and analysis
3.1 Atmospheric parameters
Temperatures and gravities were derived as described in Carretta et al. (2003); along with the derived atmospheric parameters and iron abundances, they are shown in Table 3 (completely available only in electronic form). We used magnitudes taken from the Point Source Catalogue of 2MASS (Cutri et al. 2003); the 2MASS photometry was transformed to the TCS photometric system, as used in Alonso et al. (1999).
We obtained Teff’s and bolometric corrections B.C. for our stars from colors whenever possible. We employed the relations by Alonso et al. (1999, eqs. 4, 7 and 17, with the erratum of 2001). We adopted for NGC 2808 a distance modulus of =15.59 and a reddening of = 0.22 (Harris 1996, updated at http://physun.physics.mcmaster.ca/Globular.html), and the relations , , and (Cardelli et al. 1989). An input metallicity of [Fe/H] was adopted from Carretta et al. (2004a), based on the analysis of UVES Red Arm spectra333This value is slightly different from what we derive in the present study; however, the dependence of () on [Fe/H] is so weak that temperatures are almost unaffected by this difference.
There are a few target stars with no magnitude from 2MASS and a few others appearing as outliers in the , diagram, but not in the , diagram: this is probably due to the worse spatial resolution of 2MASS, an important factor in a dense GC field. Temperatures for these stars were derived from a mean relation T as a function of T.
Surface gravities log ’s were obtained from effective temperatures and bolometric corrections, assuming that the stars have masses of 0.85 M⊙. The adopted bolometric magnitude of the Sun is .
We did not take into account the existence of differential reddening (Walker 1999, Bedin et al. 2000) since no individual correction for each star is available in literature. The differential reddening is however small: peak-to-peak differences amount to mag (, Walker 1999, Bedin et al. 2000). The effect of this will be taken into account as an additional error source in the abundance derivation (see Sect. 4).
3.2 Equivalent widths
Data reduction was done using standard IRAF444IRAF is distributed by the National Optical Astronomical Observatory, which are operated by the Association of Universities for Research in Astronomy, under contract with the National Science Foundation packages for bias subtraction, flat-fielding correction, correction for scattered light, spectra extraction and wavelength calibration. We measured radial velocities (RVs) for each spectrum (using RVIDLINES on about 25 to 40 lines for HR11 and HR13 respectively); the error is less than 0.5 km s-1 on each measure, and we put in Table 2 the average for the 4 pointings in each grating, after correction for heliocentric motion. The average heliocentric velocity is RV = 102.4 km s-1 (), from 124 stars, after eliminating the non-members on the basis of their very discrepant RVs (more than 6 from the average).
All spectra were shifted to zero radial velocities, then combined star by star; this enhanced S/N and eliminated cosmic rays hits from the coadded spectra.
In the case of HR13, before coadding, each individual spectrum was corrected for blending with telluric lines due in particular to H2O and O2 near the [O I] line at 6300 Å (we checked that no correction was necessary for the [O I] line at 6363 Å, or the Na lines in HR11). We generated a synthetic spectrum covering the interval 6280 to 6325 Å, taking line positions and equivalent widths for atmospheric lines in the Sun from the tables by Moore, Minnaert & Houtgast (1966); we then adjusted the spectral resolution and line strengths until they matched the resolution of GIRAFFE spectra and the intensity of telluric features at the moment of observations.
Our stellar spectra were then divided by the adjusted synthetic spectrum of the telluric lines, cleaning fairly well the [O I] line from telluric contaminations. Finally, a coadded spectrum was obtained from these cleaned spectra; the final S/N ratio is always high (S/N 100, and up to 300, depending on the stellar magnitude and centering of the star on the fibre), as estimated from the averages computed in several small intervals free of lines along the spectra.
The blaze function was removed with standard IRAF tasks. After this, a refined continuum tracement was derived as follows. First, we summed (for each grating) the spectra of all cluster stars; then we selected a fair number of fiducial regions of continuum in the resulting master spectrum (of very high S/N ratio). By using a specialized set of commands in the ROSA spectrum analysis package (Gratton 1988), the final continuum placement was done using these fiducial points.
Equivalent widths555s are available upon request from the first author () were measured as described in detail in Bragaglia et al. (2001); in particular, in the iterative clipping to derive a local continuum around each line, after several checks we decided that a clipping factor of 2 for stars cooler than 4600 K and a factor 1 for warmer stars was the optimal choice for NGC 2808.
3.3 Iron abundances
We started from the line list described in Gratton et al. (2003) and extensively used in the analysis of high resolution spectra of GC stars (see Carretta et al. 2004a,b; Gratton et al. 2001). Atomic parameters for the subset of lines falling in the spectral range covered by gratings HR11 and HR13 are those given in that paper, as well as the reference solar abundances used (computed using the Kurucz 1995 model atmospheres grid, see below).
However, the original line list was optimized for a higher resolution than the present one, hence we had to cull out a few Fe I lines whose abundances were systematically discrepant, likely because of blends. We ended up with typically 15 to 18 Fe I lines safely measurable in stars with only HR11 observations, 18 to 22 lines with only HR13 spectra, and up to 30 or 40 lines for stars observed with both gratings. The number of measured Fe II lines ranges from zero to a maximum of 4.
Values of the microturbulence velocity were obtained by eliminating trends of the abundances from Fe I lines with line strength (see Magain 1984). We checked that the optimization for individual stars resulted in a much smaller scatter in the derived abundances than using a mean value of as a function of Teff or . For stars with observations only in HR11 the uncertainty attached to is obviously larger, since only a few lines could be used.
Final metallicities are obtained by choosing in the Kurucz (1995) grid of model atmospheres (with the option for overshooting on) the model with the proper atmospheric parameters whose abundance matches that derived from Fe I lines. Average abundances of iron for NGC 2808 are [Fe/H]i (rms=0.065) dex, from 123 stars and [Fe/H]ii (rms=0.093) dex, from 90 objects. We do not think this difference is really relevant, since abundances for Fe ii rely on average on only two lines.
Our metallicity, based on the analysis of medium resolution GIRAFFE spectra of a large sample of RGB stars in NGC 2808, is in very good agreement with previous results by Carretta et al. (2004a), who derived [Fe/H]i (rms=0.06) dex and [Fe/H]ii (rms=0.13) dex from a sample of 20 red giants with UVES Red Arm spectra, covering a much wider spectral range.
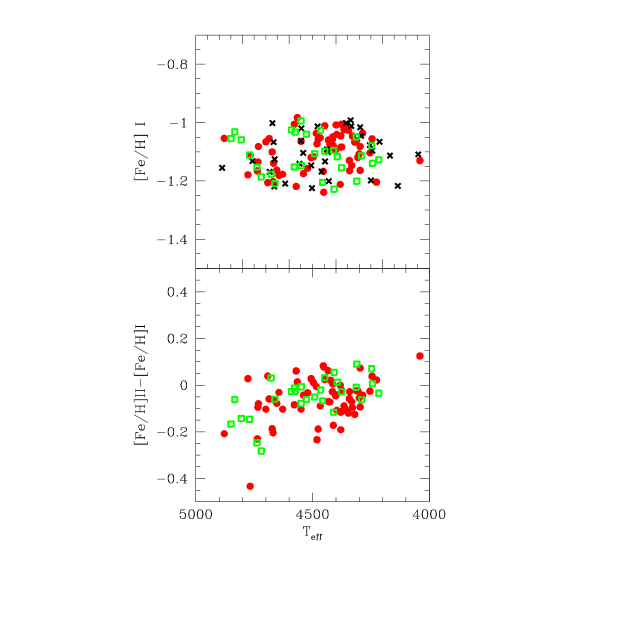
The distribution of resulting [Fe/H] values as a function of the temperatures is shown in Figure 2, with stars coded according to the grating they were observed with. The scatter of the metallicity distribution is discussed in Sect. 5.
| Star | Teff | [A/H] | nr | [Fe/H]i | nr | [Fe/H]ii | ||||
|---|---|---|---|---|---|---|---|---|---|---|
| (K) | (dex) | (dex) | (km s-1) | (dex) | (dex) | |||||
| 07183 | 4423 | 1.51 | 1.08 | 1.66 | 41 | 1.08 | 0.13 | 3 | 1.06 | 0.17 |
| 07315 | 4452 | 1.45 | 1.24 | 1.54 | 33 | 1.24 | 0.10 | 3 | 1.16 | 0.17 |
| 07536 | 4247 | 1.18 | 1.09 | 1.45 | 23 | 1.08 | 0.13 | 3 | 1.01 | 0.11 |
| 07558 | 4692 | 1.87 | 1.22 | 1.30 | 33 | 1.21 | 0.12 | 3 | 1.17 | 0.18 |
| 07788 | 4461 | 1.53 | 1.17 | 1.40 | 18 | 1.17 | 0.14 | |||
| 08198 | 4617 | 1.81 | 1.21 | 1.21 | 13 | 1.21 | 0.14 | |||
| 08204 | 4467 | 1.63 | 1.05 | 1.35 | 38 | 1.05 | 0.15 | 3 | 1.14 | 0.14 |
| 08603 | 4292 | 1.24 | 1.05 | 1.65 | 19 | 1.05 | 0.12 | |||
| 08679 | 4734 | 1.72 | 0.25 | 1.38 | 21 | 0.20 | 3 | 0.79 | 0.07 | |
| 08739 | 4213 | 1.13 | 1.07 | 1.82 | 19 | 1.07 | 0.12 | |||
| 08826 | 4565 | 1.66 | 0.99 | 1.22 | 39 | 0.98 | 0.15 | 3 | 0.97 | 0.08 |
3.4 Sodium and oxygen abundances
Abundances of O and Na rest on measured s. For Na, one or both the doublets at 5672-88 Å and at 6154-60 Å (depending on the setup observed) are always available. Derived average Na abundances were corrected for effects of departures from the LTE assumption using the prescriptions by Gratton et al. (1999).
Oxygen abundances are obtained from the forbidden [O i] lines at 6300 and 6363 Å. The O lines were carefully inspected by eye; in some cases they were measured interactively if the automatic measurement failed (e.g., because of some residual asymmetries due to imperfect removal of telluric lines). In this check we were also able to derive fairly reasonable upper limits to the s in a few stars.
The contribution to the forbidden [O i] line from the Ni blend at 6300.34 Å is not a source of concern: Carretta et al. (2004a) estimated that the s of the [O i] 6300.31 Å line in RGB stars are hardly affected by more than mÅ in NGC 2808. Also, CO formation is not expected to lead to significant corrections to the O abundances, given the rather high temperatures of the stars and the low expected C abundances.
4 Errors in the atmospheric parameters
Errors in the derived abundances are affected by three main contributions (errors in temperatures, in microturbulence velocities and in the measurements of s), and by two less severe error sources (errors in surface gravities and in the adopted model metallicity). In the following, we will concentrate on the major error sources.
Errors in temperatures.
Bedin et al. (2000) estimated as 0.02 mag (one ) the effect of differential reddening across the cluster area where our targets were selected. Using the calibrating relations by Alonso et al. (1999), the effect of an error of 0.02 mag in translates into an error of 41 K in Teff. On the other hand, the photometric error in the adopted colors is given by the quadratic sum of errors in (estimated in a few thousandths of mag by Bedin et al.) and in ( mag, from 2MASS). Since the two photometries (optical and IR) are independent there is no color term and we adopt a photometric error of 0.02 mag in . When summed in quadrature with the error due to the differential reddening ( mag in ), we obtain 0.054 mag. The adopted internal error in Teff is thus 44 K.
Errors in microturbulence velocities.
We computed the quadratic mean of the 1 errors in the slope of the abundance-expected line strength relation from all stars. Afterward, we used star 7183 and repeated the analysis changing until the 1 value from the original slope of the relation between line strengths and abundances was reached. A simple comparison allows us to give an estimate of 1 error associated to , which is 0.09 km s-1. This error is mainly random; systematics due to blending and to the continuum tracement are negligible, and a systematic contribution from errors in the s is not likely, at least for iron lines.
Errors in measurement of equivalent widths.
In order to estimate this contribution, we selected a subset of 63 stars with more than 25 measured Fe lines. The average rms scatter (0.131 dex) in Fe abundance for these stars, divided by the square root of the typical average number of measured line (38), provides a typical internal error of 0.022 dex.
Table 4 shows the sensitivity of the derived abundances to variations in the adopted atmospheric parameters for Fe, Na and O; this is obtained by re-iterating the analysis while varying each time only one of the parameters of the amount shown in the Table. This exercise was done for all stars in the sample, and the average value of the slope corresponding to the average temperature ( K) in the sample was used to estimate the internal errors in abundances. For iron, these amount to dex and 0.027 dex, due to the quoted uncertainties in Teff and .
The impact of errors in s is evaluated in Col. 7, where the average error from a single line is weighted by the square root of the mean number of lines, given in Col. 6. This is done for iron and for the other elements measured in this paper.
| Ratio | [A/H] | EW | tot.1 | tot.2 | ||||
| (+50 K) | (+0.2 dex) | (+0.10 dex) | (+0.20 km/s) | (dex) | (dex) | |||
| (1) | (2) | (3) | (4) | (5) | (6) | (7) | (8) | (9) |
| Fe/Hi | +0.047 | +0.001 | 0.001 | 0.029 | 38 | +0.021 | 0.059 | 0.059 |
| Fe/Hii | 0.040 | +0.010 | +0.017 | 0.011 | 3 | +0.076 | 0.087 | 0.089 |
| O/Fei | +0.046 | 0.001 | +0.004 | +0.009 | 2 | +0.093 | 0.104 | 0.104 |
| Na/Feii | 0.006 | 0.006 | 0.020 | +0.005 | 4 | +0.066 | 0.066 | 0.070 |
Total errors, computed using only the dominant terms and including all the contributions, are reported in Table 4, in Cols. 8 and 9 respectively.
5 Cosmic scatter and reddening in NGC 2808
We can now evaluate the expected scatter in [Fe/H] due to the uncertainties in Teff, and errors in s, and from Table 4 we derive (exp.)= dex (statistical error). The inclusion of contributions due to uncertainties in surface gravity or model metallicity does not alter our conclusions. This result can be compared to the bona fide observed scatter (obs.)= dex (statistical error) estimated as the average rms scatter that we obtain using the 63 stars in our sample with at least 25 measured iron lines.
From the quadratic difference between observed and expected scatter, we can derive a formal value of 0.022 dex for the intrinsic spread in metallicity in NGC 2808. Taking into account the statistical errors attached, we could set a limit of dex as the maximum spread in iron abundance allowed in this cluster. Note that a evidence of a spread of dex seems to be present between the average abundances of Na-poor and Na-rich stars, in NGC 2808 (see below).
In summary, we believe that the dominant contribution to the spread comes from differential reddening: we are confident that the intrinsic spread is small, though perhaps not negligible. The stellar population in NGC 2808 can be considered reasonably homogeneous in Fe content, within a few hundredths of dex.
6 Results and discussion: the Na-O anticorrelation
Abundances of O and Na are listed in Table 5 (only available in electronic form) together with the number of measured lines and the rms value obtained for each species.
| Star | nr | [O/Fe] | rms | nr | [Na/Fe] | rms | HR | lim |
|---|---|---|---|---|---|---|---|---|
| 07183 | 2 | +0.109 | 0.285 | 4 | +0.217 | 0.093 | 2 | 1 |
| 07315 | 2 | +0.384 | 0.041 | 4 | 0.132 | 0.069 | 2 | 1 |
| 07536 | 2 | +0.386 | 0.049 | 2 | +0.004 | 0.067 | 1 | 1 |
| 07558 | 2 | +0.428 | 0.205 | 2 | +0.041 | 0.063 | 2 | 1 |
| 07788 | 2 | +0.503 | 0.102 | 3 | 1 | |||
| 08198 | 2 | +0.126 | 0.029 | 3 | 1 | |||
| 08204 | 2 | +0.324 | 0.004 | 4 | 0.010 | 0.162 | 2 | 1 |
| 08603 | 2 | +0.052 | 0.143 | 3 | 1 | |||
| 08679 | 2 | 0.136 | 0.028 | 2 | +0.303 | 0.036 | 1 | 1 |
| 08739 | 2 | +0.101 | 0.053 | 3 | 1 | |||
| 08826 | 1 | 0.605 | 3 | +0.470 | 0.167 | 2 | 1 | |
| 09230 | 2 | +0.659 | 0.081 | 3 | 1 | |||
| 09724 | 2 | 0.171 | 0.091 | 4 | +0.426 | 0.181 | 2 | 1 |
| 09785 | 2 | +0.471 | 0.027 | 1 | 1 | |||
| 10012 | 2 | 0.235 | 0.164 | 4 | +0.369 | 0.151 | 2 | 1 |
The [Na/Fe] ratio as a function of [O/Fe] ratio is displayed in Figure 3 for each of the red giant stars with both O and Na detections in NGC 2808, and for a few stars in which only upper limits in the s of the [O I] 6300 Å line were measured. The high resolution and high S/N ratio of our spectra allow us to confidently reach stars down to [O/Fe].
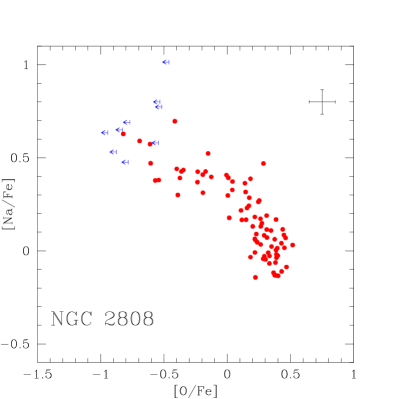
The classical Na-O anticorrelation is clearly present also in this cluster, as already shown by Carretta et al. (2004a): stars sharing the same position along the giant branch show very different O and Na content.
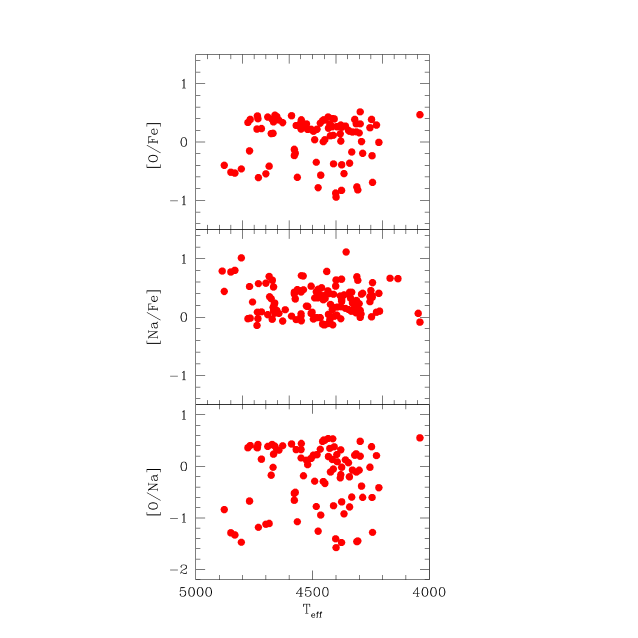
There is scarce -if at all- evidence of an internal origin in the very same stars that we presently observe for this phenomenon. There is no evidence that O-poor, Na-rich stars are segregated in particular regions of the sampled RGB (upper and middle panels in Figure 4). This is at odds with expectations if evolutionary processes, due to some extra-mixing, are at work as the stars climb along the RGB, bringing to the surface more and more material processed by nuclear proton-capture reactions. The theoretical scenario would imply a bunch of heavily altered Na-rich, O-depleted stars at the bright (cool) end of the RGB. This is not seen, confirming early results by Carretta et al. (2003) in this cluster: the spread in abundances seen at every luminosity along the RGB tells us that, whatever the mechanism producing the alterations is, these anomalies are likely to be established well before the stars begun to move towards more advanced evolutionary phases (see also Gratton et al. 2001 and Carretta et al. 2004b for studies in scarcely evolved cluster stars).
Since Na or O saturates at the edges of the distribution function (the [O/Fe] ratio, for instance, levels off to the average value typical of halo field stars, whereas [Na/Fe] still varies), the ratio O/Na appears the best indicator to trace the stars distribution along the Na-O anticorrelation because this ratio does continue to vary even at extreme values. Excluding the non-members, we have 82 stars where O is detected and 9 other with a robust upper limit. However, we have Na abundances available for all the 123 member stars examined, thus we are able to ”project” every star with no direct O determination along the locus defined by the global Na-O anticorrelation, whose shape is very well established.
| Cluster | stars | Reference |
|---|---|---|
| NGC 104 (47 Tuc) | SGB+TO | Carretta et al. (2004b) |
| RGB | Norris & Da Costa (1995) | |
| RGB | Carretta (1994) | |
| NGC 288 | RGB | Shetrone & Keane (2000) |
| NGC 362 | RGB | Shetrone & Keane (2000) |
| NGC 2808 | RGB | Carretta et al. (2004a) |
| RGB | present study | |
| NGC 3201 | RGB | Gonzalez & Wallerstein (1998) |
| NGC 5272 (M 3) | RGB | Cohen & Melendez (2005) |
| RGB | Sneden et al. (2004) | |
| NGC 5904 (M 5) | RGB | Ivans et al. (2001) |
| NGC 6121 (M 4) | RGB | Ivans et al. (1999) |
| NGC 6205 (M 13) | RGB+SGB+TO | Cohen & Melendez (2005) |
| RGB | Sneden et al. (2004) | |
| NGC 6254 (M 10) | RGB | Kraft et al. (1995) |
| NGC 6397 | SGB+TO | Carretta et al. (2005)+Gratton et al. (2001) |
| RGB | Norris & Da Costa (1995) | |
| RGB | Carretta (1994) | |
| NGC 6528 | RHB | Carretta et al. (2001) |
| NGC 6715 (M 54) | RGB | Brown et al. (1999) |
| NGC 6752 | SGB+TO | Carretta et al. (2005)+Gratton et al. (2001) |
| RGB | Yong et al. (2003) | |
| RGB | Norris & Da Costa (1995) | |
| RGB | Carretta (1994) | |
| NGC 6838 | RGB+SGB+TO | Ramirez & Cohen (2002) |
| NGC 7006 | RGB | Kraft et al. (1998) |
| NGC 7078 (M 15) | RGB | Sneden et al. (1997) |
| Pal 5 | RGB | Smith et al. (2002) |
| Pal 12 | RGB | Cohen (2004) |
| Ter 7 | RGB | Tautvaisiene et al. (2004) |
This is shown in Figure 5 where the general shape of the Na-O anticorrelation is drawn using a collection of literature data for almost 400 stars in about 20 globular clusters (47 Tuc, NGC 6752, NGC 6397, M 13, M 3, M 5, NGC 3201, Ter 7, Pal 5, M 4, NGC 288, NGC 362, NGC 7006, M 15, M 10, Pal 12, M 71, NGC 6528, M 54; references and evolutionary status of the observed stars are listed in Table 6). We took into account, whenever stated in the original papers, the different adopted solar abundances, bringing them to our reference scale (Gratton et al. 2003). In this Figure most of the stars (blue points) are evolved red giants, but the anticorrelation is well followed even by scarcely evolved cluster stars (about 40 turnoff and subgiant stars, red points) as well as by RGB stars of the present study (green points).
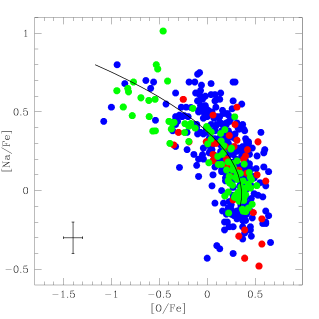
Apart from providing us with an useful tool to exploit also stars having no direct O observations, this plot suggests some interesting points:
-
(i)
clusters of any metallicity in the range typical of these systems are represented in this plot, from M 92 ([Fe/H] dex, Carretta & Gratton 1997) to NGC 6528 ([Fe/H]= dex, Carretta et al. 2001);
-
(ii)
a large range of physical properties (total mass, concentration, density) is sampled by these clusters;
-
(iii)
all kind of HB morphologies (from red clump only to very extended blue HBs) are present among the clusters used to produce this plot;
-
(iv)
all cluster stars, irrespective of their evolutionary status (from scarcely evolved stars near the cluster turn-off to bright giants near the RGB tip), seem to follow the same locus in this plane.
Moreover, some of the studied clusters (e.g. Pal 12, M 54, Ter 7) have been very likely originated in extragalactic objects, later accreted by our Galaxy.
From these evidences we can conclude safely enough that whatever the mechanism responsible of the anticorrelation is, it must be an property of a globular cluster, an universal feature of these objects. Moreover, point (iv) supports the idea that it is likely related to the cluster formation process itself, since it is already in place among unevolved stars formed in the first few 107- years from the beginning of the star formation in each cluster.
In fact, unevolved low mass stars do not reach the high temperatures required for activating proton capture chains as the NeNa and MgAl; moreover they do not possess efficient convective envelopes. It follows that any variations in the abundances of -capture elements (O, Na, Mg, Al) must be likely already imprinted in the gas out of which these stars formed. The typical times for the release of ejecta enriched in these elements (such as those from the most favorite candidate polluters - intermediate-mass AGB stars - see Gratton et al. 2004 and Carretta et al. 2005 for a detailed discussion) are just a few 107- years, since these are among the first objects to evolve and die in a globular clusters (see also D’Antona et al. 2005).
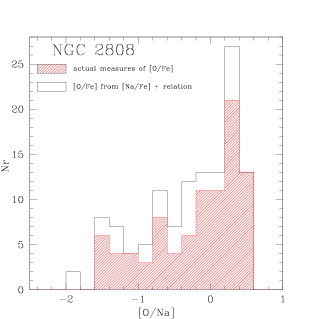
The distribution function of stars along the Na-O anticorrelation in NGC 2808 is shown in Figure 6, where the ratio [O/Na] from our data is used. The dashed area shows the distribution obtained by using only actual detections or carefully checked upper limits. The empty histogram is derived by following the overall Na-O anticorrelation, in order to get [O/Fe] values even for stars with no observations in HR13.
The bulk of stars along the RGB in NGC 2808 is peaked at [O/Fe] (and [O/Na] dex) with a scatter of 0.12 dex around this value; this should represent the “normal” O content of the ejecta by massive, type II supernovae (SNe), typical of halo objects. We can identify this group of stars as the counterpart of the general halo field objects.
However, the distribution of stars continues down to very low [O/Na] values in NGC 2808. A clearcut division into well defined groups is rather hard to apply, since the appearance of the distribution is more similar to an extended tail, starting from normal-halo O values. However, if we take as a working hypothesis [O/Na] and as boundaries, we can tentatively identify two other groups of O-poor and super O-poor stars, peaking at [O/Fe], [O/Na] and dex, respectively.
Although the statistical significance is admittedly not very high (the rms scatter in each group is about 0.2 dex) the average Fe abundance is increasing, going from [Fe/H] ( dex, 74 stars) in the group of O-normal stars, to [Fe/H] ( dex, 27 stars), and [Fe/H] ( dex, 21 stars) for the O-poor and super O-poor groups. This is very interesting, since it is in qualitative agreement with what we expect if O-depleted stars are also enriched in He from the likely same polluting source (intermediate-mass AGB stars?). In fact, in stars with the same original metal abundance, an increase in He abundance would be seen as an increased strength of metallic lines (Böhm-Vitense 1979).
This is exactly the trend that we observe in NGC 2808, even if more significative conclusions on the intrinsic Fe spread are hampered by the presence of a small differential reddening in this cluster. However, this effect of decreasing Fe cannot be explained by it, which would instead produce fluctuations around a mean value.
, we can reverse this line of thought and ask what mass fraction Y of He may be associated to these three groups, simply starting from the definition of the logarithmic ratio [Fe/H], assuming the number of H atoms proportional to the mass fraction X and neglecting the contribution of heavy species Z. We found that in order to reproduce the different [Fe/H] between the O-normal group (likely having a primordial Y=0.24) and the super O-poor group we need to consider a value Y=0.30 for the latter. The intermediate group should have a mass fraction Y of about 0.26.
Interestingly, we do not find any evidence of a group having a large He enrichment, about Y=0.40: this would correspond to a mean value of [Fe/H] dex, 0.1 dex more metal-rich than the dominant population. This would exceed the intrinsic scatter carefully evaluated in Sect. 5. If confirmed, this would put strong constraints on every model concerning star formation, in one or multiple generations in a globular cluster. In particular, the model proposed very recently by D’Antona et al. (2005) predicts about 20% of stars being generated in a stage of star formation from ejecta of massive AGB stars with Y=0.40. We would expect to reveal such stars also along the RGB. However, stars very He-enriched would have a turnoff mass lower than about 0.65 M⊙ (D’Antona et al. 2005), and if the mass loss rate does not depend strongly on Y these stars could have left the RGB before reaching the He-flash point. In this case, these objects could not be really represented in our observed sample.
Notice also that the fractions we found for the different groups on the RGB support this view. From the numbers of stars in the RHB and BHB of NGC 2808 as reported in D’Antona & Caloi (2004) and from the histogram in their Fig. 1 we derived a ratio 1:0.65:0.38 for the RHB clump, the so-called EBT1 (the bulk of stars at brighter magnitudes in the BHB) and the sum of stars in the EBT2+EBT3 groups (the faint part of the BHB, see Bedin et al. 2000). As explained in the modeling by D’Antona et al. (2005), these are the likely outcome of stars starting their life with a He mass fraction Y=0.24, and 0.40, respectively.
On the other hand, following the above discussion, we can infer that in our sample along the RGB in NGC 2808 we found 74 O-normal stars, likely with a (“cosmological”) He content Y=0.24, and 27+21 stars in the O-poor and super O-poor subgroups respectively, with Y increasing up to Y=0.30. In these case the ratio is again 1:0.65 for the O-normal:(O-poor+super O-poor) populations, supporting the view that we are sampling the progenitors of RHB stars and of the bulk of brighter BHB stars. The super He-rich progenitors of the extreme BHB stars could be simply missing in our sample if they never completed their RGB evolution.
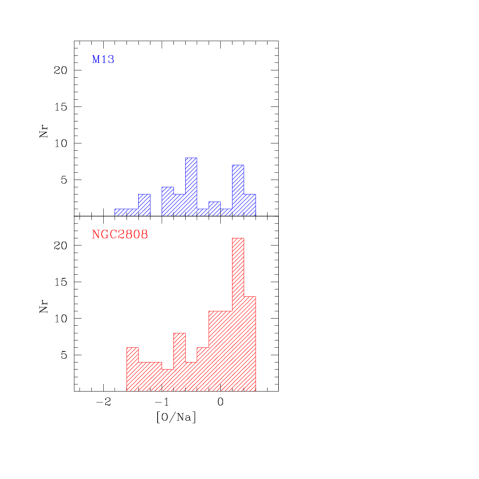
In Figure 7 we compare the observed distributions of RGB stars along the global Na-O anticorrelation in NGC 2808 (present study) and M 13 (Sneden et al. 2004), the template cluster as far as the Na-O anticorrelation is concerned. Abundances for Na and O in M 13 are corrected for the adoption of solar abundances different from ours; for Na we used the values corrected for effects of departures from LTE using the same prescriptions by Gratton et al. (1999), as we did for NGC 2808. This (homogeneous) comparison shows that:
-
•
in both clusters three groups of stars (O-normal, O-poor and super O-poor) can be seen distributed along the global Na-O anticorrelation. In particular, we note that M 13 is not anymore the only cluster in which stars with very low O abundances can be observed. Although Sneden et al. (2004) do not distinguish between limits and actual detections, stars with [O/Fe] ratios as low as (within the uncertainties related to the analysis) are found in both clusters;
-
•
whatever the mechanism responsible for the anticorrelation is, it produced the same range in [O/Na] ratios;
-
•
the relative weights in the distribution functions along the Na-O relation are different in the two clusters: a Kolmogorov-Smirnov test shows only a % probability that both samples in Figure 7 are extracted from the same parent distribution;
-
•
at variance with M 13, most stars in NGC 2808 are O-normal. This might be related to the HB morphologies, very different in the two clusters: NGC 2808 has a bimodal HB (HB parameter (B-R)/(B+V+R)=-0.49 from the on line catalogue by Harris 1996) while the HB of M 13 (HB parameter = 0.97 from the same source) is populated only to the blue of the RR Lyrae instability strip.
In NGC 2808 there seems to be a rather straightforward correspondence between the stars along the RGB and their progeny on the HB: following the previous discussion, it seems possible to identify RHB stars as those having O-rich/Na-poor/He-poor composition when formed. The two other groups could originate the BHB, for instance as in the scenario devised by D’Antona and coworkers.
However, the case of M 13 seems to show that more modeling is required, since a relevant group of O-normal stars is present on the RGB, yet no RHB stars are found in this cluster. Where have all the O-normal stars gone, after the He-flash, in M 13? We have to postpone a more thorough discussion to the completion of the analysis of our whole sample of clusters with different HB morphologies.
7 Summary and conclusions
In this paper we have derived atmospheric parameters and elemental abundances for about 120 red giant stars in the globular cluster NGC 2808.
From the analysis of GIRAFFE spectra sampling the forbidden [O i] lines and the Na doublets at 5682-88 and 6154-60 Å we measured Na and O abundances for a large sample of stars. We also derived the distribution function of stars in [O/Na], i.e. along the Na-O anticorrelation, the well known signature of proton-capture reactions at high temperature.
We found that the bulk of stars along the RGB in NGC 2808 has normal O (and Na) content, typical of field halo stars, where we are seeing predominantly the contributions of yields from massive type II supernovae. However, we tentatively identified also two other groups of stars, whose O content is depleted or even strongly depleted.
Evidence of accompanying He-enrichment comes from the average Fe abundances in these two groups, although the statistical significance is not very high. However, the qualitative agreement between the observations and the theoretical prediction for pollution by He-rich and O-depleted matter provided by a previous generation of IM-AGB stars supports a scenario where a fraction of the presently observed stars was formed from polluted or heavily polluted intracluster gas.
In this regard, the distribution function of stars in [O/Na] for NGC 2808 is similar to the one seen in M 13, a template cluster as far as the the Na-O anticorrelation is concerned. This is interesting, since the HB morphology of these two cluster is very different.
The average metallicity we found for NGC 2808 is [Fe/H] (rms=0.065 dex, from 123 stars). We also found some evidence of a small intrinsic spread in metallicity, but more definitive conclusions are hampered by the presence of a small differential reddening.
Acknowledgements.
This publication makes use of data products from the Two Micron All Sky Survey, which is a joint project of the University of Massachusetts and the Infrared Processing and Analysis Center/California Institute of Technology, funded by the National Aeronautics and Space Administration and the National Science Foundation. This work was partially funded by Cofin 2003029437 (P.I. Raffaele Gratton) ”Continuità e discontinuità nella formazione della nostra Galassia” by Ministero Università e Ricerca Scientifica, Italy.References
- (1) Alonso, A., Arribas, S. & Martinez-Roger, C. 1999, A&AS, 140, 261
- (2) Alonso, A., Arribas, S. & Martinez-Roger, C. 2001, A&A, 376, 1039
- (3) Bedin, L.R., Piotto, G., Zoccali, M., Stetson, P.B., Saviane, I., Cassisi, S., & Bono, G. 2000, A&A, 363, 159
- (4) Böhm-Vitense, E. 1979, ApJ, 234, 521
- (5) Bragaglia, A., Carretta, E., Gratton, R.G. et al. 2001, AJ, 121, 327
- (6) Brown, J.A., Wallerstein, G., Gonzalez, G. 1999, AJ, 118, 1245
- (7) Cardelli, J.A., Clayton, G.C., & Mathis, J.S. 1989, ApJ, 345, 245
- (8) Carretta, E. 1994, Ph.D. Thesis, University of Padova
- (9) Carretta, E., Gratton R.G. 1997, A&A Suppl. 121, 95
- (10) Carretta, E., Cohen, J.G., Gratton, R.G., Behr, B.B. 2001, AJ, 122, 1489
- (11) Carretta, E., Bragaglia, A., Cacciari, C., & Rossetti, E. 2003, A&A, 410, 143
- (12) Carretta, E., Bragaglia, A. & Cacciari 2004a, ApJ, 610, L25
- (13) Carretta, E., Gratton R.G., Bragaglia, A., Bonifacio, P. & Pasquini, L. 2004b, A&A, 416, 925
- (14) Carretta, E., Gratton R.G., Lucatello, S., Bragaglia, A., Bonifacio, P. 2005, A&A, 433, 597
- (15) Cohen, J.G. 2004, AJ, 127, 1545
- (16) Cohen, J.G., Briley, M.M., Stetson, P.B. 2002, AJ, 123, 2525
- (17) Cohen, J.G. & Melendez, J. 2005, AJ, 129, 303
- (18) Cottrell, P.L., & Da Costa, G.S. 1981, ApJL, 245, L79
- (19) Cutri, R.M., et al. 2003, VizieR On-line Data Catalog: II/246, Originally published in: University of Massachusetts and Infrared Processing and Analysis Center, (IPAC/California Institute of Technology)
- (20) D’Antona, F. & Caloi, V. 2004, ApJ, 611, 871
- (21) D’Antona, F., Caloi, V., Montalb n, J., Ventura, P., Gratton, R. 2002, A&A, 395, 69
- (22) D’Antona, F., Bellazzini, M., Caloi, V., Fusi Pecci, F., Galleti, S., Rood, R.T. 2005, ApJ, 631, 868
- (23) Denisenkov, P.A., Denisenkova, S.N. 1989, A.Tsir., 1538, 11
- (24) Gonzalez, G. & Wallerstein, G. 1998, AJ, 116, 765
- (25) Gratton, R.G. 1988, Rome Obs. Preprint Ser., 29
- (26) Gratton, R.G., Carretta, E., Eriksson, K., & Gustafsson, B. 1999, A&A, 350, 955
- (27) Gratton, R.G., Bonifacio, P., Bragaglia, A., et al. 2001, A&A, 369, 87
- (28) Gratton, R.G., Carretta, E., Claudi, R., Lucatello, S., & Barbieri, M. 2003, A&A, 404, 187
- (29) Gratton, R.G., Sneden, C., & Carretta, E. 2004, ARA&A, 42, 385
- (30) Harris, W. E. 1996, AJ, 112, 1487
- (31) Ivans, I.I., Sneden, C., Kraft, R.P., Suntzeff, N.B, Smith, V.V., Langer, G.E., Fulbright, J.P. 1999, AJ, 118, 1273
- (32) Ivans, I.I., Kraft, R.P., Sneden, C., Smith G.H., Rich, R.M., Shetrone, M. 2001, AJ, 122, 1438
- (33) Kraft, R.P., Sneden, C., Langer, G.E., Shetrone, M.D., Bolte, M. 1995, AJ, 109, 2586
- (34) Kraft, R.P., Sneden, Smith, G.H, Shetrone, M.D., Fulbright, J. 1998, 115, 1500
- (35) Kurucz, R.L. 1995, CD-ROM 13, Smithsonian Astrophysical Observatory, Cambridge
- (36) Langer, G.E., Hoffman, R., & Sneden, C. 1993, PASP, 105, 301
- (37) Magain, P. 1984, A&A, 134, 189
- (38) Moore, C.E., Minnaert, M.G.J. & Houtgast, J. 1966, The Solar Spectrum 2935 Å to 8770 Å (Washington:GPO)
- (39) Norris, J.E., & Da Costa, G.S. 1995, ApJL, 441, L81
- (40) Pasquini, L. et al. 2002, The Messenger, 110, 1
- (41) Ramirez, S. & Cohen, J.G. 2002, AJ, 123, 3277
- (42) Shetrone, M.D. & Keane M.J. 2000, AJ, 119, 840
- (43) Smith, G.H., Sneden, C., Kraft, R.P. 2002, AJ, 123, 1502
- (44) Sneden, C., Kraft, R.P., Shetrone, M.D., Smith, G.H., Langer, G.E., Prosser, C.F. 1997, AJ, 114, 1964
- (45) Sneden, C., Kraft, R.P., Guhathakurta, P., Peterson, R.C., Fulbright, J.P. 2004, AJ, 127, 2162
- (46) Tautvaisiene, G., Wallerstein, G., Geisler, D., Gonzalez, G., Charbonnel, C. 2004, AJ, 127, 373
- (47) Ventura, P. D’Antona, F., Mazzitelli, I., & Gratton, R. 2001, ApJ, 550, L65
- (48) Walker, A.R. 1999, AJ, 118, 432
- (49) Yong, D., Grundahl, F., Lambert, D.L., Nissen, P.E., Shetrone, M.D. 2003, A&A, 402, 985