Globular cluster systems in low-luminosity early-type galaxies near the Fornax Cluster centre
Abstract
We present a photometric study of the globular cluster systems of the Fornax cluster galaxies NGC 1374, NGC 1379, and NGC 1387. The data consists of images from the wide-field MOSAIC Imager of the CTIO 4-m telescope, obtained with Washington and Kron–Cousins filters. The images cover a field of 36 36 arcmin, corresponding to 200 200 kpc at the Fornax distance. Two of the galaxies, NGC 1374 and NGC 1379, are low-luminosity ellipticals while NGC 1387 is a low-luminosity lenticular. Their cluster systems are still embedded in the cluster system of NGC 1399. Therefore the use of a large field is crucial and some differences to previous work can be explained by this. The colour distributions of all globular cluster systems are bimodal. NGC 1387 presents a particularly distinct separation between red and blue clusters and a overproportionally large population of red clusters. The radial distribution is different for blue and red clusters, red clusters being more concentrated towards the respective galaxies. The different colour and radial distributions point to the existence of two globular cluster subpopulations in these galaxies. Specific frequencies are in the range , smaller than the typical values for elliptical galaxies. These galaxies might have suffered tidal stripping of blue globular clusters by NGC 1399.
keywords:
galaxies: individual: NGC 1374, NGC 1379, NGC 1387 – galaxies: clusters: general – galaxies: elliptical and lenticular, cD – galaxies: star clusters – galaxies: photometry – galaxies: haloes1 Introduction
There is an extensive literature on globular cluster systems (GCSs) of large galaxies located in the centre of clusters (e.g. the reviews from Ashman & Zepf 1998 or Harris 2001) but low-luminosity galaxies with their own GCSs are also present in such environments. The centres of galaxy clusters are interesting regions for studying possible interactions between the central massive galaxy and its less massive galactic neighbours. These interactions may also influence the properties of their cluster systems.
The nearby Fornax cluster offers the best opportunity for studying such a scenario due to the huge GCS that surrounds its central giant galaxy, NGC 1399 (Dirsch et al. 2003a, and references therein), and the presence of several low-luminosity galaxies in its neighbourhood. The GCS of NGC 1404, one of these less massive galaxies, has been studied by Richtler et al. (1992) and, more recently, by Forbes et al. (1998) and Grillmair et al. (1999). The latter authors identified two GC subpopulations: metal-poor GCs (blues) and metal-rich ones (reds), the metal-rich clusters being more centrally concentrated than the metal-poor ones. The low specific frequency (as defined by Harris & van den Bergh 1981) of this system has been understood as a deficiency of GCs, probably stripped in an interaction process with NGC 1399 (Forbes, Brodie & Grillmair 1997). Numerical simulations were performed by Bekki et al. (2003) to analyse this scenario of tidal stripping and accretion.
One may speculate if GCs lost by low-luminosity galaxies are really captured by the central galaxy or just remain unbound within the galaxy cluster, like the proposed intracluster GCs (White 1987; West et al. 1995; Bassino et al. 2003).
Our aim with the present paper is to study more early-type galaxies in the Fornax cluster: NGC 1387 (type S0), NGC 1379 (E0) and NGC 1374 (E1). These galaxies are located at angular distances from NGC 1399 of 19, 29 and 41 arcmin, respectively.
The GCS of NGC 1387 has first been studied with CCD techniques by Grebel & Richtler (1990) who obtained a surprisingly red mean colour . Later, Kohle et al. (1996) and Kissler–Patig et al. (1997a) performed and photometry of its GCS as well as of NGC 1374 and NGC 1379. The former paper focused on the GC luminosity functions, the latter on the colour, spatial distributions, and total numbers of GCs. They concluded that the galaxies have between 300 and 500 GCs () and that their colours are redder than those of the Milky Way GCs. However, they found no evidence for multiple populations, but simply pointed to a wide range in metallicities. None of the GCSs seem to be elongated and the density profiles follow the respective galaxy light profiles. The background was determined locally within the frames of 7.4 7.4 arcmin used in these papers.
The GCS of NGC 1379 has been the target of a HST-study (Elson et al. 1998) combining HST data (B band) with ground-based observations in the and bands. They estimated the total population in NGC 1379 to be 440 GCs, based on a Gaussian luminosity function with mean = 24.95 and = 1.55 mag. Again, no evidence for bimodality was found in the colour distribution. A specific frequency was obtained up to a radius of 70 arcsec . The background corrections were measured in a field located 14 from the Fornax cluster centre (see also Grillmair et al. 1999).
The apparent lack of multiple GC subpopulations in these three galaxies was taken by Kissler–Patig, Forbes & Minniti (1998) as an argument to set several constraints on the process of formation of elliptical galaxies. The impact posed by the existence of GCs subpopulations on the studies of origin and evolution of galaxies is one of the reasons why we think that their GCSs deserve to be re-examined with a better metallicity resolution.
On the basis of data provided by Kissler–Patig et al. (1997a), Forbes, Brodie & Grillmair (1997) suggest that the early-type galaxies in Fornax, located close to NGC 1399, might have been tidally stripped off their GCs. They note that their values increase with projected distance from the cluster centre. Moreover, their GC surface density slopes are similar to that of the underlying starlight, perhaps as a result of losing the outermost clusters. Both effects have also been studied through dynamical models by Bekki et al. (2003).
On the other hand, Capuzzo-Dolcetta & Donnarumma (2001) use the Elson et al. (1998) data for NGC 1379 and the Forbes et al. (1998) data for NGC 1399 and NGC 1404 (all from HST) to show that the surface brightness profiles of the underlying galaxies are steeper than the GC profiles. They propose that GCs from the inner regions might have been lost as a consequence of dynamical friction and tidal interaction with the galactic nuclei.
We re-investigate the GCSs in NGC 1387, NGC 1379 and NGC 1374, on the basis of new MOSAIC images in the Washington photometric system. This system provides a metallicity resolution sufficiently good for a firm detection of GCs subpopulations. The large field improves the determination of the background (partly due to the NGC 1399 GCs) that may otherwise alter the radial density profiles and luminosity functions of these low number GCSs.
The analysis of the GCSs of our three target galaxies is organized as follows: Section 2 describes the observations and the adopted criteria for the globular cluster candidates’ selection. In Section 3 we analyse the colour and spatial distributions, the luminosity functions of the GCSs and also estimate the total populations. A discussion of the results is provided in Section 4. Finally, a summary of the results and their implications are provided in Section 5.
2 Observations and Data Reduction
2.1 Observations and point sources selection
The observations were performed with the MOSAIC camera (8 CCDs mosaic imager) mounted at the prime focus of the 4-m Blanco telescope at the Cerro Tololo Inter–American Observatory (CTIO), during 2001 November 17–19. One pixel of the MOSAIC wide-field camera subtends 0.27 arcsec on the sky, which results in a field of 36 36 arcmin (200 200 kpc at the Fornax distance). All three target galaxies were covered by one MOSAIC field. For more information on the MOSAIC camera we refer to its homepage (http://www.noao.edu/kpno/mosaic/mosaic.html).
Kron-Cousins and Washington filters were used. We selected the filter instead of the original Washington as Geisler (1996) has shown that the Kron-Cousins filter is more efficient than , and that and magnitudes are very similar, with just a very small colour term and zero-point difference ().
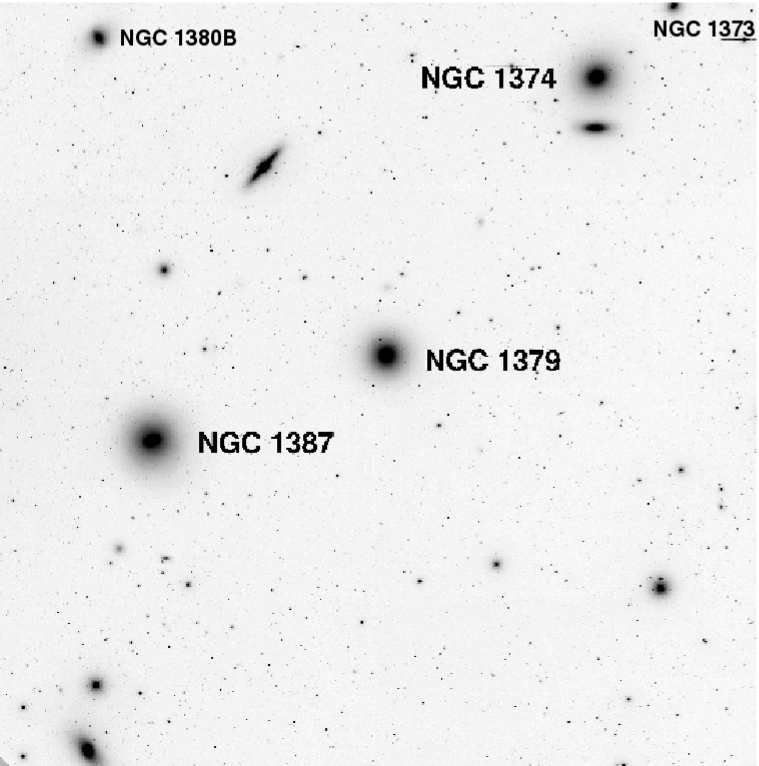
In order to fill in the gaps between the 8 individual MOSAIC chips, the data were dithered taking three images in with exposure times of 600 s each, and six images in with exposures of 1 200 s each. Fig. 1 shows a combined image of the MOSAIC field where the three galaxies have been identified. Their basic data are given in Table 1.
| Galaxy | RA(J2000) | DEC(J2000) | Type | RV [km sec-1] | ||
|---|---|---|---|---|---|---|
| NGC 1374 | E1 | 12.00 | 0.014 | |||
| NGC 1379 | E0 | 11.80 | 0.012 | |||
| NGC 1387 | S0 | 11.68 | 0.013 |
The MOSAIC data were reduced using the mscred package within IRAF111IRAF is distributed by the National Optical Astronomy Observatories, which is operated by AURA, Inc. under contract to the National Science Foundation.. The software corrects for the variable pixel scale across the CCD which might cause a 4 per cent variability in point sources brightness (from the centre to the corners). The final image resulted with remaining sensitivity variations up to 0.8 per cent, and the final image up to 1.5 per cent. The seeing in these final images was 1 arcsec on the frame, and 1.2 arcsec on the frame.
The halo light of each galaxy was subtracted by means of a ring median filter with an inner boundary of 1.3 arcsec and an outer boundary of 10.7 arcsec. In previous work based on MOSAIC images (Dirsch et al. 2003a, b), we have already checked that this process does not affect the photometry. Anyway, we also have compared the magnitudes obtained with and without filtering for several point sources on different positions on the image. The differences were negligible as compared to the photometric errors (see below).
The photometry was done with DAOPHOT within IRAF. For the first search we used DAOFIND on a combined image and 20 856 unresolved and extended objects were detected in the whole field. In the final and images, a second order variable PSF was derived using about 100 evenly distributed stars per frame, which was adjusted to the sources through the ALLSTAR task. The estimated errors in the aperture corrections between the PSF radius and a 15 pix radius were 0.02 and 0.01 mag for the and images, respectively.
Several tests were carried out before deciding how to select the point sources. We compared the results obtained using the stellarity index estimated by the SExtractor software (Bertin & Arnouts 1996) which is a reliable tool for separating point sources and extended objects (see, for instance, Nonino et al. 1999), adopting an stellarity index between 0.4 and 1 for point sources (following Dirsch et al. 2003a), with the results obtained from DAOPHOT using different options for the parameters and sharpness of the ALLSTAR task. We finally adopted as point sources those objects selected with the ALLSTAR parameters and sharpness between -0.5 and 0.5 (see, for instance, Reid et al. 1996).
In this way, out of the total number of objects originally detected in the field, 6 520 point sources were selected, populating a magnitude range of .
2.2 Photometric calibration and globular clusters selection
The photometric calibration of our observations already has been performed by Dirsch et al. (2003a) so we conveniently can use their relations. Fields of standard stars were selected from the list of Geisler (1996). Four or five fields, with roughly 10 standard stars located on each of them, were obtained in each night. Care was taken to cover a large range in airmasses (1.0 to 1.9 approximately).
In order to calculate the standard magnitudes from the instrumental ones, we have used the equations already obtained by Dirsch et al. (2003a) for this run, which we reproduce here:
These equations also include the zero-point difference to transform into magnitudes (as explained in Section 2.1) so, in the rest of this paper, we will use magnitudes, not . The photometric errors for the point sources are shown in Fig. 2.
The colour-magnitude diagram for all point sources in the field is plotted in Fig. 3. Globular cluster candidates can be clearly distinguished in the range mag. Objects bluer than and fainter than are mostly compact background galaxies while objects redder than are mainly foreground stars.


We select as GC candidates those point sources with colours and magnitudes where the faint limit is adopted according to the completeness results described in Section 2.3. All GC candidates identified on the MOSAIC field are shown in Fig. 4, where the GCSs around the three galaxies can clearly be seen; their positions, magnitudes and colours are listed in Table 2. We also notice in Fig. 4 a smooth background distribution of GC candidates with a projected density decreasing from East to West, representing the GCS of NGC 1399, the central galaxy of the Fornax cluster. It is located at a projected angular distance of 19 arcmin from NGC 1387, towards the East.

-
a
The estimated precision is 0.3 arcsec.
The selection of GC candidates should be corrected for the contamination by the background. In the study of the NGC 1399 GCS we have used for this purpose a background field located as far as 35 from the parent galaxy (Dirsch et al. 2003a). In the present case, where there is a rather strong contamination from NGC 1399 itself (see Fig. 4) we must estimate the background contribution in regions closer to the target galaxies, i.e. within the same MOSAIC image. We should take into account that blue clusters from the GCS of NGC 1399 extend up to 40 – 45 arcmin from the Fornax cluster centre (Bassino et al. 2005, in preparation) and that NGC 1374, the target galaxy located farther away from it, has an angular separation of 41 arcmin. Thus, we have chosen as background for NGC 1374 the region (labelled ‘c’ in Fig. 4) located at 3000 pix and 6000 pix (density objects arcmin-2) where we excluded the region with 3000 and 6000 pix due to the presence of NGC 1373, a small galaxy at 5 arcmin to the NW with respect to NGC 1374 (see Fig. 1), and whose probably own cluster candidates show up at = 8000 and = 1000 in Fig. 4. The background defined for NGC 1379 is the region (labelled ‘b’) located at 3000 5000 pix excluding a circle of radius 800 pix (density objects arcmin-2); for NGC 1387 the region (labelled ‘a’) located at 7000 and 5000 pix excluding a circle of radius 1000 pix (density objects arcmin-2) was selected as background; the region with 7000 and 5000 pix was excluded due to the presence of another galaxy, NGC 1380B.
All these regions are shown in Fig. 4. It can be seen that the background density increases from West to East as we get closer to NGC 1399. This effect is also present in the background counts obtained for the same galaxies by Kohle et al. (1996, see their fig. 1), although the influence of NGC 1399 GCs is not mentioned as a background component.
The reddening towards our three galaxies taken from Schlegel et al. (1998), is depicted in Table 1. The colour excess in the Washington photometric system is estimated by the relation (Harris & Canterna 1977), and the absorption in with (Rieke & Lebofsky 1985). For the reddening of the three background regions defined in the previous paragraph, we adopt the values corresponding to the galaxies located in each of them, respectively. In the rest of the paper, all magnitudes and colours will be reddening free.
2.3 Completeness
In order to estimate the completeness of the GC candidates for the and final images, we added 1 000 artificial stars by means of the ADDSTAR task within DAOPHOT, which were generated with random positions scattered through the whole MOSAIC field. They were distributed within approximate the same the colour range used to select the GC candidates. This process was repeated 10 times, with 10 different seed numbers. The whole reduction process then was applied to each frame with added stars in exactly the same way as to the science images. The differences between input and output magnitudes and colours for the ‘added’ stars did not show any systematic trend with the magnitude.
As a result, the completeness for stars in the colour range corresponding to the GC candidates is close to 90 per cent for a limiting magnitude decreases rapidly to 50 per cent for a limiting magnitude ; this latter magnitude has been adopted as the faint magnitude limit of the GC candidates for further study in this paper. No difference was found in the completeness function for blue and red GCs, taking as the colour limit between them.
The analysis of the regions close to the galaxies’ centres shows that inside = 100 pix. (27 arcsec) the detection of GC candidates is affected by the light of the galaxies and saturation so we will not consider those inner regions in our study. The areas corresponding to 100 pix 200 pix (27 – 54 arcsec) are still affected by the light of the galaxies and we expect there a completeness factor around 80 5 per cent. The GC radial distributions will be corrected for this last effect and, in the following, we will refer to it as the innermost annulus or bin ‘geometric incompleteness’.
3 The Globular Cluster Systems
In what follows we will analyse the GCSs of the three galaxies. On the basis of the projected distributions depicted in Fig. 4 and the radial density profiles (see below), the radial extensions of the GCSs will be taken as = 3.1 arcmin (700 pix) for NGC 1387, = 2.7 arcmin (600 pix) for NGC 1379, and = 2.2 arcmin (500 pix) for NGC 1374. We adopt an inner limit of at = 27 arcsec (100 pix) for all GCSs (see Section 2.3). The edge-on disc galaxy NGC 1375 is seen in projection close to NGC 1374 so its GCs may be contaminating the NGC 1374 GCS; this is not causing a problem because the NGC 1375 GCS does not seem to be very populous, as proved by inspection of the images. NGC 1373 seems to have its own cluster system, as mentioned above, so we restrict the selection of GC candidates in NGC 1374 to a radial distance of 500 pix to exclude it. Table 3 gives the number of blue and red cluster candidates found in the regions defined for each galaxy. The colour range is and the magnitude range , The selected colour limit between blue and red clusters is , as supported by the colour distributions discussed below (Fig. 6). We remind here that the adopted faint magnitude cut-off is , the magnitude at which the completeness function is 50 per cent.
3.1 Colour distributions
Fig. 5 presents the colour-magnitude diagrams for point sources (selected as explained in Section 2.1) around the three galaxies within the radial limits stated above. GC candidates show up in them: the presence of two GC populations is clear in NGC 1387 and NGC 1374. The separation of blue and red GC candidates is not so clear in NGC 1379.


We can get a better picture from the colour distributions shown in Fig. 6. Displayed are the raw colour distributions, the backgrounds, and the background corrected distribution, all smoothed by a Gaussian kernel with dispersion 0.09 mag. The histograms of the background-corrected data are also plotted. Not only the GCSs of NGC 1387 and NGC 1374 appear clearly bimodal, but the one of NGC 1379 too. It also can be seen in Fig. 6 that the contamination by the background decreases with increasing angular distance from NGC 1399 (angular distances of NGC 1387, NGC 1379 and NGC 1374 from NGC 1399 are 19, 29 and 41 arcmin, respectively) and that this effect is mostly due to a blue population. This is in agreement with the less concentrated radial distribution of blue clusters found at large distances from the parent galaxy (Bassino et al. 2005, in preparation) with respect to the radial distribution of red GCs. In addition, we note that the colour distribution of the background selected for NGC 1399 by Dirsch et al. (2003a, their Fig. 6), which is a field located 35 northeast of the Fornax centre, looks very similar to the background chosen for NGC 1374, the most distant galaxy from NGC 1399. The backgrounds for NGC 1379 and NGC 1387 present larger blue populations, demonstrating the large extent of the NGC 1399 system.
| Galaxy | ||||||||
|---|---|---|---|---|---|---|---|---|
| NGC 1374 | ||||||||
| NGC 1379 | ||||||||
| NGC 1387 |
-
a
Number of blue / red GC candidates without background corrections and Poisson errors.
-
b
Number of blue / red GC candidates background-corrected and Poisson errors including the background errors.
Apparently, the better metallicity resolution provided by the Washington photometric system allows us to detect bimodalities that were not visible in other photometric systems. The GCSs of NGC 1387, NGC 1379 and NGC 1374 did not show evidence for multiple populations in the photometry by Kissler–Patig et al. (1997a), neither did the photometry of NGC 1379 presented by Elson et al. (1998), as already mentioned in the introduction. We are aware of the low metallicity resolution of the colour index (see, for instance, fig. 7 in Dirsch et al. 2003a) but one may wonder why the data, known to provide a better metallicity resolution than colours, do not show any evidence of bimodality for NGC 1379 either. In order to analyse the colour distributions, the background corrections play a fundamental role. Elson et al. (1998) used for their HST observations a background field lying 14 to the south of the centre of the Fornax cluster; it seems that this field probably lacks the strong contribution added to the background by the NGC 1399 GCS. Also, in the same paper, there is no background field for the CTIO (ground-based) observations, so the authors use a corrected sample of the CFRS (Canada–France Redshift Survey, Lilly et al. 1995) which might probably present the same problem.
In addition to the individual GCS colour distributions of NGC 1374, NGC 1379, NGC 1387 and NGC 1427, Kissler–Patig et al. (1997a) presented,a composite histogram for all GCs with colour uncertainties less than 0.1 mag. Interestingly, this composite distribution seems to be bimodal according to a KMM test (the GCS of NGC 1427 has already been found to be clearly bimodal on the basis of the Washington photometry performed by Forte et al. (2001)).
The GCSs of NGC 1387 and NGC 1374 are more populous than the one of NGC 1379 within the quoted ranges of magnitude, colour, and radial distance (it should be noticed that vertical scales are different in Fig. 6). The number of identified red cluster candidates in NGC 1387 outnumber the blue ones by more than a factor of three. They also reach redder colours as compared to the other GCSs.
From Figs. 5 and 6 and from the data depicted in Table 3, the GCS of NGC 1379 shows a similar number of blue GC candidates as red ones, although suggesting a larger number of red ones (40 blue/49 red). The same trend is present for the GC candidates around NGC 1374, where the relative number of blue/red clusters results 61/73.
The fractions of blue/red cluster candidates for the three galaxies are 32 per cent for NGC 1387, 82 per cent for NGC 1379, and 84 per cent for NGC 1374. Moreover, all three galaxies present more red clusters than blue ones, which is quite peculiar as compared to GCSs in general. One may suspect that either some kind of interaction might have been causing a loss of blue GCs from these galaxies, or that an enhanced cluster formation rate was responsible of an overabundance of red GCs in any of them, or both. We will come back to this point in the discussion. The results of the two-Gaussian fits applied to all colour distributions are also given in Table 3. The blue peaks agree within the errors and lie in the range ; it is possible to compare them with the blue peak colours determined for GCSs of other Fornax galaxies: for GC candidates between = 1.8 and 4.5 arcmin in NGC 1399 (Dirsch et al. 2003a), for GCs with r 4 arcmin in NGC 1404 (Forbes et al. 1998) which corresponds to applying the colour conversions proposed by Forbes & Forte (2001), and for candidates between = 0.5 and 5 arcmin in NGC 1427 (Forte et al. 2001). They all agree among each other within 0.1 mag.
On the other hand, the red peaks of the three target galaxies show larger differences among each other. Their range is , with a bluer peak for NGC 1379. The red peaks (within the same radial ranges and obtained by the same authors) have for NGC 1399, which corresponds to for NGC 1404, and for NGC 1427. They agree with the NGC 1387 value while peaks for NGC 1374 and NGC 1379 are bluer, more noticeable for NGC 1379.
3.2 Spatial distributions
3.2.1 Azimuthal distributions
In order to analyse the radial density distributions of the GCSs, it should first be determined if they are spherical or if they show some ellipticity. Fig. 7 displays the azimuthal distributions of GCs for the three systems with respect to position angle (measured from North to East). No evidence for ellipticity can be seen in case of the NGC 1387 system. The GCS in NGC 1379 does not show any clear azimuthal dependence either within the uncertainties; as this galaxy is classified as E0, this is what one expects.

The same holds true for NGC 1374. It is classified as an E1 galaxy and has a ellipticity smaller than 0.1 as calculated with the ELLIPSE task within IRAF. So we expect again sphericity and all we can see in Fig. 7 seems to be an excess of GC candidates for position angles greater than which is probably due to GCs from NGC 1375.
These results are consistent with those of Kissler–Patig et al. (1997a).
3.2.2 Radial distributions
Radial number density profiles of the GCSs are presented in Fig. 8; they include the profiles uncorrected for background contamination as well as the background-corrected profiles. For the latter case, blue and red candidates are shown separately and are tabulated in Table 4. In all cases, the Poisson errors include the uncertainties of the raw counts and of the background. The luminosity profiles of the corresponding galaxies, in a proper scaling, are also shown as well as the densities of background objects determined in Section 2.2. We remind that the adopted cut-off magnitude is .

| r [arcmin] | ||||||
|---|---|---|---|---|---|---|
| 0.45 - 0.90 | ||||||
| 0.90 - 1.35 | ||||||
| 1.35 - 1.80 | ||||||
| 1.80 - 2.25 | ||||||
| 2.25 - 2.70 | ||||||
| 2.70 - 3.60 | ||||||
| 3.60 - 4.50 | ||||||
| 4.50 - 5.85 | ||||||
| 5.85 - 7.20 |
The innermost bins, which correspond to radial distances 100 r 200 pix (0.45 – 0.68 arcmin) from the galaxy centres, are affected by the light of the galaxies so we apply an 80 per cent completeness factor to correct for this ‘geometric’ incompleteness.
The density profile of NGC 1387 clusters shows that the raw counts profile flattens at a level that agrees with the background density estimated above. The background-corrected density profile was fit by a power law of the form in the range 54 arcsec to 162 arcsec (2nd. to 5th. bins in Table 4), excluding the innermost bin and the outer regions where there are very few candidates left. The slope obtained for all GC candidates was , while for blue and red candidates separately they were (blue clusters) and (red clusters). The GC density profile in NGC 1387 is clearly dominated by the red clusters, which show a steeper profile than the blue candidates, a result in common with other GCSs as, for example, the ones in the already mentioned Fornax early type galaxies NGC 1399 (Dirsch et al. 2003a), NGC 1404 (Forbes et al. 1998), and NGC 1427 (Forte et al. 2001). The three profiles (for all, red and blue candidates) are also fit reasonably well by a law , within the same range used for the power law.
The density profiles of the GC population in NGC 1379 look similar to the ones for NGC 1387, except that no dominant subpopulation is present in this case as red candidates are only slightly more abundant than blue ones. The raw counts profile levels out at the density value corresponding to the background objects, estimated near this galaxy. The background-corrected profile can be fit by a power law of slope in the same radial range as in NGC 1387 (2nd. to 5th. bins in Table 4); from the fits of blue and red candidates we obtain (blues) and (reds). The red clusters seem to be again more concentrated than the blue clusters, although the uncertainty is rather large. As in the case of NGC 1387, an law provides a good fit for the density profiles of all candidates together as well as for blues and reds separately.
Finally, the GC density profiles for NGC 1374 present a different behaviour, as depicted in Fig. 8. The raw counts profile does not flatten at the density value of the nearby estimated background objects due to the presence of GCs which probably belong to neighbouring galaxies; the candidates from NGC 1375 may be the responsible of the excess at 162 arcsec or 600 pix (see Table 4) while some candidates from NGC 1373 may be also present at the two outer bins. To avoid this extra contamination we restrict the fit of the background-corrected counts by a power law to a smaller radial range 54 arcsec 135 arcsec (2nd. to 4th. bins in Table 4), from which we obtain slopes (all candidates), (blue clusters) and (red clusters).
The slope coefficients for the power law fits found by Kissler–Patig et al. (1997a), for all candidates, in NGC 1387, NGC 1379 and NGC 1374 are: 2.2, 2.1 and 1.8, respectively; they agree within the uncertainties with our values except for NGC 1374 for which they obtain a shallower slope, probably due to the influence of the nearby contaminating GCSs.
It is difficult to compare our results for NGC 1379 with the HST based ones from Elson et al. (1998) due to the different spatial coverage, limiting magnitude, and comparison field (see Section 3.1). Elson et al. argue that the GCS is lost in the background at 80 arcsec while, on the other side, they are able to analyse its behaviour even within 10 arcsec; instead, our density profile suggests that the GC density reaches the background level at about 200 arcsec while we cannot study the GCs inside 27 arcsec. Capuzzo-Dolcetta & Donnarumma (2001) assign the difference between the surface brightness profile of NGC 1379 and its GCS profile in the inner region ( 50 arcsec) to a loss of GCs caused by dynamical friction and tidal interaction with the galactic nucleus; in our case the innermost bin in the radial density profile of NGC 1379, corrected for geometric incompleteness, does not show any noticeable difference with the galaxy light profile.
For the three galaxies under study, the radial density profiles GC candidates follow the light profiles of the respective galaxies (at least out to the radial distance at which they become undistinguishable from the background), as already pointed out by Kissler–Patig et al. (1997a). The power law indices obtained for them are for NGC 1387, for NGC 1379, and for NGC 1374.
3.3 Luminosity functions
The luminosity functions for the GC candidates (GCLFs) in NGC 1387, NGC 1379 and NGC 1374 are presented in Fig. 9. As the images used in this study are not very deep, and the completeness sets the faint magnitude limit at , we are not able to reach the turn-over magnitudes (TOMs) of the GCLFs with the required precision to derive distances. Instead, we opt to investigate whether these TOMs show the universal behaviour.

The GCLFs are based on the magnitude distributions corrected for photometric incompleteness and contamination by the background with bins of 0.6 mag for NGC 1387 and NGC 1379 and bins of 0.7 mag for NGC 1374 for which we choose a slightly larger bin to diminish the errors as incompleteness seems to be affecting the fainter bins more in NGC 1374 than in the other galaxies (see Fig. 9). As said above, an inner limit of = 27 arcsec is considered for all three GCSs and the geometric incompleteness in the 100 – 200 pix bins have not been corrected.
As we are unable to construct the GCLFs beyond the TOMs, it is not possible to fit Gaussians leaving both mean value and dispersion as free parameters. We rather prefer to fix the dispersion at , a value already obtained on the basis of Washington photometry by Ostrov et al. (1998) and Dirsch et al. (2003a) for NGC 1399, and by Forte et al. (2001) for NGC 1427, and just estimate indicative TOMs by means of the Gaussian fits.
The fit to all the NGC 1387 GC candidates gives an indicative TOM at , and for the red subpopulation at , in agreement with the former value (more than 75 per cent of the GCs belong to the red subpopulation in this galaxy). We can also estimate the expected TOM if we adopt the SBF distance modulus obtained by Jensen et al. (2003) for this galaxy and accept a universal TOM. The absolute TOM estimated by Richtler (2003) as a weighted average of the TOMs for the Milky Way and M31 (Harris 2001; Barmby, Huchra & Brodie 2001, respectively) is . By means of the mean colour of the whole GC sample and the colour conversions from Forbes & Forte (2001), we can transform the band TOM into an band one . Thus, the expected apparent TOM is (which corresponds to (Geisler 1996)); our observed value is 0.14 mag fainter.
In the case of NGC 1379 and NGC 1374, we perform fits to the whole population of GC candidates only, without separating between blue GCs and red GCs. There are no dominant subpopulations and the number of only blue or red candidates would be too low. The indicative TOMs then result in for NGC 1379, and for NGC 1374. The SBF distances from Jensen et al. (2003) are for NGC 1379 and for NGC 1374. Following the same procedure, and by means of the mean colour of the GC populations: for NGC 1379 and for NGC 1374, we estimate the expected absolute TOMs as and , and the corresponding apparent TOMs as and , for NGC 1379 and NGC 1374, respectively. For NGC 1379 the observed and expected TOMs agree within the errors while for NGC 1374 the observed TOM is about 0.3 mag brighter. The observed TOMs for NGC 1374 given by Kohle et al. (1996) are from a Gaussian fit and from a –function fit. The expected TOM according to the SBF distance is , so in this case again the observed TOMs turn out to be 0.3 and 0.4 mag brighter, respectively, than the expected one.
3.4 Total populations and specific frequencies
In order to calculate the specific frequencies we need the total GC populations and the absolute V magnitudes of the galaxies. The total GC populations can be estimated from the luminosity functions, if we accept that they are fully Gaussian and the corresponding mean values and adopted dispersions are known. However, for all the GCSs under study, we lack information on the central 100 pix area, and also the surface density values for the first radial bin (100 pix – 200 pix) are affected by geometric incompleteness that was not corrected in the GCLFs. We will then estimate, for each system, the population within the inner 100 pix assuming a constant surface density determined from the power law fit at = 100 pix; we justify this assumption for the three GCSs following Elson et al. (1998) who found for NGC 1379 that the surface density profile of the GCs flattens out inwards = 30 arcsec, which corresponds to 111 pix on our scale. In addition to this, a correction that should be taken into account is the difference between the observed radial density obtained for the first bin (uncorrected for the incompleteness) and the calculated radial density from the power law fit for the same bin. Thus, the inner 100 pix population and the correction for the 100 – 200 pix range will be added, for each GCS, to the populations obtained from the GCLFs.
First, we calculate the raw number of GCs in the bright halves of the Gaussians (taking the TOM as upper magnitude limit), and correct them for contamination by the background and photometric incompleteness; these counts are then doubled to cover the whole Gaussian. The errors are calculated on the basis of the Poisson uncertainties of the raw and background counts, and the effect of the incompleteness. In this way, we obtain GCs for NGC 1387, GCs for NGC 1379, and GCs for NGC 1374. Secondly, the fraction of the GC populations contained in the inner 100 pix corresponds to GCs for NGC 1387, GCs for NGC 1379, and GCs for NGC 1374, where the errors take into account the errors of the fit. Finally, the corrections to be added due to the differences between observed and calculated densities in the first radial bins of each system, and their corresponding errors, are of GCs for NGC 1387, GCs for NGC 1379, and GCs for NGC 1374. Thus, the total estimated populations result in GCs for NGC 1387, for NGC 1379, and GCs for NGC 1374, where the uncertainties are estimated as a combination of the uncertainties in the three steps just described; they are shown in Table 5.
| Galaxy | NGC | SN | |
|---|---|---|---|
| NGC 1374 | |||
| NGC 1379 | |||
| NGC 1387 |
Kissler–Patig et al. (1997a) obtained GCs for NGC 1387, GCs for NGC 1379, GCs for NGC 1374. Elson et al. (1998) quoted GCs for NGC 1379. Our results for NGC 1387 and NGC 1374 are in good agreement with Kissler–Patig et al. (1997a), particularly for NGC 1387. In the case of NGC 1379, our estimated GC population agrees barely within the errors with the one from Kissler–Patig et al., and it is about 50 per cent below the estimation from Elson et al. This large difference is likely a consequence of the different background: as the Elson et al. background is far away from NGC 1399, it lacks the contribution of its CGS and this might turn into a overabundant GC population.
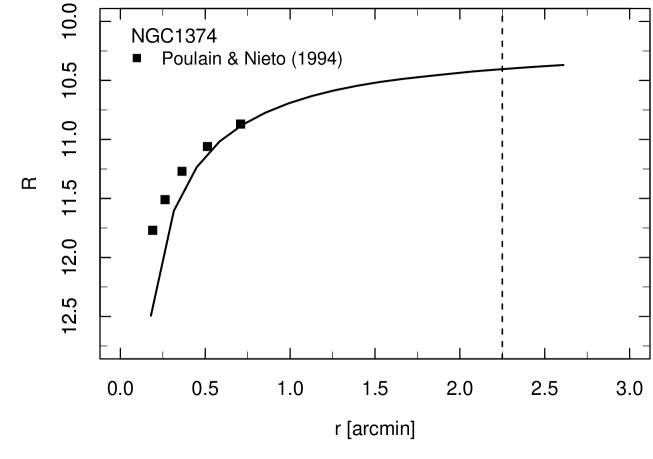
The galaxies brightness profiles were integrated out to the respective radii adopted for each GCS and yield for NGC 1387 ( 3.1 arcmin), for NGC 1379 ( 2.7 arcmin), and for NGC 1374 ( 2.2 arcmin). The uncertainties of the integrated magnitudes arise basically from the standard errors of the respective sky determinations. Our images are saturated at the three galaxy centres, over small regions with radii r 40 pix (about 0.2 arcmin). As we measure integrated magnitudes at larger limiting radii (r = 2.2, 2.7 and 3.1 arcmin), the proportion of light missed at the centres is negligible in comparison to the light integrated up to such limits. The integrated magnitudes were transformed to magnitudes through the zero-point difference () with the purpose of testing them against published multi-aperture photometry from Poulain (1988) and Poulain & Nieto (1994). In Fig. 10 we plot published and calculated integrated magnitudes for NGC 1374, the galaxy with the smallest limiting radius, to show that the differences are evident at inner radii but tend to vanish for r 0.75 arcmin, that is, at a radius much shorter than the limiting one. We do not include the same plots for the other two galaxies as they look very similar.
Adopting as representative colours for the galactic haloes of NGC 1387, NGC 1379 and NGC 1374 the values obtained from the surface brightness profiles: , 1.49, and 1.45, respectively, and applying the colour conversions from Forbes & Forte (2001), we calculate the corresponding magnitudes integrated up to those limiting radii as = 10.52, 10.80, and 10.89, respectively. By means of the adopted SBF distance moduli (Jensen et al. 2003), we finally obtain the integrated absolute magnitude (up to the limiting radii) for NGC 1387, NGC 1379 and NGC 1374: 0.3, 0.2, and 0.1, respectively, whose uncertainties include the uncertainties of the apparent integrated magnitudes and the distance moduli. In this way, the specific frequencies calculated with the GC populations and absolute magnitudes, both estimated up to the same radii, are 1.8 0.7 for NGC 1387, 1.4 0.4 for NGC 1379, and 2.4 0.5 for NGC 1374; the uncertainties are calculated on the basis of the uncertainties of the absolute magnitudes and of the GC populations. Absolute magnitudes and specific frequencies are also given in Table 5.
4 Discussion
4.1 Testing the tidal stripping scenario
The three galaxies under study present several characteristics that point to a particular interpretation. (i) Harris (2003) quote a ‘typical’ specific frequency of for elliptical galaxies but the values determined for NGC 1379, and NGC 1374 are distinctly smaller (NGC 1387 is an S0 galaxy, where a small -value is not unusual) (ii) The GCSs of these three galaxies show a rather small proportion of blue GCs with respect to the total GC population: 24 per cent for NGC 1387, 45 per cent for NGC 1379, and 43 per cent for NGC 1374. (iii) The radial distributions of blue clusters are less concentrated than the red ones with respect to the galaxy light which implies a higher probability for the blues to get lost during tidal stripping processes. (iv) The galaxies are all located close to NGC 1399, a giant elliptical galaxy with a very rich GCS. These properties make it likely that these three galaxies have experienced tidal stripping of their blue GCs by NGC 1399. Kissler–Patig et al. (1999) already suggested that the rich cluster system of NGC 1399 have partly been formed by tidal stripping of GCs from neighbouring galaxies.
Bekki et al. (2003) perform numerical simulations on the tidal stripping and accretion of GCs for the case NGC 1404 and NGC 1399 in Fornax. They propose to test the influence of tidal stripping in low ellipticals that might be involved in such process, looking for ’tidal streams’ of intracluster GCs along the orbit of their former parent galaxy, and checking if there is some correlation between the distance of an elliptical galaxy from the center of the cluster and . With regard to the first test, the GCs around NGC 1399 present asymmetries in their azimuthal projected distribution and a ’bridge’ of blue GCs in the direction to NGC 1387 appear quite distinctly, pointing to an overdensity of GCs in the particular direction. We cannot assure that these GCs have been in fact lost by NGC 1387 as its orbit around NGC 1399 is not known, but being the blue globulars less bound to NGC 1387 than the reds, due to their larger mean distance from the host galaxy, they have a higher probability of being lost.
The other test proposed by Bekki et al. (2003) is to search for a correlation between the of the elliptical galaxies and their projected distances to NGC 1399. Fig. 11 shows such relation for the NGC 1374 and NGC 1379 as well as for NGC 1404 and NGC 1427. Other Fornax galaxies close to NGC 1399 like NGC 1380 and NGC 1387 are not included as they are lenticulars. There seems to be a trend in the sense that galaxies with larger projected distances from the cluster center tend to have higher specific frequencies, but there are only four points in the graph. Previous results related to this test have been presented by Forbes et al. (1997).

Further evidence for this may be expected from kinematical studies of the NGC 1399 system at radii larger than presently available velocities (Richtler et al. 2004).
4.2 The peculiar colour distribution of the GCS in NGC 1387
The colour distribution of the NGC 1387 GCS (see Fig. 6) is peculiar due to the large number of red clusters and also because they extend to redder colours than in most GCSs. One possibility to explain such distribution is the presence of background galaxies that might have been erroneously classified as red GC candidates. No contamination of this type is expected from the results of the background adopted (region ‘a’ in Fig. 4): it can be seen in Fig. 6 that the contribution of objects redder than is very low and does not affect the shape of the red GCs colour distribution. Even if such unresolved galaxies were present in the same area as the GCS, it is shown in Paper I that they would have contaminated the GCs colour range in but not in as they appear at (see Paper I, their fig. 7). Objects with and do not show any concentration towards the target galaxies, like the GC candidates, but they present an homogeneous projected distribution over the whole field considered in the present paper. Thus, we expect the contamination of the red candidates by background galaxies to be low.
The lack of blue GCs may be explained by tidal stripping processes, as mentioned above, but NGC 1387 is an S0 galaxy and alternative explanations may be valid as well. The GCS of the S0 galaxy NGC 1380 in the Fornax cluster has been studied by Kissler–Patig et al. (1997b) and it presents several properties similar to the ones we describe in the NGC 1387 system. The colour distribution of NGC 1380 GCs is clearly bimodal and their and colour histograms (their figs. 3 and 4) show a large number of red GCs that extend to redder colours than the metal-rich population in the Milky Way, like in NGC 1387. The fraction of blue clusters over the total population is small (32 per cent) as well as the specific frequency obtained by Kissler–Patig et al. 1.5 0.5. These similarities between the GCSs of NGC 1380 and NGC 1387 are also evidence that the peculiar GCS colour distribution in NGC 1387 is hardly due to background galaxies.
On the other hand, the blue population of NGC 1380 shows a spherical distribution around the galaxy while the red one follows the stellar light in ellipticity and position angle so they can be associated with the galactic bulge and disc. When we study separately the radial distributions of blue and red GCs in NGC 1387, the blues show no sign of ellipticity and the reds only a marginal evidence, too weak to be significant. In this way, we cannot distinguish between a bulge and disk population. The formation of S0 galaxies is still a matter of discussion. As a class, they are probably not simply gas-stripped spirals (Burstein et al. 2005). However, interaction between galaxies is likely to play a role in their formation history (e.g. Bicker et al. 2003; Shioya et al. 2004; Falcón-Barroso, Peletier & Emsellem et al. 2004). This interaction could have triggered a starburst in NGC 1387, causing the abundant formation of metal-rich clusters. Since NGC 1387 is seen almost face-on, a cluster disk population is not distinguishable from a halo population by its projected spatial distribution. A radial velocity study could reveal whether the metal-rich clusters in NGC 1387 show a disk kinematical behaviour.
4.3 The GCS colour distributions compared to the luminosities of the parent galaxies
In order to analyse the trend of the colours of the blue and red peaks of GCSs with luminosity of the corresponding parent galaxies we present in Table 6 the data obtained from previous Washington photometric studies and from this paper. The sources are detailed in the table.
| Galaxy | Sour.c | ||||
|---|---|---|---|---|---|
| NGC 1374 | 31.32 | -20.22 | 1 | ||
| NGC 1379 | 31.35 | -20.36 | 1 | ||
| NGC 1387 | 31.38 | -20.66 | 1 | ||
| NGC 1399 | 31.02 | -21.53 | 2 | ||
| NGC 1427 | 31.02 | -20.11 | 3 | ||
| NGC 3258 | 32.53 | -21.23 | 4 | ||
| NGC 3268 | 32.71 | -21.41 | 4 | ||
| NGC 3923 | 31.80 | -22.11 | 5 | ||
| NGC 4472 | 31.20 | -22.82 | 6 | ||
| NGC 4636 | 31.24 | -21.73 | 7 |
- a
-
b
calculated with total magnitudes from RC3 catalog and the distance moduli quoted in the second column.
- c
Blue and red peak colours versus visual absolute magnitudes are plotted in Fig. 12. By means of linear fits performed to the data we obtain a slope of 0.02 for the blue peaks and 0.02 for the red ones. The general appearance resembles that found in (Larsen et al. 2001; Kundu & Whitmore 2001a, b): the colour of the red peak depends slightly on the luminosity of the host galaxy, while the blue peak shows a much shallower dependence, reasonably consistent with being constant. The scatter is of the order which can be expected for a inhomogeneous sample and small number statistics cannot be ignored either. The only previous Washington photometric study that has not been included in the sample of GCSs depicted in Table 6 is NGC 3311 as it seems to pose a problem. Secker et al. (1995) claimed that NGC 3311 lacks the population of metal-poor clusters. However, Brodie, Larsen & Kissler–Patig (2000) found the colour distribution quite normal. Since the photometric quality of the Washington photometry was doubtful (Geisler, priv. communication) we excluded this GCS of the selected sample.

That the red peaks have a slight dependence on the host galaxy’s luminosity seems to be plausible: brighter galaxies possess more metal-rich clusters. The well-known relation between brightness and metallicity for early-type galaxies should be somehow reflected in the metallicities of the metal-rich clusters. The constancy of the blue peak has been a matter of discussion. Larsen et al. (2001) find that the blue peak becomes bluer with decreasing galaxy luminosity (by an amount of 0.016 mag in per B-magnitude of the host galaxy), while Kundu & Whitmore (2001a, b) do not see this effect. Given the superior metallicity resolution of the Washington system over , we would expect to uncover a relation if there was any. On the other hand, a constant blue peak does not necessarily mean that all metal-poor GCs have the same metallicity distribution. As mentioned in Dirsch et al. (2003a), a non-linear colour-metallicity relation in combination with a certain scatter around the mean relation (by second parameters or photometric errors) can produce a quite universal blue peak, if a given metallicity distribution is rebinned in colour. The colour-metallicity relation for the Washington system is non-linear (Harris & Harris 2002). Due to its large scatter, the colour-metallicity relation is difficult to calibrate in the metal-poor regime of Galactic globular clusters, but it is reasonable to assume that it also becomes non-linear.
This does not necessarily contradict the results of Strader, Brodie & Forbes (2004), who found a significant relation between the mean blue colours in and galaxy luminosity. They include very faint dwarf galaxies whose cluster systems contain only a few clusters and where the quotation of a ‘peak’ is meaningless.
5 Conclusions
The colour distributions of the GCSs in the low-luminosity galaxies NGC 1387, NGC 1379, and NGC 1374 show a distinctly bimodal appearance; these bimodalities have not been detected in previous work. NGC 1387 even shows a colour bimodality more notably than known from any other GCS. That bimodality is not an exclusive property of the GCSs of giant elliptical galaxies, has already been shown in another Fornax low-luminosity galaxy: NGC 1427 (Forte et al. 2001). Blue and red GC candidates also show different spatial distributions, the red GCs being more centrally concentrated than the blue ones. The appearance of bimodality in our Washington colours probably is a consequence of the superior metallicity resolution of the Washington system with respect to other broad band colours. In fact, all GCSs observed so far in the Washington system revealed bimodal distributions, while in , perhaps due to the inferior metallicity resolution, a certain fraction remained unimodal or unclear (e.g. Larsen et al. 2001; Kundu & Whitmore 2001a, b). One may suspect that a bimodal colour distribution is a property of all GCSs, as long as there is a statistically significant to use this concept. It is therefore desirable to investigate a larger sample of low-luminosity galaxies in the Washington system.
With the aid of the luminosity functions we estimate, for these three low-luminosity galaxies, GC populations between 200 and 400 GCs and specific frequencies in the range = 1.4 – 2.4 , i.e. smaller than the typical values for elliptical galaxies (Harris 2003), though we remind here that NGC 1387 is a S0 galaxy, not an elliptical. Though it is likely that the GCSs under study owe the characteristics of their GC colour distributions and low specific frequencies to some interaction processes, as discussed in the previous section, it is worth to analyze them, in the following, under the hypothesis that they are just regular systems whose properties have not been affected by, for instance, tidal stripping.
The specific frequencies provide us with valuable information related to the efficiency of the galaxies at forming GCs as well as the role the environment might have played during the evolution. For instance, Forbes et al. (2001) found that specific frequencies of red GCs estimated with respect to (only) the ’bulge’ luminosity of spiral galaxies = 0.5 – 1.5 are similar to the ones of red GCs in field ellipticals estimated in the usual way = 1 – 3 (see references in Forbes et al. 2001). It is interesting to note that the specific frequencies we obtain for the red candidates around the ellipticals NGC 1374 () and NGC 1379 () are also close to these ranges which can be considered as an evidence in favour of the Forbes et al. claim that metal-rich GCs in spirals and ellipticals may have the same origin: they are formed with the bulge stars, assuming that ellipticals are bulge-dominated galaxies. The numerical simulations performed by Beasley et al. (2002) on the formation of GCs within a hierarchical Universe also provide theoretical support to this statement.
Let us turn now to the predictions particularly related to low-luminosity galaxies. Forbes et al. (1997) discussed different models for the origin of GCs in giant elliptical galaxies and suggested, as the most probable scenario, the formation of GCs ’in situ’ in two star formation episodes. One of the predictions that results from the Forbes et al. analysis and can be tested through observations, is that low-luminosity, low galaxies should have more metal-rich than metal-poor GCs. This trend is not followed, for example, by NGC 1427 (, Forte et al. 2001) with a blue/red ratio of GCs in the range 3.9 – 4.4, or by NGC 3379 in the Leo I Group (, Rhode & Zepf 2004) with a 70 % of blue GCs with respect to the total globular population. Instead, the three low-luminosity galaxies under study present blue/red ratio in the range 0.3 – 0.8, in agreement with the Forbes at al. predictions. Anyway, we should keep in mind that the low number of blues in these GCSs may be originated in another processes, like tidal stripping, and that one of the galaxies is of S0 type. Thus, our blue/red GC ratios do not provide much evidence in favour of the proposed model.
According to our results, the ‘classic’ interpretation of bimodality as a consequence of merger events which would add a metal-rich GC population to a pre-existing metal-poor GC populations, is doubtful in the case of low-luminosity ellipticals. However, the hierarchical scenario proposed through simulations by Beasley et al. (2002), with blue GCs formed in protogalactic cold-gas fragments and red GCs formed in subsequent gas-rich mergers, leads to bimodal colour distributions in galaxies of all luminosities, even low-luminosity ones. According to Beasley et al. predictions, the metallicity distributions of blue GCs are very similar in low and in more luminous ellipticals. The red GCs in low-luminosity ellipticals, as these galaxies suffer fewer mergers followed by star formation than the luminous ellipticals, present a larger scatter in their mean colours. Both predictions are verified here by the GCSs of the ellipticals NGC 1374 and NGC 1379.
After checking the properties of the GCSs around NGC 1374, NGC 1379 and NGC 1387 against previous observational and theoretical results, we suggest that a plausible scenario of formation and evolution of GCSs which shows reasonably agreement with our results would be a combination of formation in a hierarchical Universe (Beasley et al. 2002) and further tidal stripping, or other sort of interaction processes (Forbes et al. 1997, for instance), originated in their proximity to the giant elliptical NGC 1399. We reiterate that kinematical studies of these GCSs would help to obtain more evidence on the proposed statements.
Acknowledgments
This work was funded with grants from Consejo Nacional de Investigaciones Científicas y Técnicas de la República Argentina, Agencia Nacional de Promoción Científica Tecnológica and Universidad Nacional de La Plata (Argentina), and from the Chilean Centro de Astrofísica FONDAP No. 15010003. LPB is grateful to the Astronomy Group at the Universidad de Concepción for the financial support and warm hospitality.
References
- Ashman & Zepf (1998) Ashman K.M., Zepf S.E., 1998, Globular Clusters Systems, Cambridge University Press, Cambridge
- Barmby, Huchra & Brodie (2001) Barmby P., Huchra J.P., Brodie J.P., 2001, AJ, 121, 1482
- Bassino et al. (2003) Bassino L.P., Cellone S.A., Forte J.C., Dirsch B., 2003, A&A, 399, 489
- Beasley et al. (2002) Beasley, M.A., Baugh, C.M., Forbes, D.A.; Sharples, R.M.; Frenk, C.S., 2002, MNRAS, 333, 383
- Bekki et al. (2003) Bekki K., Forbes D.A., Beasley M.A., Couch W.J., 2003, MNRAS, 344, 1334
- Bertin & Arnouts (1996) Bertin, E., Arnouts, S., 1996, A&AS, 117, 393
- Bicker et al. (2003) Bicker J., Fritze-von Alvensleben U., Fricke K. J. 2003, Ap&SS, 284, 463
- Brodie, Larsen & Kissler–Patig (2000) Brodie J. P., Larsen S.S., Kissler–Patig, ApJ, 543, L19
- Burstein et al. (2005) Burstein D., Ho L.C., Huchra J.P., Makri L.M., 2005, ApJ, 621, 246
- Capuzzo-Dolcetta & Donnarumma (2001) Capuzzo-Dolcetta R., Donnarumma I., 2001, MNRAS, 328, 645
- Dirsch et al. (2003a) Dirsch B., Richtler T., Geisler D., Forte J.C., Bassino L.P., Gieren W.P., 2003a, AJ, 125, 1908
- Dirsch et al. (2003b) Dirsch B., Richtler T., Bassino L.P., 2003b, A&A, 408, 929
- Dirsch et al. (2005) Dirsch B., Schuberth, Y., Richtler, T., 2005, A&A, 433, 43
- Elson et al. (1998) Elson R.A.W., Grillmair C.J., Forbes D.A., Rabban M., Williger G.M., Brodie J.P., 1998, MNRAS, 295, 240
- Falcón-Barroso, Peletier & Emsellem et al. (2004) Falcón-Barroso J., Peletier R.F., Emsellem E. et al. 2004, MNRAS, 305, 35
- Forbes & Forte (2001) Forbes D.A., Forte J.C., 2001, MNRAS, 322, 257
- Forbes et al. (1997) Forbes D.A., Brodie J.P., Grillmair C.J., 1997, AJ, 113, 1652
- Forbes et al. (1998) Forbes D.A., Grillmair C.J., Williger G.M., Elson R.A.W., Brodie J.P., 1998, MNRAS, 293, 325
- Forbes et al. (2001) Forbes D.A., Brodie J.P., Larsen, S.S, 2001, ApJ 556, L83
- Forte et al. (2001) Forte J.C., Geisler D., Ostrov P.G., Piatti A.E., Gieren W., 2001, AJ, 121, 1992
- Geisler (1996) Geisler D., 1996, AJ, 111, 480
- Geisler et al. (1996) Geisler D., Lee, M.G., Kim, E., 1996, AJ, 111, 1529
- Grebel & Richtler (1990) Grebel E.K., Richtler T., 1990, Astron. Gesellschaft Abstract Ser., 5, 90
- Grillmair et al. (1999) Grillmair C.J., Forbes D.A., Brodie J.P., Elson R.A.W., 1999, AJ, 117, 167
- Harris & Canterna (1977) Harris H.C., Canterna R., 1977, AJ, 82, 798
- Harris (2001) Harris W.E., 2001, in L. Labhardt L., Binggeli B., eds, Saas–Fee Advanced Course 28, Star Clusters, Springer–Verlag, Berlin, p. 223
- Harris (2003) Harris W.E., 2003, in Kissler–Patig M., ed,, Extragalactic Globular Cluster Systems, ESO Astrophysics Symposia, Springer–Verlag, Berlin, p. 317
- Harris & Harris (2002) Harris W.E., Harris, G.L.H., 2002, AJ, 123, 3108
- Harris & van den Bergh (1981) Harris W.E., van den Bergh, S., 1981, AJ, 86, 1627
- Jensen et al. (1999) Jensen J.B., Tonry, J.L., Luppino, G.A., 1999, ApJ, 510, 71
- Jensen et al. (2003) Jensen J.B., Tonry J.L., Barris B.J., Thompson R.I., Liu M.C., Rieke M.J., Ajhar E.A., Blakeslee J.P., 2003, ApJ, 583, 712
- Kissler–Patig et al. (1997a) Kissler–Patig M., Kohle S., Hilker M., Richtler T., Infante L., Quintana H., 1997a, A&A, 319, 470
- Kissler–Patig et al. (1997b) Kissler–Patig M., Richtler T., Storm J., Della Valle M., 1997b, A&A, 327, 503
- Kissler–Patig, Forbes & Minniti (1998) Kissler–Patig M., Forbes D.A., Minniti D., 1998, MNRAS, 298, 1123
- Kissler–Patig et al. (1999) Kissler–Patig M., Grillmair C.J., Meylan G., Brodie J.P., Minniti D., Goudfrooij P., 1999, AJ, 117, 1206
- Kohle et al. (1996) Kohle S., Kissler–Patig M., Hilker M., Richtler T., Infante L., Quintana H., 1996, A&A, 309, L39
- Kundu & Whitmore (2001a) Kundu A., Whitmore, B.C., 2001, AJ, 121, 2950
- Kundu & Whitmore (2001b) Kundu A., Whitmore, B.C., 2001, AJ, 122, 1251
- Larsen et al. (2001) Larsen S.S., Brodie J.P., Huchra J.P, Forbes D.A., Grillmair C.J., 2001, AJ, 121, 2974
- Nonino et al. (1999) Nonino M. et al., 1999, A&AS, 137, 51
- Lilly et al. (1995) Lilly S.J., Le Fevre O., Crampton D., Hammer F., Tresse L., 1995, ApJ, 455, 50
- Ostrov et al. (1998) Ostrov P.G., Forte J.C., Geisler D., 1998, AJ, 116, 2854
- Poulain (1988) Poulain, P., 1988, A&AS, 72, 215
- Poulain & Nieto (1994) Poulain, P., Nieto, J.-L., 1994, A&AS, 103, 573
- Reid et al. (1996) Reid I.N., Yan L., Majewski S., Thompson I., Smail I., 1996, AJ, 112, 1472
- Rhode & Zepf (2004) Rhode, K., Zepf, S.E., 2004, AJ, 127, 302
- Richtler (2003) Richtler T., 2003, Lect. Notes Phys., 635, 281
- Richtler et al. (1992) Richtler T., Grebel E.K., Domgörgen H., Hilker M., Kissler–Patig M., 1992, A&A, 264, 25
- Richtler et al. (2004) Richtler T. et al., 2004, AJ, 127, 2094
- Rieke & Lebofsky (1985) Rieke G.H., Lebofsky M.J., 1985, ApJ, 288, 618
- Schlegel et al. (1998) Schlegel D.J., Finkbeiner, D.P., Davis M., 1998, ApJ, 500, 525
- Secker et al. (1995) Secker, J., Geisler, D., McLaughlin, D.E., Harris, W.E., 1995, AJ, 109, 1019
- Shioya et al. (2004) Shioya Y., Beckki K., Couch W.J., 2004, ApJ, 601, 654
- Strader, Brodie & Forbes (2004) Strader, J., Brodie, J.P., Forbes, D.A., 2004, AJ, 127, 295
- Tonry et al. (2001) Tonry, J.L., Dressler, A., Blakeslee, J.P., Ajhar, E.A., Fletcher, A,B., Luppino, G.A., Metzger, M.R., Moore, C.B., 2001, AJ, 546, 681
- West et al. (1995) West M.J., Côtè P., Jones C., Forman W., Marzke R.O., 1995, AJ, 453, L77
- White (1987) White R.E., 1987, MNRAS, 227, 185
- Zepf et al. (1995) Zepf, S.E., Ashman, K.M., Geisler, D., 1995, ApJ, 443, 570