The Transparency of Solar Coronal Active Regions
Abstract
Resonance scattering has often been invoked to explain the disagreement between the observed and predicted line ratios of Fe XVII 15.01 to Fe XVII 15.26 (the “3C/3D” ratio). In this process photons of 15.01, with its much higher oscillator strength, are preferentially scattered out of the line of sight, thus reducing the observed line ratio. Recent laboratory measurements, however, have found significant inner-shell Fe XVI lines at 15.21 and 15.26 Å, suggesting that the observed 3C/3D ratio results from blending. Given our new understanding of the fundamental spectroscopy, we have re-examined the original solar spectra, identifying the Fe XVI 15.21 line and measuring its flux to account for the contribution of Fe XVI to the 15.26 flux. Deblending brings the 3C/3D ratio into good agreement with the experimental ratio; hence, we find no need to invoke resonance scattering. Low opacity in Fe XVII 15.01 also implies low opacity for Fe XV 284.2, ruling out resonance scattering as the cause of the fuzziness of TRACE and SOHO-EIT 284 Å images. The images must, instead, be unresolved due to the large number of structures at this temperature. Insignificant resonance scattering implies that future instruments with higher spatial resolution could resolve the active region plasma into its component loop structures.
1 Introduction
The validity of the optically thin approximation for coronal plasma has been discussed in the literature since the beginnings of solar X-ray and EUV spectroscopy (e.g., Pottasch 1963, and references therein). Resonance scattering of Fe XVII 15.01 (, known as “3C”), in particular, has been the subject of a long-standing controversy. Observations of the ratio of the 3C flux to that of Fe XVII 15.26 (, known as “3D”) gave ratios in the range 1.6 to 2.3 (Rugge & McKenzie 1985; Schmelz et al. 1997; Saba et al. 1999), whereas collisional radiative models predicted a ratio of about four (Smith et al. 1985; Loulergue & Nussbaumer 1973; Bhatia & Doschek 1992; Cornille et al. 1994). Schmelz et al. and Saba et al. also found, using the Flat Crystal Spectrometer (FCS) on the Solar Maximum Mission, that the lowest values were preferentially at the solar limb. This center-to-limb effect bolstered the argument for resonance scattering of 15.01, given that the limb photons traverse a longer path (cf, Phillips et al. 1996).
Significant new results have recently come to light: laboratory measurements from the electron beam ion trap (EBIT) at Lawrence Livermore National Laboratory found the 3C/3D flux ratio to be 3.04 0.12 (Brown et al. 1998). Using the National Institute of Standards and Technology EBIT, Laming et al. (2000) confirmed the value to be close to three. Individual measurements at different beam energies from the two groups span a range from 2.50 to 3.15. These measurements imply that the amount of resonance scattering was overestimated in the solar analyses described above. Furthermore, new theoretical models are converging toward a ratio closer to three (e.g. Doron & Behar 2002; Chen & Pradhan 2002; Gu 2003), though all published models continue to exceed the measurements by at least 10%. New Dirac R-matrix calculation show excellent agreement with the EBIT measurements (Chen 2005; Chen & Pradhan 2005).
Brown et al. (2001) have also reported on experiments in which a steady stream of neutral iron was injected into the EBIT, producing an underionized plasma with both Fe XVI and Fe XVII. They found 3C/3D flux ratios as low as 1.9 0.11, and argued that contamination of Fe XVII 15.26 by the inner-shell Fe XVI line () could account for the discrepancy between the laboratory ratio for a pure Fe XVII plasma and the solar spectra. Blending as an explanation for the solar results presumably implies that the center-to-limb effect in the solar data is due to chance.
New observations of stellar coronae have not confirmed the solar line ratios. Spectra for many stars observed with Chandra and XMM-Newton yield a 3C/3D ratio of about three (Ness et al. 2003; Audard et al. 2004; Güdel et al. 2004), suggesting that stellar coronae do not generally show resonance scattering (but see Testa et al. 2004 and Matranga et al. 2005). Full-star observations cannot rule out resonance scattering in individual active regions, however, since the number of photons scattered out of the line of sight could be offset by a similar number of photons scattered into the line of sight. Furthermore, the sample of stars does not include stars with coronae in the solar coronal temperature range (2–4 MK), such as Centauri or Procyon, for which blending with Fe XVI might be expected.
These new experimental, theoretical, and observational results motivate us to re-investigate solar observations from the Flat Crystal Spectrometer on the Solar Maximum Mission. The reanalysis of these data, using new atomic data, is presented in §2. In §3 we consider the implications of our results. In particular, we find that resonance scattering is not responsible for the fuzziness seen in the solar images obtained with the 284 Å passband of the Transition Region and Coronal Explorer (TRACE) and the EUV Imaging Telescope (EIT) on the Solar and Heliospheric Observatory (SOHO).
2 Analysis
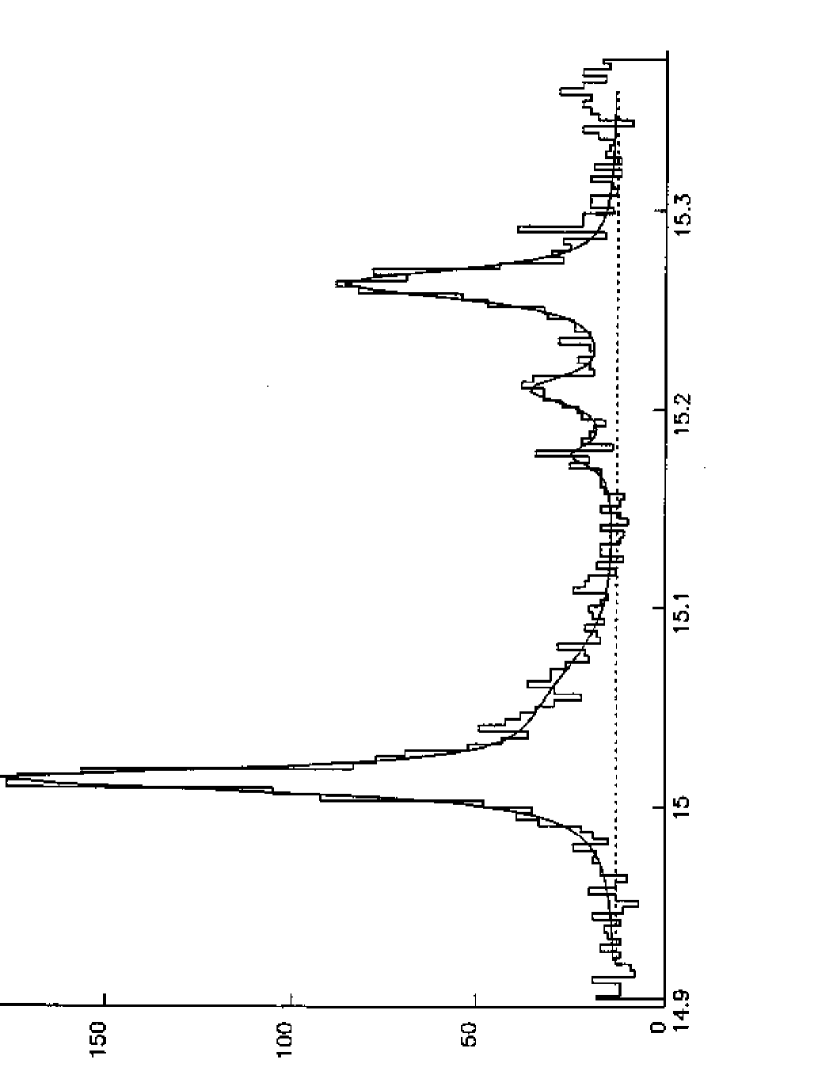
The data analyzed here were obtained with the FCS (Acton et al. 1980) and are discussed in detail in earlier papers (Schmelz et al. 1997; Saba et al. 1999). The instrument had a 15 arcsec field-of-view and could scan the soft X-ray resonance lines of prominent ions in the range of 1.5 Å to 20.0 Å with a spectral resolution of 0.015 Å at 15 Å. In this Letter, we reanalyze the lines from 31 of the 33 spectral scans from quiescent active regions (Fe XVIII 14.21 could not be measured in two of these spectra – see below). Figure 1 shows the portion of a typical FCS spectrum containing the lines of interest. Spectra where plasma conditions were changing significantly with time were excluded from the sample.
The top panel of Figure 2 shows the observed 3C/3D line ratio as a function of temperature. The flux ratio of Fe XVIII 14.21 to Fe XVII 16.78 provides a good temperature diagnostic, with its high signal-to-noise ratio and abundance-insensitivity. Calculations using the Astrophysical Plasma Emission Code (APEC) version 1.3 (Smith et al. 2001) give the temperatures for each of the individual measured flux ratios. The APEC emissivities incorporate the ionization balance models of Mazzotta et al. (1998). Models for the other strong Fe XVII lines, 17.05 and 17.10, are less certain than for 16.78, since these lines have a larger contribution from dielectronic recombination and resulting cascades (see Gu 2003), and hence are more dependent on the ionization state model. The Mg XI and Ne IX G-ratios (i.e. the ratios of the sum of the forbidden plus intercombination line fluxes to the flux of the resonance line) are also temperature-dependent, but are of lower signal-to-noise ratio due to the weakness of the intercombination lines.
Most of the observed 3C/3D ratios are clustered, with significantly less than the average laboratory value of 2.9; however, two of the three highest temperature measurements also give higher 3C/3D ratios, within 1 of 2.9. Moreover, the best-fit line to these data shows a strong temperature-dependence, inconsistent with calculations (Gu 2003), while the flux ratio of 3C to 16.78 (middle panel) shows only modest temperature-dependence as expected from calculations. These results strongly suggest blending of 15.26.
In the underionized EBIT plasma, Brown et al. (2001) also measure a second inner-shell Fe XVI line at 15.21 Å (). We identify this line for the first time in an active region spectrum, and use it to estimate the strength of the Fe XVI blend at 15.26 Å. Fe XVI calculations from the Hebrew University Lawrence Livermore Atomic Code (HULLAC), which will be available in the next APEC release, give a scaling factor of 0.83 (D. Liedahl, private communication). We note that this scaling factor is significantly higher than the factor of 0.5 recommended by Brown et al. (2001) based on multiconfigurational Dirac-Fock calculations, primarily due to a large difference in the branching ratio between radiative decay and autoionization for 15.21 Å.
The bottom panel of Figure 2 shows the line ratios that result after subtracting the Fe XVI 15.26 blend, using Fe XVI 15.21 as a proxy to determine its flux. The weighted mean of this distribution is 2.76 0.23, statistically indistinguishable from the laboratory ratio. While the 15.21 proxy is, to our knowledge, unblended at temperatures below 5 K, its use for hotter plasmas is complicated by the presence of Fe XIX 15.20 (e.g. the Chandra spectrum of Capella, Desai et al. 2005). It seems likely that the line tentatively identified in the flare spectrum by Phillips et al. (1982) as Fe XVI may be dominated by Fe XIX as well.
In light of this new analysis, we reconsider other examples of full-Sun X-ray spectra which include Fe XVII 15.01 and 15.26. In particular, we expect active region measurements to show lower line ratios and flare spectra to approach the laboratory value. Indeed active region measurements show lower 3C/3D values (Blake et al. 1965; Evans & Pounds 1968; Walker et al. 1974), whereas flare spectra (e.g. Neupert et al. 1973) give higher values. These results are thus consistent with Fe XVI blending at 15.26 Å in the low-temperature active region spectra. They also suggest that a reduced ratio might be observed also in high signal-to-noise ratio, high resolution spectra of stars with cooler coronae.
3 Discussion
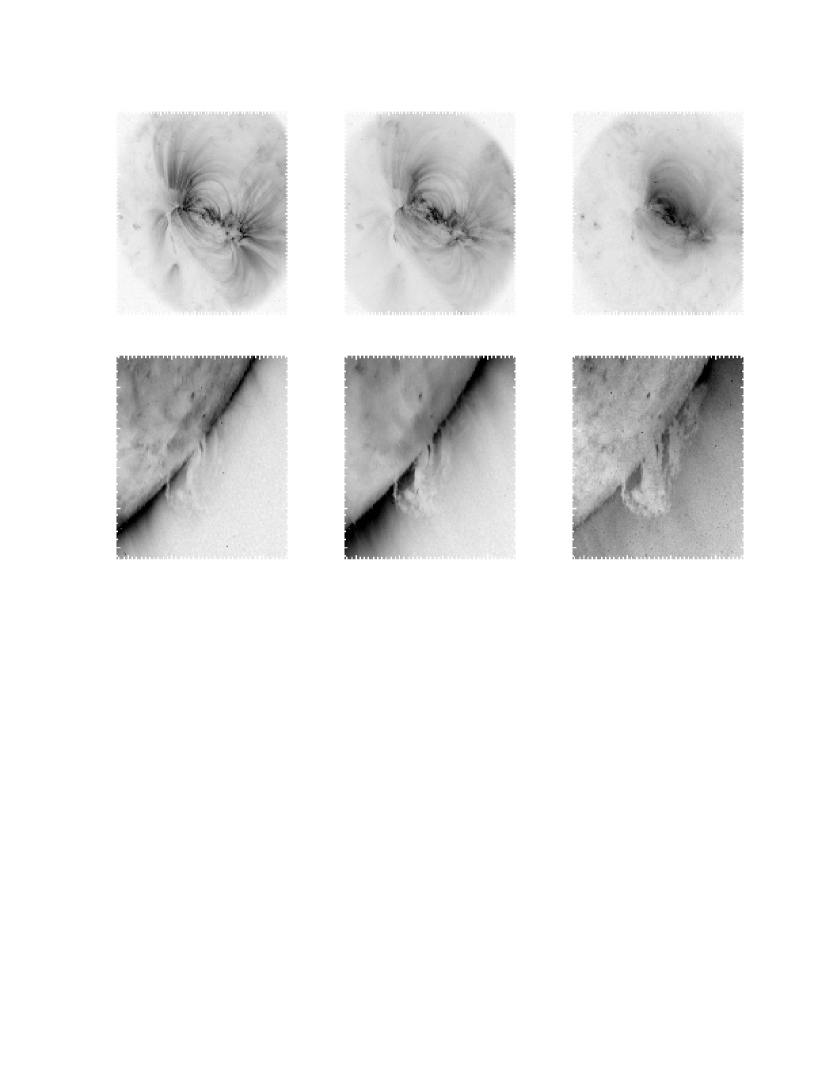
Resonance scattering has been suggested as one of the reasons for the fuzzy appearance of the images obtained from the Fe XV 284 Å passband of TRACE and SOHO-EIT, illustrated in Figure 3. In this section, we discuss possible explanations of the 284-Åfuzziness and estimate the upper limit for the resonance scattering contribution to this fuzziness.
A common explanation for the fuzzy appearance of the TRACE and EIT 284 Å images is instrument scattering; however, measurements of the 284 Å point spread function are identical to those of the 171- and 195 Å passbands, which show much cleaner images (Golub et al. 1998). Furthermore, prominences seen in absorption have sharp edges in the 284 Å images (Fig. 3, lower panel), demonstrating that the instrument can resolve fine structures.
A second candidate explanation is contamination of He II 304 photons in the passband. This contamination certainly exists for coronal holes, which do not appear dark (as they do, for example, in the thin Aluminum images from the Soft X-ray Telescope on Yohkoh); however, there should be no significant 304-contribution in active region areas because of the higher temperatures, or above the solar limb where the scale height of 304 is too small.
Resonance scattering has also been suggested as the cause of the TRACE 284 Å fuzziness. The Fe XVII 15.01 result allows us to estimate the contribution of resonance scattering to Fe XV 284.2. Using Chen’s (2005) calculated 3C/3D ratio of 2.85 at 6.4, and the observed FCS ratio of 2.76 0.21 gives an escape probability of 2.76/2.85, corresponding to . Following Acton (1978), , where is the oscillator strength, is the ionization fraction (which is a function of temperature), and is the wavelength. Solving for , with the ionization balance at 6.4, gives
| (1) |
| (2) |
This corresponds to an escape probability of 92%, which indicates that very few photons are available to contribute to the 284 Å-image fuzziness. For possible uncertainties of 10 to 15 % in experimental and theoretical 3C/3D ratios, the escape probability ranges from 0.84 to 1.0, for . Using the same argument, with the relative coronal abundances of Fludra & Schmelz (1999), we find that the O VIII 18.97 opacity is comparable to that of 15.01, while the opacities of Ne IX 13.46 and Mg XI 9.17 are 2 to 3 times lower, confirming the findings of Schmelz et al. (1997) that these important diagnostics are not contaminated for use in emission measure distribution analysis.
The assumed temperature , estimated from the measured ratios of Fe XVIII 14.21 to Fe XVII 16.78, can be further constrained by the laboratory measurements. The experimental 3C/3D ratio was measured as a function of the abundance ratio of Fe XVI to Fe XVII, providing a good fit to the theoretical predictions. The experimental plasma is not in collisional ionization equilibrium, due to the continuous ionization from neutral iron up to the charge states of interest, and moreover, the collisional processes are excited by a narrow beam rather than a Maxwellian distribution as assumed for the solar coronal plasma. Thus, an interpretation of the experimental line ratio in terms of an ionization equilibrium temperature is not strictly valid, since the resonance excitation contributions will not be identical. Nevertheless, this estimate can give a consistency check on the Fe XV population. For the laboratory value where the populations of Fe XVI and Fe XVII are equal, the 3C/3D ratio is 1.90 0.11 (Brown et al. 2001), slightly below the average of the cluster. Thus the diagnostics all appear consistent with each other in the blending scenario.
In collisional ionization equilibrium, such a ratio corresponds to 6.32. For this lower temperature, is about 3 times larger; however, Chen’s (2005) predicted line ratio is about 5% less, such that our average value puts essentially at zero, with an upper limit below 0.2. Meanwhile, loop differential emission measure (DEM) distributions tend to be fairly flat-topped between 6.3 and 6.4 (e.g. Schmelz et al. 2001), such that an intermediate value seems most reliable for estimating the ratio. We then find 0.12, with a plausible range from 0.0 to 0.2. For opacities in this range, the model images of Wood & Raymond (2000) still retain the appearance of loops with sharp rather than blurred boundaries.
We refer to the last candidate explanation for the 284 Å-fuzziness as the “filling-factor” model, which is related to the observational result that coronal structures appear fuzzy if they are not resolved by the instrument (see Fig. 3 of Deluca et al. 2005). It is well established that the DEM of active region and quiet Sun plasma peaks between 2 and 3 MK. In other words, more higher temperature (284 Å) plasma exists along the line of sight than cooler (171 Å) plasma, such that the piling up of structures along the line of sight may contribute to the fuzziness factor. In the 171-Å band (1 MK), the 0.5-arcsec resolution of TRACE revealed substantial substructure that had never been seen before; in the 284-Å band (2–3 MK), the spatial resolution does not appear to be quite sufficient. An additional factor of two improvement in spatial resolution may be adequate, but 0.1-arcsec pixel size is technically feasible and seems preferable.
We conclude, therefore, that the filling-factor model provides the most likely explanation for the 284-image fuzziness, and thus future instruments with higher spatial resolution may be able to resolve the active region plasma into its component structures. Efforts to understand the coronal heating process should benefit from resolved images closer to the temperature at which the dominant heating occurs.
We would like to thank J. Saba, K. Nasraoui, D. Liedahl, L. Golub, and J. Cirtain. Solar physics research at the University of Memphis is supported by NSF ATM-0402729 and NASA NNG05GE68G. N. B. was supported by NASA contract NAS8-39073 to the Smithsonian Astrophysical Observatory for the Chandra X-ray Center.
References
- (1) Acton, L. W. 1978, ApJ, 225, 1069
- (2) Acton, L. W. et al. 1980, Sol. Phys., 65, 53
- (3) Audard, M., Telleschi, A., Güdel, M., Skinner, S. L., Pallavicini, R., & Mitra-Kraev, U. 2004, ApJ, 617, 531
- (4) Bhatia, A. K. & Doschek, G. A. 1992, Atomic Data Nuclear Data, 52, 1
- (5) Blake, R. L., Chubb, T. A., Friedman, H., Unzicker, A. E. 1965, ApJ, 142, 1
- (6) Brown, G. V., Beiersdorfer, P., Chen, H., Chen, M. H., Reed, K. J. 2001, ApJ, 557, L75
- (7) Brown, G. V., Beiersdorfer, P., Liedahl, D. A., Widmann, K., Kahn, S. M. 1998, ApJ, 502, 1015
- (8) Chen, G.-X. 2005, submitted
- (9) Chen, G. X., & Pradhan, A. K. 2002, Phys. Rev. Lett., 89, 13202
- (10) Chen, G. X., & Pradhan, A. K. 2005, MNRAS, submitted
- (11) Cornille, M., Dubau, J., Faucher, P., Bely-Dubau, F., & Blancard, C. 1994, A&A, 1, 1
- (12) Deluca, E.E., Weber, M.A., Sette, A.L., Golub, L., Shibasaki, K., Sakao, T. & Kano, R. 2005, Adv. Space Res., in press
- (13) Desai, P. et al. 2005, ApJ, 625, L59
- (14) Doron, R. & Behar, E. 2002, ApJ, 574, 518
- (15) Evans, K. & Pounds, K. A. 1968, ApJ, 152, 319
- (16) Fludra, A. & Schmelz, J. T. (1999), A&A, 348, 286
- (17) Golub, L. et al. 1999, Phys. Plasmas, 6, 2205
- (18) Gu, M.-F. 2003, ApJ, 582, 1241
- (19) Güdel, M., Audard, M., Reale, F., Skinner, S. L., Linsky, J. L. 2004, A&A,416, 713
- (20) Laming, J. M. et al. 2000, ApJ, 545, L161
- (21) Loulergue, M. & Nussbaumer, H. 1973, A&A, 45, 125
- (22) Matranga, M., Mathioudakis, M., Kay, H. R. M., & Keenan, F. P. 2005, ApJ, 621, L125
- (23) Mazzotta, P., Mazzitelli, G., Colafrancesco, S., & Vittorio, N. 1998, A&A, 133, 403
- (24) Ness, J.-U., Schmitt, J. H. M. M., Audard, M. J., Güdel, M., & Mewe, R. 2003, A&A, 407, 347
- (25) Neupert, W.M., Swartz, M., Kastner, S O. 1973, Sol. Phys., 31, 171
- (26) Phillips, K. J. H., Greer, C. J., Bhatia, A. K., Keenan, F. P. 1996, ApJ, 469, L57
- (27) Phillips, K. J. H. et al. 1982, ApJ, 256, 774
- (28) Pottasch, S. R. 1963, ApJ, 137, 945
- (29) Rugge, H. R. & McKenzie, D. L. 1985, ApJ, 297, 338
- (30) Saba, J. L. R., Schmelz, J. T., Bhatia, A. K., & Strong, K. T. 1999, ApJ, 510, 1064
- (31) Schmelz, J. T., Saba, J. L. R., Chauvin, J. C., & Strong, K. T. 1997, ApJ, 477, 509
- (32) Schmelz, J. T., Scopes, R. T., Cirtain, J. W., Winter, H. D., & Allen, J. D. 2001, ApJ, 556, 896
- (33) Smith, B. W., Raymond, J. C., Mann, J. B., & Cowan, R. D. 1985, ApJ, 298, 898
- (34) Smith, R. K., Brickhouse, N. S., Liedahl, D. A., & Raymond, J. C. 2001, ApJ, 556, L91
- (35) Testa, P., Drake, J. J., Peres, G., & Deluca, E. E. 2004, ApJ, 609, L79
- (36) Walker, A. B. C., Rugge, H. R., Weiss, K. 1974, ApJ, 194, 471
- (37) Wood, K., & Raymond, J. C. 2000, ApJ, 540, 563