Iron depletion in the hot bubbles in planetary nebulae 111Based upon observations obtained at the Observatorio Astronmico Nacional in San Pedro Mártir, Baja California, Mexico ,222Based on observations obtained with XMM-Newton, an ESA science mission with instruments and contributions directly funded by ESA Member States and NASA
Abstract
We have searched for the emission from [Fe X]6374 and [Fe XIV]5303 that is expected from the gas emitting in diffuse X-rays in BD+30∘3639, NGC 6543, NGC 7009, and NGC 7027. Neither line was detected in any object. Models that fit the X-ray spectra of these objects indicate that the [Fe X]6374 emission should be below our detection thresholds, but the predicted [Fe XIV]5303 emission exceeds our observed upper limits (one sigma) by factors of at least 3.5 to 12. The best explanation for the absence of [Fe XIV]5303 is that the X-ray plasma is depleted in iron. In principle, this result provides a clear chemical signature that may be used to determine the origin of the X-ray gas in either the nebular gas or the stellar wind. At present, though various lines of evidence appear to favour a nebular origin, the lack of atmospheric and nebular iron abundances in the objects studied here precludes a definitive conclusion.
1 Introduction
| Date (UT) | Object | Slit PAa | Slit size | Slit center | Exposures |
|---|---|---|---|---|---|
| 26 May 2004 | NGC 6543 | 10∘ | the star | s | |
| 27 May 2004 | NGC 6543 | 43∘ | the star | s | |
| 30 May 2004 | BD+30∘3639 | 0∘ | 1 east from the star | s | |
| 2 Aug 2004 | NGC 7027 | 138∘ | the bright spot | s | |
| 3 Aug 2004 | NGC 7009 | 72∘ | the star | s | |
| 4 Aug 2004 | NGC 7009 | 162∘ | the star | s |
-
a
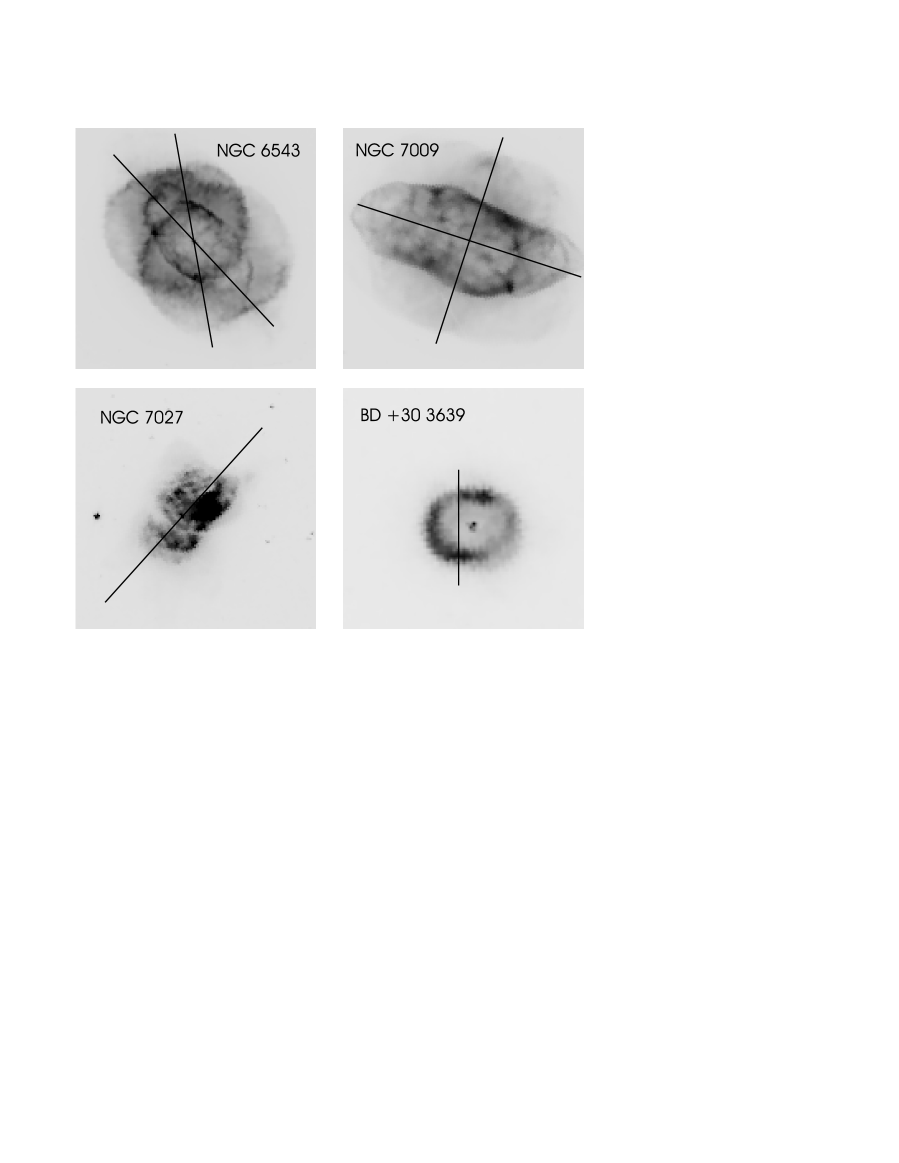
The positions are shown in Fig. 1. The position angle follows astronomical convention, measured north through east.
Planetary nebulae, one of the final evolutionary phases for low- and intermediate-mass stars, are believed to be formed as a result of the interaction of the fast wind expelled by the central star with a slow wind expelled at the AGB phase (Kwok et al., 1978). The strong interaction between these two winds produces a bubble of shock-heated gas whose temperature, according to the fast wind velocity, is expected to be several times K. The first diffuse X-ray emission observed from planetary nebulae by the ROSAT satellite (ROSAT detected only spectral evidence for nebular emission from PNe but did not spatially resolve it), the Chandra X-ray Observatory, and XMM-Newton was very surprising because the observed temperatures of the X-ray-emitting gas were K, up to an order of magnitude lower than expected (Kreysing et al., 1992; Guerrero et al., 2000; Kastner at el., 2000; Chu et al., 2001; Kastner et al., 2001; Guerrero et al., 2002). Since then, diffuse X-rays have been observed in Mz 3, Hen 3-1475, and NGC 2392 (Kastner et al., 2003; Sahai et al., 2003; Guerrero et al., 2005, respectively). Of these, the first two have temperatures as high or higher than previously observed while the X-ray emission in NGC 2392 is characterized by a temperature of K, which is approximately the temperature expected given the current wind velocity of its central star.
The generally low temperature of the gas emitting X-rays raises the problem of cooling this gas to the observed temperatures. Since the hot gas is in contact with the “cold” optical shell, thermal conduction may play an important role and may lower the gas temperature of the hot bubble, thereby solving the “softness” problem in the X-ray spectra of PNe (Soker, 1994; Zhekov & Perinotto, 1998). Soker & Kastner (2003) discussed several “cooling” mechanisms ranging from thermal conduction and fluid mixing of X-ray-emitting and nebular material to the effects of adiabatic expansion, winds, and jets. Other processes, such as the influence of magnetic fields, e.g., Różyczka and Franco (1996), have yet to be investigated. The cooling mechanism could be related to the gas distribution. Kastner et al. (2002) present high resolution images that appear to indicate that the X-ray emission is generally limb-brightened, but it is difficult to know the precise geometry of the X-ray-emitting gas because extinction by dust within the individual nebulae apparently severely distorts the X-ray maps.
As demonstrated by the models of Zhekov & Perinotto (1996), this gas should also emit in collisionally-excited, “coronal” lines of highly ionized species. The two brightest coronal emission lines in the optical range are [Fe X]6374 and [Fe XIV]5303 (Zhekov & Perinotto, 1996). If detected in planetary nebulae, a measurement of their intensities would provide valuable information about the physical properties of the emitting plasma.
In this paper, we present observations of [Fe X]6374 and [Fe XIV]5303 in BD+30∘3639, NGC 6543, NGC 7009, and NGC 7027. All of these objects have been found to contain diffuse X-rays with either the Chandra X-ray Observatory or XMM-Newton. Throughout, we adopt wavelengths of 6374.51Å and 5302.86Å for [Fe X]6374 and [Fe XIV]5303, respectively (Träbert, 2004). The observations and reductions are described in Sect. 2. The results, null detections, are presented in Sect. 3. A discussion of the implications follows in Sect. 4 and Sect. 5. Conclusions are presented in Sect. 6.
2 Observations and Reductions
Our observations were obtained on 2004 May 26-27 and 2004 August 2-4 (UT) with the REOSC echelle spectrograph on the 2.1-m telescope of the Observatorio Astronómico Nacional in San Pedro Mártir, Baja California, Mexico (SPM). This is a conventional, cross-dispersed echelle spectrograph whose dispersion is 0.190 Å/pix and 0.228 Å/pix at 5303Å and 6374Å, respectively (a resolution, , of about for the 2.5-2.7 pix FWHM of arc lines).For observations of the standard stars, the slit width was 11″. The slit was oriented so as to cover various regions of interest within each object (see Fig. 1) 333The images used in Fig. 1 are based upon observations made with the NASA/ESA Hubble Space Telescope, obtained from the data archive at the Space Telescope Science Institute. STScI is operated by the Association of Universities for Research in Astronomy, Inc. under NASA contract NAS 5-26555. In the case of NGC 7027, the position angle was chosen to approximately coincide with the position angle of the X-ray emission and was centered on the bright optical spot of the nebula. A GG395 filter was used to remove second order contamination for [Fe X]6374. The detector was a SITe CCD with 24m pixels. In the gain setting used, the CCD’s readnoise was approximately 9 electrons. The spectrograph was configured so that emission from H did not fall on the detector. Nonetheless, some of its scattered light unavoidably contaminated the adjacent order containing [Fe X]6374. Table 1 presents a log of the observations.
The data were reduced with IRAF 444IRAF is distributed by the National Optical Astronomy Observatories, which are operated by the Association of Universities for Research in Astronomy, Inc., under cooperative agreement with the National Science Foundation.. The initial step consisted of cleaning the spectra of the planetary nebulae of cosmic rays. Each night, bias images were obtained and used to construct a zero correction image that was subtracted from all exposures. Observations of standard stars were used to trace the positions and shapes of each order. For the planetary nebulae, these aperture definitions were shifted to the appropriate positions within the slit without changing the aperture shapes. When extracting the spectra of the standard stars, the inter-order background resulting from scattered light was subtracted. This step was omitted for the spectra of the planetary nebulae since the scattered light was negligible. The sky emission was not subtracted, but this poses no problem for our purposes. Spectra of a thorium-argon lamp were obtained as needed for wavelength calibration. The spectra of the standard stars were used to determine the instrumental sensitivity function within each order to provide a flux calibration. The atmospheric extinction was corrected using the published extinction curve for SPM (Schuster & Parrao, 2001).
3 Results
3.1 Upper limits to the intensities of [Fe X]6374 and [Fe XIV]5303
Particular care is required in the search for [Fe X]6374 and [Fe XIV]5303. The [Fe X]6374 line almost exactly coincides with emission from He I3187 in second order, so an order sorting filter is absolutely essential. Given the faintness of the [Fe X]6374 line and the abundance of other very faint lines, such as O i6374.32, only 0.19Å distant from [Fe X]6374, a spectral resolution of 15,000-20,000 is required to assure sufficiently precise wavelength calibration and line identification. Such resolution is normally achieved via echelle spectroscopy. If H is found in the order adjacent to the [Fe X]6374 line, as is the case with our observations, scattered light will be a significant problem, even if H is not included in the echellogram. Ideally, the light entering the spectrograph should be filtered so as to exclude strong lines since they can be sources of scattered light. For [Fe XIV]5303, there are no problems with either second order contamination or bright lines in adjacent orders, but a high dispersion is nonetheless necessary to discriminate it from other faint lines, e.g., C iii5304.54, 5304.93, 5305.53 (see Fig. 2). Finally, when the central star is visible, it is necessary to consider the emission observed when the slit area including the central star is both included and excluded since faint, broad stellar lines may also cause confusion.
To help minimize confusion between [Fe X]6374 or [Fe XIV]5303 and other faint lines, we corrected the spectra of each object to zero velocity using other lines observed in the same order as the lines of interest. In the case of [Fe XIV]5303, we used the lines of [Cl IV]5323.3, [Fe II]5333.7, [Fe VI]5335.3, C II5342.5, and [Kr IV]5346.0, e.g., Péquignot & Baluteau (1994), all of which appear in the same order. In some cases, a faint line is detected near the wavelength expected for [Fe XIV]5303 (Fig. 2), but its wavelength is redshifted and coincides with that expected for C III5304.54, 5304.93, 5305.53. It is clear that the lines near [Fe XIV]5303 belong to C III, since they are present in the three objects in which He II lines are also observed, but not in BD+30∘3639 where He II is absent. In the case of [Fe X]6374, we used the nearby line of Si II6371.4 to define the zero point of the velocity scale.
To further decrease confusion from other small signals, for all objects, we fit and subtracted the stellar and nebular continua from each line of the two-dimensional spectra along the dispersion axis. In the case of BD+30∘3639, the very strong, broad, stellar WR emission feature resulting from the C III lines coincides with [Fe XIV]5303 (c.f., Acker & Neiner, 2003). This stellar emission feature was fit as part of the continuum and subtracted. The stellar C III emission seen in the top spectrum of NGC 6543 in Fig. 2 is much, much weaker than that in the spectrum of BD+30∘3639 and was not subtracted because it would not obscure any significant [Fe XIV]5303 emission. We then summed the corrected spectra along the spatial axis, including and excluding the slit area occupied by the central star, before attempting to measure the line intensities. Even so, definite detections were not found and only upper limits could be derived. We derived one sigma upper limits by computing the standard deviation of the noise about the mean continuum level. We then obtained the upper limits of the line intensities multiplying this noise amplitude by the Gaussian width of a nearby line.


The intensity limits observed for [Fe XIV]5303, , may be found in Table 2. In this table, we present a single line intensity limit for NGC 6543 and NGC 7009 since the limits observed in both slit positions were similar. Fig. 2 presents continuum-subtracted portions of the spectra in the vicinity of [Fe XIV]5303 in all of the objects observed. The spectra in Fig. 2 are integrated over the entire slit, except in the case of NGC 6543, where the sums including and excluding the central star are shown separately. The position of [Fe XIV]5303 is indicated by a vertical bar and it is clear that [Fe XIV]5303 was not detected in any object, though C III5304.54,5304.93,5305.53 are, as previously noted. We present neither spectra nor line intensity limits for [Fe X]6374 since this line was never detected and the noise limits are similar to those for [Fe XIV]5303. Since [Fe X]6374 is expected to be about 100 times fainter than [Fe XIV]5303 (Section 3.2), our flux limits for [Fe X]6374 do not provide us with any additional information.
Table 2 also presents reddening-corrected line intensity limits for later comparison with model predictions of the [Fe XIV]5303 intensity. The reddening-corrected flux limits, , are calculated from the observed flux limits, , according to
| (1) |
where is the reddening and mag is the Fitzpatrick (1999) reddening value, parametrized with a value of the total-to-selective extinction of 3.041 (McCall & Armour, 2000). For BD+30∘3639 and NGC 7027, where there are significant, small scale variations in reddening (Kastner et al., 2002), we provide the range of reddenings within our slit and the corresponding reddening-corrected fluxes as ranges in Table 2.
| Object | |||
|---|---|---|---|
| erg s-1 cm-2 | mag | erg s-1 cm-2 | |
| BD+30∘3639 | 0.49 [0.23-0.66] | [] | |
| NGC 6543 | 0.21 | ||
| NGC 7009 | 0.11 | ||
| NGC 7027 | 0.99 [0.49-1.97] | [] |
3.2 Expected intensities of [Fe X]6374 and [Fe XIV]5303
Since we detected neither [Fe X]6374 nor [Fe XIV]5303 in any of the objects we observed, it is interesting to compute the intensities expected for these lines. Our estimate is based upon the observed X-ray spectrum since the hot bubble that emits the X-rays is the source for coronal line emission as well. We adopted the following procedure to compute the intensity of [Fe X]6374 and [Fe XIV]5303. First, from the X-ray spectrum extracted for the entire object, we derived the plasma parameters (temperature, abundances, and the emission measure) required to explain its X-ray emission. Second, we re-scaled the emission measure to the size of the slit used for our optical observations. Finally, based upon the emission measure “in the slit” and the plasma temperature of the hot gas, we estimated the emission for [Fe X]6374 and [Fe XIV]5303 using the same optically-thin plasma model that was used to derive the plasma parameters in the first step.
All the necessary X-ray data were obtained from the Chandra (NGC 6543: Chandra ObsId 630 (catalog ADS/Sa.CXO#obs/00630); BD303639: Chandra ObsId 587 (catalog ADS/Sa.CXO#obs/00587); and NGC 7027: Chandra ObsId 588 (catalog ADS/Sa.CXO#obs/00588)) and XMM-Newton (NGC 7009) science archives. The Chandra observations were carried out with the ACIS-S detector and the corresponding Science Threads for Image Spectroscopy in CIAO 3.2 555Chandra Interactive Analysis of Observations (CIAO), http://cxc.harvard.edu/ciao/ were used for extracting the X-ray spectra. For the XMM-Newton observation of NGC 7009, the most recent version of SAS 6.1.0 666XMM-Newton Science Analysis System (SAS), http://xmm.vilspa.esa.es/external/xmmswcal/sasframe.shtml was used for the spectral extraction. Given the goal of our study, only the EPIC PN spectrum was used in the following analysis due to its better photon statistics compared to those of the EPIC MOS1 and MOS2. The periods of high background count rates were excluded from the EPIC PN data. Finally, for each object, X-ray spectra were extracted corresponding to the entire object and that part within the optical slit. The X-ray spectra were fit within XSPEC 11.3 (Arnaud, 1996) using the vapec model for the emission from optically-thin plasma.
We note that the derived parameters of the X-ray emitting plasma do not depend on this choice and using a different model (e.g. vmekal) leads to the same results within the expected uncertainties777For each data set, we performed various tests by fitting the spectra both with vapec and vmekal. The differences between the derived plasma temperatures and X-ray absorptions from the both plasma models were less than 4%, and the abundances overlap within the corresponding 90% confidence limits. General comments on such comaprisons can be found in http://cxc.harvard.edu/atomdb/issuescomparisons.html . Thus, the vapec model was chosen to make calculations of the [Fe X]6374 and [Fe XIV]5303 emissions technically more straightforward. The hot plasma abundances were taken from Maness & Vrtilek (2003) for NGC 6543, from Maness et al. (2003) for NGC 7027, and from Guerrero et al. (2002) for NGC 7009. For BD+30∘3639, two abundance sets were used, the first being a variant of the Maness et al. (2003) abundance set (fourth column in Table 3; henceforth, we denote this set as ‘wind’ abundances) and the second a new set derived here (last column in Table 3; ‘nebular’ abundances) based partly upon the nebular abundances of Aller & Hyung (1995) and which have values similar to the ‘nebular’ abundances derived by Arnaud et al. (1996) from the analysis of the ASCA data of this object. The two fits are indistinguishable in fitting the data. Figure 3 presents our fits to the X-ray spectra. The parameters used in these fits, including elemental abundances, are listed in Tables 3 and 4. Our fits to the total X-ray spectra of these PNe are consistent with those obtained by other groups using the same data sets. Finally, we note that, if the Gorenstein (1975) conversion is used, cm-2, the column densities derived for the X-ray absorption are consistent with those from the optical extinction.
Before proceeding to the predicted [Fe X]6374 and [Fe XIV]5303 fluxes, a few comments are necessary regarding BD+30∘3639 and NGC 7027. As noted above, the two abundance sets used for BD+30∘3639 produce fits to the total X-ray spectrum that are equally good (Table 3, Fig. 3). This clearly demonstrates the limitations of attempting to constrain the hot-plasma abundances in this object from the available data. In contrast to Maness et al. (2003), our ‘wind’ abundance set uses an Fe abundance of 1.0 with respect to solar, rather than an abundance of 0.0, chosen simply to illustrate that the current data do not constrain the iron abundance in this case. It fact, Maness et al. (2003) did not derive the iron abundance, but postulated it equal to 0.0 with respect to solar). On the other hand, an iron abundance of 0.0 is derived only if ‘nebular’ abundances are used, and, in this case, the solar value of 1.0 for iron abundance is incompatible with the data, as the last column in 3 makes clear. So, this experiment demonstrates that the spectrum may be fit using plasma with iron abundances between zero and the solar value. As for NGC 7027, our experiments in fitting its X-ray spectrum demonstrate the limitations of the low counting statistics in this spectrum (Table 4, Fig. 4). The plasma temperature was set at four steps to explore the range of values from previous analyses (kT = 0.26 keV Kastner et al. (2001); kT = 0.72 keV Maness et al. (2003)) and the spectrum fit with a lower number of free parameters. We finally adopted the fit presented in the last column of Table 4, since these parameters nominally produce the best fit.


| NGC 6543 | NGC 7009 | BD+30∘3639f | BD+30∘3639g | |
|---|---|---|---|---|
| Counts b | 1551 | 1891 | 4569 | 4569 |
| Exposure (ks) | 46.0 | 31.5 c | 18.9 | 18.9 |
| /dof | 42.4/39 | 62.8/65 | 86.8/73 | 83.7/71 |
| NH(1021 cm-2) | 0.0 [0.0 - 0.4] | 0.38 [0.19 - 0.62] | 2.0 [1.7 - 2.3] | 2.0 [1.5 - 2.2] |
| kT (keV) | 0.15 [0.14 - 0.16] | 0.19 [0.18 - 0.20] | 0.20 [0.18 - 0.22] | 0.19 [0.15 - 0.22] |
| H | 1 | 1 | 1 | 1 |
| He | 1 | 1.33 | 1 | 1 |
| C | 0.69 | 0.8 | 348 [101 - 1000] | 3.70 [0.39 - 1000] |
| N | 1.40 [0.68 - 2.06] | 1.9 | 20.8 [15.8 - 98.5] | [0.15 [0.02 - 71.7] |
| O | 0.38 [0.26 - 0.52] | 0.44 [0.33 - 0.58] | 3.6 [1.23 - 12.4] | 0.05 [0.02 - 11.6] |
| Ne | 1.08 [0.44 - 2.15] | 0.77 [ 0.35 - 1.28] | 19.3 [6.6 - 71.0] | 0.32 [0.14 -69.1] |
| Mg | 1 | 1 | 1 | 0.15 [0.0 - 69.1] |
| Si | 1 | 1 | 1 | 1 |
| S | 0.56 | 1.2 | 1 | 0.33 |
| Ar | 1.55 | 1 | 1 | 0.05 |
| Ca | 1 | 1 | 1 | 1 |
| Fe | 1 | 1 | 1 | 0.0 [0.0 - 0.29] |
| Ni | 1 | 1 | 1 | 1 |
| normd | ||||
| FX(0.3-2 keV)e | 1.05 | 0.82 | 6.41 | 6.49 |


| NGC 7027 | NGC 7027 | NGC 7027 | NGC 7027 | |
|---|---|---|---|---|
| Counts b | 278 | 278 | 278 | 278 |
| Exposure (ks) | 18.2 | 18.2 | 18.2 | 18.2 |
| /dof | 11.1/19 | 11.1/19 | 10.3/19 | 9.0/19 |
| NH(1021 cm-2) | 10.4 [8.3 - 12.4] | 6.4 [3.7 - 8.5] | 5.0 [0. - 7.4] | 4.3 [0. - 6.1] |
| kT (keV) | 0.2 | 0.4 | 0.6 | 0.8 |
| H | 1 | 1 | 1 | 1 |
| He | 1.08 | 1.08 | 1.08 | 1.08 |
| C | 1.69 | 1.69 | 1.69 | 1.69 |
| N | 1.71 | 1.71 | 1.71 | 1.71 |
| O | 3.9 [0.45 - 96.6] | 10.0 [1.4 - 48.0] | 8.8 [1.1 - 36.8] | 10.0 [0.8 - 28.9] |
| Ne | 2.7 [0.44 - 1000] | 5.9 [1.2 - 896] | 3.9 [0. - 13.5] | 0. [0. - 9.7] |
| Mg | 3.6 [0 - 1000] | 4.8 [0. - 869] | 3.4 [0. - 29.8] | 2.2 [0. - 11.7] |
| Si | 0.17 | 0.17 | 0.17 | 0.17 |
| S | 0.51 | 0.51 | 0.51 | 0.51 |
| Ar | 0.63 | 0.63 | 0.63 | 0.63 |
| Ca | 1 | 1 | 1 | 1 |
| Fe | 1 | 1 | 1 | 1 |
| Ni | 1 | 1 | 1 | 1 |
| normc | ||||
| FX(0.3-2 keV)d | 0.37 | 0.38 | 0.38 | 0.39 |
The fluxes in [Fe X]6374 and [Fe XIV]5303 predicted for the four objects under study are given in Table 5. The model [Fe XIV]5303 flux is linearly proportional to the iron abundance and all of the predicted fluxes are based upon models with a solar iron abundance. The same plasma model that was used to fit the X-ray spectra was used for estimating the fluxes of coronal line emission for [Fe X]6374 and [Fe XIV]5303, the only difference being to re-scale the emission measure to account for the fraction of the object included in the optical spectroscopy. The scaling procedure was internally checked for consistency by (i) comparing the number of photons in the total and “slit” X-ray spectra and (ii) fixing the model parameters to their values from the fit to the total spectrum and varying only the normalization. Both approaches gave identical results (identical spectral normalization parameter). An important advantage of estimating the coronal line emission using the fit to the X-ray spectrum is that uncertainties in the distance to object disappear, due to the definition of the normalization parameter for the fit to the X-ray spectrum, cm-5, being the emission measure of the hot gas and the distance to the object. In this way, the predicted X-ray spectrum and the predicted flux in coronal lines are internally consistent. The fluxes in Table 5 correspond to what should be observed using the slits employed for the optical observations and may be compared directly to the reddening-corrected limits observed in Table 2.
It is immediately evident that there are severe discrepancies in the [Fe XIV]5303 flux limits observed and the fluxes predicted by models for NGC 7009, NGC 6543, and BD+30∘3639, with the observed limits lower by factors of 3.5, 12, and 8, respectively. For NGC 7027, there is only a discrepancy if the plasma temperature has the lowest value of the four considered in Table 4.
The predicted fluxes for [Fe X]6374 explain immediately why this line was never detected. The predicted intensity of this line is often fainter than [Fe XIV]5303 by 2 orders of magnitude or more. As a result, it is always expected to be below our detection limits.
| Object | PA | kT | [Fe X]6374 | [Fe XIV]5303 |
|---|---|---|---|---|
| deg | keV | erg s-1 cm-2 | erg s-1 cm-2 | |
| NGC 6543 | 10 | 0.15 | ||
| NGC 6543 | 43 | 0.15 | ||
| BD+30∘3639 | 0 | 0.20 | ||
| NGC 7009 | 72 | 0.19 | ||
| NGC 7009 | 162 | 0.19 | ||
| NGC 7027 | 138 | 0.2 | ||
| NGC 7027 | 138 | 0.4 | ||
| NGC 7027 | 138 | 0.6 | 0. | |
| NGC 7027 | 138 | 0.8 | 0. |
4 The missing iron
Comparing the observed limits from Table 2 with the X-ray based predictions for [Fe XIV]5303 in Table 5, it is abundantly clear that there is a large discrepancy. The models consistently predict stronger [Fe XIV]5303 emission than is observed, by factors of at least a few to 12. Only in NGC 7027 do the models based upon the X-ray spectrum predict [Fe XIV]5303 emission fainter than our limits, provided a higher plasma temperature is adopted in this object, but we recall that the plasma parameters are not well constrained due to the quality of its X-ray spectrum. In the other three objects, all analyses to date have found much lower plasma temperatures, so this mechanism may be ruled out in those cases. Considering all of the uncertainties from our analysis, we suggest that the most plausible explanation for this observed discrepancy is that the gas in the hot bubble in these three planetary nebulae is strongly iron-depleted.
BD+30∘3639 provides an illustrative example. Our experiments with abundance sets demonstrates that the X-ray spectrum does not meaningfully constrain the abundances in the X-ray-emitting gas (Table 3). The spectrum may be fit by abundance sets with and without iron, the other elements being adjusted in a plausible fashion, and approximately matching the abundances found for the nebular gas and the stellar atmosphere. If an abundance set depleted in iron is adopted, the [Fe XIV]5303 flux predicted may be brought into agreement with observations, but this also serves to illustrate that it is inescapable that iron is depleted in the plasma emitting the X-rays in BD+30∘3639. Clearly, it would be extremely useful to determine both the atmospheric iron abundance of the central star as well as the nebular iron abundance, since these would set bounds on the abundances expected in the hot gas.
5 Implications for the origin of the X-ray gas
The depletion of iron in the gas emitting in X-rays is a strong chemical signature that is of potential use in identifying the origin of this gas. The gas emitting in X-rays should have the composition of either the nebular gas, the stellar wind, or some mixture of the two.
Nebular iron abundances are rare. However, they do exist for NGC 6543 and NGC 7027. Perinotto et al (1999) found depletions by factors of 11 and 80 in NGC 6543 and NGC 7027, respectively, the extreme values they found for their sample of four planetary nebulae. Similarly, Sterling et al (2005) found a depletion of iron by a factor of 3-14 in SwSt-1 depending upon the region of the nebula observed. It is therefore clear that iron may often be depleted by a factor of 10 or more in planetary nebulae, though more extensive studies would obviously be very helpful. The remaining fraction of the iron is presumably found in dust grains. Similar depletion of iron onto dust grains is also found in H ii regions, e.g., Rodríguez (2002) found iron depletions by factors of 3 to 50.
Unfortunately, nothing is known of the iron abundance in the stellar wind for the objects studied here. BD+30∘3639 and NGC 6543 have hydrogen-deficient central stars, NGC 7009 has a hydrogen-rich central star, and nothing is known of the central star in NGC 7027. Generally, there appears to be a clear trend that hydrogen-deficient central stars as well as their supposed PG-1159 and WO progeny, with or without winds, have atmospheres deficient in iron by typically at least an order of magnitude (Miksa et al., 2002; Herald & Bianchi, 2004a, b, c; Stasińska et al, 2004). This iron deficiency may be the result of nuclear processing (e.g., Herwig et al., 2003). On the other hand, the central stars of planetary nebulae with hydrogen-rich atmospheres that still have winds do not appear to be depleted in iron (Herald & Bianchi, 2004a, b, c).
The depletion of iron in either the stellar wind or nebular material could explain our failure to detect [Fe XIV]5303. Clearly, the depletion of iron onto dust grains in the nebular gas allows iron depletion in all objects, while the depletion due to atmospheric composition allows depletion only in BD+30∘3639 and NGC 6543. That we find an iron deficiency irrespective of the properties of the central stars could imply that the depletion process is also independent of the central stars. In this case, the hot gas should be of nebular origin. That the X-ray spectra in all four objects may all be modelled using a plasma with the nebular abundances further reinforces the impression that the plasma emitting in X-rays has a nebular origin.
If the X-ray emitting plasma arises from nebular gas and the iron depletion is due to iron being locked up in dust grains, the dust must survive in the X-ray plasma. Dust survival therefore probably excludes severe shocking of this plasma material (e.g., Tielens et al., 1994). It may be more likely that this matter is heated by a more gentle mechanism, such as heat conduction. The work of Tielens et al. (1994) indicates that iron grains should survive sputtering from thermal ions over the lifetime of a planetary nebula, provided that the original grains are reasonably large, m.
Finally, although our finding of iron depletion in the gas emitting in X-rays offers a chemical signature with the potential to discern the origin of this gas, at present it is impossible to draw a firm conclusion. To progress will require measuring the iron abundances in the nebular gas and the atmospheres of the central stars of these planetary nebulae.
6 Conclusions
We have attempted to observe the [Fe X]6374 and [Fe XIV]5303 emission from four planetary nebulae in which diffuse X-ray emission is observed. The plasma emitting in X-rays should also emit in the coronal lines we observed, but our observations yield only upper limits for both lines in all four objects. Based upon the X-ray spectra of the gas emitting in X-rays, we estimate the intensities expected for the [Fe X]6374 and [Fe XIV]5303 lines using the same models that reproduce the observed X-ray spectra. [Fe X]6374 is expected to be much weaker than our observed upper limits, so it is understandable that we failed to detect it. For [Fe XIV]5303, however, the expected intensities substantially exceed our observed one sigma upper limits, by factors of 3.5, 12, and 8 in NGC 7009, NGC 6543, and BD+30∘3639, respectively. In NGC 7027, the higher plasma temperature explains the absence of [Fe XIV]5303 emission.
The simplest explanation we find for this discrepancy is a depletion of iron in the plasma emitting the X-rays in all objects. This depletion may be checked with further observations of the iron abundance in both the nebular gas and stellar atmospheres. In principle, this chemical signature could be used to determine whether the gas emitting in X-rays arises from nebular gas or the stellar wind. While a variety of evidence appears to favour a nebular origin for the X-ray-emitting gas, no definitive conclusion is possible given the chemical abundances currently available.
References
- Acker & Neiner (2003) Acker, A., & Neiner, C. 2003, A&A, 403, 659
- Aller & Hyung (1995) Aller, L. H., & Hyung, S. 1995, MNRAS, 276, 1101
- Anders & Grevesse (1989) Anders, E., & Grevesse, N. 1989, Geochimica et Cosmochimica Acta, 53, 197
- Arnaud (1996) Arnaud, K.A. 1996, Astronomical Data Analysis Software and Systems V, eds. Jacoby G. and Barnes J., ASP Conf. Series, 101, 17
- Arnaud et al. (1996) Arnaud, K.A., Borkowski, K.J., & Harrington, J.P. 1996, ApJ, 462, L75
- Chu et al. (2001) Chu, Y-H., Guerrero, M., Gruendl, R., Williams, R., & Kaler, J. B. 2001, ApJ, 553, L69
- Fitzpatrick (1999) Fitzpatrick, E. L. 1999, PASP, 111, 63
- Gorenstein (1975) Gorenstein, P. 1975, ApJ, 198, 95
- Guerrero et al. (2000) Guerrero, M., Chu, Y.-H., & Gruendl, R., 2000, ApJS, 129, 295
- Guerrero et al. (2005) Guerrero, M. A., Chu, Y.-H., Gruendl, R. A., & Meixner, M. 2005, A&A, 430, L69
- Guerrero et al. (2002) Guerrero, M., Gruendl, R., & Chu, Y.-H. 2002, A&A, 387, L1
- Herald & Bianchi (2004a) Herald, J. E., & Bianchi, L. 2004a, ApJ, 609, 378
- Herald & Bianchi (2004b) Herald, J. E., & Bianchi, L. 2004b, ApJ, 611, 294
- Herald & Bianchi (2004c) Herald, J. E., & Bianchi, L. 2004c, PASP, 116, 391
- Herwig et al. (2003) Herwig, F., Lugaro, M., & Werner, K. 2003, in IAU Symp. 209, Planetary Nebulae: Their Evolution and Role in the Universe, eds. S. Kwok, M. Dopita, and R. Sutherland (ASP: San Francisco), 85
- Kastner et al. (2003) Kastner, J. H., Balick, B., Blackman, E. G., Frank, A., Soker, N., Vrtílek, S. D., & Li, J. 2003, ApJ, 591, L37
- Kastner at el. (2000) Kastner, J., Soker, N., Vrtilek, S, & Dgani, R., 2000, ApJ, 545, L57
- Kastner et al. (2001) Kastner, J., Vrtilek, S., & Soker, N., 2001, ApJ, 550, L89
- Kastner et al. (2002) Kastner, J., Li, J., Vrtilec, S., Gatley, I., Merrill, K., & Soker, N., 2002, ApJ, 581, 1225
- Kreysing et al. (1992) Kreysing, H. C., Diesch, C., Zweigle, J., Staubert, R., Grewing, M., & Hasinger, G. 1992, A&A, 264, 623
- Kwok et al. (1978) Kwok, S., Purton, C. R., & Fitzgerald, P. M. 1978, ApJ, 219, L125
- Maness & Vrtilek (2003) Maness, H., & Vrtilek, S. D. 2003, PASP, 115, 1002
- Maness et al. (2003) Maness, H. L., Vrtilek, S. D., Kastner, J. H., & Soker, N. 2003, ApJ, 589, 439
- McCall & Armour (2000) McCall, M. L., & Armour, M.-H. 2000, in Mapping the Hidden Universe: The Universe Behind the Milky Way - The Universe in H I, ASP Conf. Proc., ed. R. C. Kraan-Korteweg, P. A. Henning, H. Andernach (ASP: San Francisco), 218, 1
- Miksa et al. (2002) Miksa, S., Deetjen, J. L., Dreizler, S., Kruk, J. W., Rauch, T., & Werner, K. 2002, A&A, 389, 953
- Péquignot & Baluteau (1994) Péquignot, D., & Baluteau, J.-P. 1994, A&A, 283, 593
- Perinotto et al (1999) Perinotto, M., Bencini, C. G., Pasquali, A., Manchado, A., Rodríguez Espinosa, J. M., & Stanga, R. 1999, A&A, 347, 967
- Rodríguez (2002) Rodríguez, M. 2002, A&A, 389, 556
- Różyczka and Franco (1996) Różyczka, M., & Franco, J. 1996, ApJ, 469, L127
- Sahai et al. (2003) Sahai, R., Kastner, J. H., Frank, A., Morris, M., & Blackman, E. G. 2003, ApJ, 599, L87
- Schuster & Parrao (2001) Schuster, W. J., & Parrao, L. 2001, RMxAA, 37, 187
- Soker (1994) Soker,N., 1994, AJ, 107, 276
- Soker & Kastner (2003) Soker, N., Kastner, J., 2003, ApJ, 583, 368
- Stasińska et al (2004) Stasińska, G., Gräefener, G., Peña, M., Hamann, W.-R., Koesterke, L., & Szczerba, R. 2004, A&A, 413, 329
- Sterling et al (2005) Sterling, N. C., Dinerstein, H. L., Bowers, C. W., & Redfield, S. 2005, astro-ph/0502321
- Tielens et al. (1994) Tielens, A. G. G. M., McKee, C. F., Seab, C. G., & Hollenbach, C. J. 1994, ApJ, 431, 321
- Träbert (2004) Träbert, E. 2004, A&A, 415, L39
- Zhekov & Perinotto (1996) Zhekov, S. A., & Perinotto, M., 1996, A&A, 309, 648
- Zhekov & Perinotto (1998) Zhekov, S. A., & Perinotto, M., 1998, A&A, 334, 239