11email: blopez@am.ub.es 22institutetext: Thüringer Landessternwarte, Sternwarte 5, D-07778 Tautenburg, Germany
22email: jochen@tls-tautenburg.de 33institutetext: Max-Planck-Institut für Astronomie, Königstuhl 17, D-69117 Heidelberg, Germany
33email: mundt@mpia-hd.mpg.de
The very low-mass population of the Corona Australis and Chamaeleon II star forming regions ††thanks: Based on observations collected at the European Southern Observatory, La Silla, Chile
We present the results of a deep optical survey in the Corona Australis and Chamaeleon II star forming regions. Our optical photometry is combined with available near- and mid-infrared photometry to identify very low-mass candidate members in these dark clouds. In our Chamaeleon II field, only one object exhibits clear H emission, but the discrepancy between its optical and near-infrared colours suggests that it might be a foreground star. We also identify two objects without H emission that could be planetary mass members of Chamaeleon II. In Corona Australis, we find ten stars and three brown dwarf candidates in the Coronet cluster. Five of our new members are identified with ISOCAM sources. Only two of them have a mid-infrared excess, indicating the presence of an accretion disk. On the other hand, one brown dwarf candidate has a faint close companion, seen only in our deepest -band image. For many of the candidates in both clouds, membership could not be inferred from their H emission or near-infrared colours; these objects need spectroscopic confirmation of their status.
Key Words.:
stars: low-mass, brown dwarfs – stars: pre-main sequence – stars: formation – stars: luminosity function, mass function – stars: circumstellar matter1 Introduction
Surveys for very low-mass stars and brown dwarfs in star forming regions and young clusters are of great importance to understand the formation and early evolution of these objects, and to address the problem of the universality of the initial mass function (IMF) in the low-mass regime. Many such surveys have been carried out in the past years (e.g. Béjar et al. bejar99 (1999); Wilking et al. wilking99 (1999); Barrado y Navascués et al. barrado01 (2001); Martín et al. martin01 (2001); López Martí et al. 2004, 2005). In parallel, spectroscopic studies of young very low-mass objects have been performed searching for signatures of accretion and mass loss (e.g. Fernández & Comerón fernandez01 (2001); Comerón et al. comeron03 (2003); Jayawardhana et al. jay02 (2002), jay03 (2003); Scholz & Eislöffel scholz04 (2004); Mohanty et al. mohanty05 (2005)), and mid-infrared observations have started to unveil the structure of circum(sub)stellar disks (e.g. Natta & Testi natta01 (2001); Testi et al. testi02 (2002); Sterzik et al. sterzik04 (2004); Mohanty et al. mohanty04 (2004)).
Since the observations show that young brown dwarfs and young very low-mass stars have similar properties, it seems most likely that they form by a similar process, namely the collapse and fragmentation of a molecular cloud core. It is not yet clear, however, what mechanism prevents a brown dwarf core from becoming a star. While some models try to explain the observed numbers of substellar objects by turbulent collapse (e.g. Padoan & Nordlund padoan02 (2002)), other authors invoke the concurrence of an external mechanism to stop the core growing process, such as winds and/or the ionizing radiation from a nearby hot massive star (Whitworth & Zinnecker whitworth04 (2004)), or ejection from a multiple system (Reipurth & Clarke reipurth01 (2001); Bate et al. bate03 (2003); Delgado Donate et al. delgado03 (2003)).
In this paper, we present the results from our optical multi-band survey for very low-mass objects in two nearby star forming regions, the Corona Australis and the Chamaeleon II dark clouds. They are very suitable to investigate the problem of low-mass star and brown dwarf formation because of their proximity and high Galactic latitude, implying low contamination from background objects. We followed the same method as in our previous surveys in Chamaeleon~I (López Martí et al. 2004, hereafter Paper (1)) and Lupus~3 (López Martí et al. 2005, hereafter Paper (2)). The paper is structured as follows: First we summarize the characteristics of our chosen regions in Sect. 2. In Sect. 3, we describe our observations, as well as the data reduction and photometry procedures. The survey results are presented in Sect. 4. The properties of the newly identified cloud members are discussed in Sect. 5 and 6. We finish with the conclusions in Sect. 7.
2 Surveyed regions
2.1 Corona Australis
At a distance of 130 pc (Marraco & Rydgren marraco81 (1981)), the Corona Australis molecular complex is a close and interesting site of star formation. Dominated by a centrally condensed core near the emission-line star R~CrA, this region is characterised by strong concentrations of molecular material (Loren loren79 (1979)). The cloud contains several bright infrared sources and Herbig-Haro objects (see Wang et al. wang04 (2004); Graham graham91 (1991), and references therein). Especially relevant was the recognition of a number of heavily obscured low-mass stars in the R CrA cloud core making up a compact embedded cluster named “the Coronet” (Taylor & Storey taylor84 (1984)).
The young stellar population has been studied by means of H surveys (Marraco & Rydgren marraco81 (1981)), optical spectroscopy (Walter et al. walter97 (1997)), infrared mapping (e.g. Wilking et al. wilking92 (1992)) and X-ray observations (e.g. Patten patten98 (1998); Neuhäuser et al. neuhauser00 (2000)). Although no bona-fide brown dwarfs are yet known in Corona Australis, deep infrared surveys have started to provide some good candidates (Wilking et al. wilking97 (1997); Olofsson et al. olofsson99 (1999)). More recently, Fernández & Comerón (fernandez01 (2001)) reported on an object in the transition from stars to brown dwarfs seen in the direction of the R CrA core. This object, LS-RCrA~1, shows indications of intense accretion and mass loss in its spectrum, and provided the first observational evidence that such processes take place in young objects with masses down to the substellar boundary (see also Barrado y Navascués et al. 2004a ). Objects similar to LS-RCrA 1 have been later discovered in other star forming regions (e.g. Comerón et al. comeron03 (2003); Barrado y Navascués & Jayawardhana 2004b ).
2.2 Chamaeleon II
The Chamaeleon star forming complex consists of three dark clouds, named Chamaeleon I, II, and III. The largest and best studied of the three is Chamaeleon I: With an estimated age of about 3 Myr, it contains more than 150 known young stars (e.g. Schwartz schwartz91 (1991); Gauvin & Strom gauvin92 (1992)). This cloud has also been surveyed for brown dwarfs (e.g. Comerón et al. comeron00 (2000), comeron04 (2004); Luhman 2004a ). In particular, we identified 44 low-mass stars and 27 new brown dwarf candidates in a WFI survey of an area of about 1.2 deg2 in Chamaeleon I (Paper (1)).
Chamaeleon~II seems to be at an earlier stage of evolution than Chamaeleon I, because it contains more embedded than visual objects (e.g. Gauvin & Strom gauvin92 (1992)). This dark cloud has an extension of about 1.5 deg2 and lies at an estimated distance of 178 pc (Whittet et al. whittet97 (1997)). Surveys by several authors have identified at least 19 T Tauri stars in this star forming region (Schwartz schwartz77 (1977); Gauvin & Strom gauvin92 (1992); Hughes & Hartigan hughes92 (1992)). It also contains an embedded Herbig Ae star, IRAS~12496-7650 (Hughes et al. hughes91 (1991)). More recently, Young et al. (young05 (2005)) identified more than 40 potential young stellar objects in this cloud in a Spitzer-MIPS survey, including two previously unknown sources with 24m excesses.
Up to now, no bona-fide brown dwarfs are known in Chamaeleon II. Recently, Vuong et al. (vuong01 (2001)) presented a list of 51 new objects in this region from the DENIS survey with colours suggesting that they may be very low-mass stars or brown dwarfs. Low- and mid-resolution spectra of some of these objects were recently provided by Barrado y Navascués & Jayawardhana (2004b ), who could only confirm one candidate, C41, as a Chamaeleon II member, with a mass near the substellar boundary. This object also shows signatures of accretion and outflow in its spectrum.
3 Observations
| Date | Field | (2000) | (2000) |
|---|---|---|---|
| 28 May 1999 | CrA-2 | 19h 00m 04.0s | -37∘ 29′ 348 |
| 28 May 1999 | CrA-4a | 19h 01m 45.9s | -36∘ 58′ 300 |
| 30 May 1999 | ChaII-3 | 12h 58m 14.5s | -76° 50′ 587 |
-
a
This field contains the Coronet cluster.
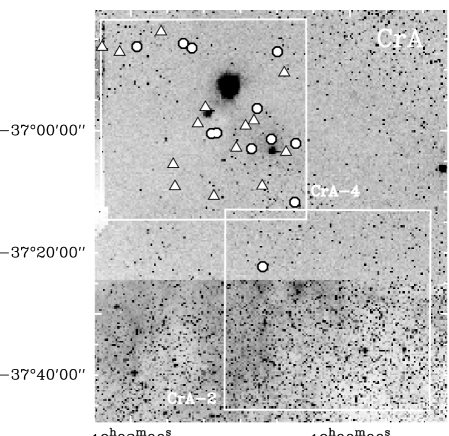
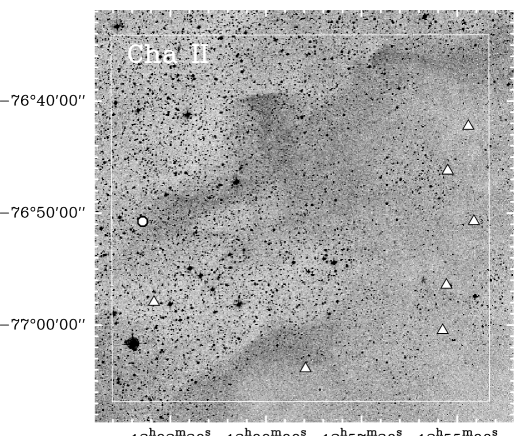
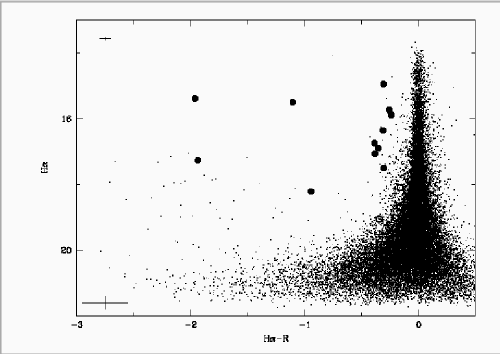
Our optical survey was carried out in May 1999 using the Wide Field Imager (WFI) at the ESO/MPG 2.2-m telescope on La Silla Observatory (Chile). This eight-chip mosaic camera has a field of view of about 34′34′ and a spatial resolution of 0.238″/pixel. In Corona Australis, two WFI fields were observed, covering a total area of about 0.6 deg2 in this dark cloud (see Fig. 1). One of the fields (CrA-4) contained the intermediate-mass star R CrA and the Coronet cluster. In Chamaeleon II, we observed only one WFI field, located to the north-west of the densest part of the cloud (see Fig. 2). Part of a dense cloud core can be seen towards the western part of the field, which contains a few previously known T Tauri stars (Schwartz schwartz91 (1991)).
We observed in two broad-band filters, and , in a narrow-band filter centred on the H emission line (H/7), and in two medium-band filters, (855/20) and (915/28). The last two allow for a photometric spectral type classification (see Sect. 4.3 below). For each field and filter, except for H, we took three exposures with different exposure times, in order to prevent the brightest T Tauri stars (TTS) from saturating. For the H filter only two different exposure times were used (see Table 2). The average seeing was .
Data reduction, object search, and photometry were performed within the IRAF environment.111IRAF is distributed by the National Optical Astronomy Observatory (NOAO), operated by the Association of Universities for Research in Astronomy, Inc. under contract to the US National Science Foundation. The images were first bias-subtracted and flatfielded. After this process, an irregular illumination pattern remained, which was corrected by division through an illumination mask. The reddest filters (, , and ) also showed a strong fringing pattern. To correct for it, it was necessary to subtract a fringe mask from the reduced images. Both masks were created by combination of the science exposures (see Scholz & Eislöffel scholz04 (2004) for more details).
An object catalogue of each surveyed field was produced by running SExtractor (Bertin & Arnouts bertin96 (1996)) on the longest exposures. Aperture and PSF photometry was performed using standard routines from the DAOPHOT package (Stetson stetson87 (1987)). In this way we could also measure the faintest components of multiple systems. For the short exposures and the standard stars, we did only aperture photometry.
The broad-band photometry was calibrated with Landolt (landolt92 (1992)) standard stars. Our survey is complete down to 20 mag and 19 mag. Since no set of standard stars is available for our narrow- and medium-band filters, no calibration was possible in these bands. A correction for atmospheric extinction was performed using the extinction coefficients from the fit of the Landolt stars for the -band, in the case of the H filter, and the -band, for the and photometry. For a better understanding of the emission properties, the H instrumental magnitudes were then shifted so that the main locus of the objects in each surveyed field corresponds to H in a (H, H) colour-magnitude diagram (see Sect. 4.1).
Since only a global fit for all the CCD chips could be performed with the Landolt standard stars, the main source of error in our photometric calibration is produced by the WFI chip-to-chip photometric variations, which can be as high as 3% in the broad-band filters and 5% in medium-band filters (Alcalá et al. alcala02 (2002)). On the other hand, as reported in Paper (1), a systematic offset exists between images with different exposure times, in the sense of the resulting luminosities being brighter (typically by about 0.05 mag) for longer exposure times. The origin of this offset is so far unknown. To minimize this systematic error, we determined the offsets between the three different integration times, and then shifted the short and long integration times to the system of the medium integration.
The listed magnitudes are the average of the so-corrected measurements only if the average error was lower than the errors of the individual measurements. If this was not the case, the measurement with the lower error was preferred. We estimate that our survey is complete down to 21 mag and 20 mag. The errors in the completeness range are in general not larger than 5%.
A more detailed discussion of the reduction, photometry and calibration procedures and of the sources of the photometric errors can be found in Paper (1).
4 Identification of new cloud members
4.1 Candidate selection
To identify low-mass members of our surveyed clouds, we proceeded as in our previous works (Paper (1) and Paper (2)). Candidates were selected in an () colour-magnitude diagram around the position of a 1 Myr theoretical isochrone from the Chabrier et al. (chabrier00 (2000)) models, shifted to the estimated distance and extinction of the cloud.
Average extinction values of (A=0.47 and (A=2.2 were estimated using the individual values measured by Neuhäuser et al. (neuhauser00 (2000)) and Vuong et al. (vuong01 (2001)) for two samples of stars seen in the direction of Corona Australis and Chamaeleon II, respectively. With the following relations:
| (1) |
| (2) |
derived from the extinction law of Rieke & Lebofsky (rieke85 (1985)), average colour excesses of
| (3) |
| (4) |
were computed for each region.
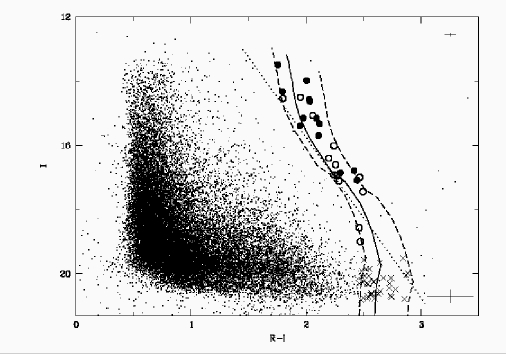
For the candidate selection, we took a 1 Myr theoretical isochrone from the dusty models of Chabrier et al. (chabrier00 (2000)), shifted according to the distance and our estimated average extinction for each dark cloud. Fig. 3 shows the () colour-magnitude diagrams for our surveyed fields. Our brown dwarf candidates are the objects found around each reddened isochrone, with a maximum scatter in colour given by the lower and upper limit of the average colour excess as determined above. All objects found within the given colour ranges were selected as candidate low-mass members of the clouds. For comparison, the diagrams in Fig. 3 also show the position of the empirical isochrone used for candidate selection in Chamaeleon I (dotted line). Note that this line is placed towards bluer (R–I) colours than the theoretical Chamaeleon II isochrone (see lower panel in Fig. 3). This is consistent with the lower distance (160 pc) and extinction of Chamaeleon I with respect to Chamaeleon II.
According to the theoretical models by Chabrier et al. (chabrier00 (2000)), if these objects indeed belong to Corona Australis and Chamaeleon II, they must have masses ranging from the hydrogen burning limit (-0.080 M⊙) to about 0.005 M⊙. However, the large photometry errors at the lower part of these diagrams introduce some uncertainty in the membership of the faintest objects: As seen in Fig. 3, a large number of the selected objects in both clouds have 19.5 mag. With the assumed values of distance and extinction, the models give masses for them of M0.012M⊙ in Chamaeleon II and M0.007M⊙ in Corona Australis, which would place them below the deuterium burning mass limit (0.013M⊙). However, most of these very faint candidates are found near the edge of our selection band; thus, a slight shift towards bluer colours caused by the photometric errors would place some of these objects outside our selection area in the colour-magnitude diagram. Moreover, these objects are also very faint in H, or not detected at all in this band. Taken all this into account, we conclude that they are more likely background objects, and remove them from our candidate lists for Corona Australis and Chamaeleon II. These objects are marked with ’x’ in the diagrams of Fig. 3, and won’t be further considered.
In principle, a high contamination from older objects is not expected in the direction of these star forming regions. Their proximity and high Galactic latitude () imply that the density of foreground objects must be very low in both cases. Moreover, the extinction suppresses detection of objects behind the dark clouds. Particularly, background contamination should be negligible towards the core seen to the north-west of our Chamaeleon II field (Fig. 2), because the extinction is larger in this area (see e.g. Vuong et al. vuong01 (2001); Mizuno et al. mizuno99 (1999)). This is consistent with the low number of objects detected in the area of interest of the corresponding () colour-magnitude diagram (lower panel in Fig. 3), once the faintest objects are discarded for the reasons explained above.
4.2 Probable members
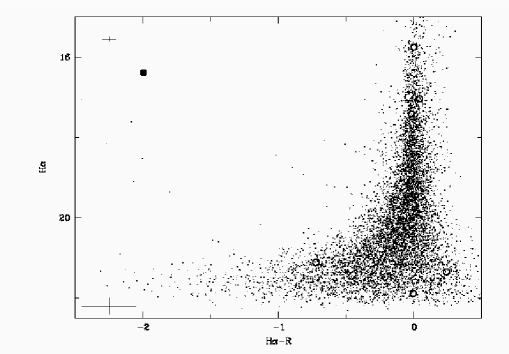
In a second step, probable cloud members were selected by means of their H colour. As shown in Paper (1), this colour is a useful estimation of the level of H emission, a common youth diagnostics. Hence, if our candidates showed H emission, they were likely to be young objects, and thus members of the star-forming region.
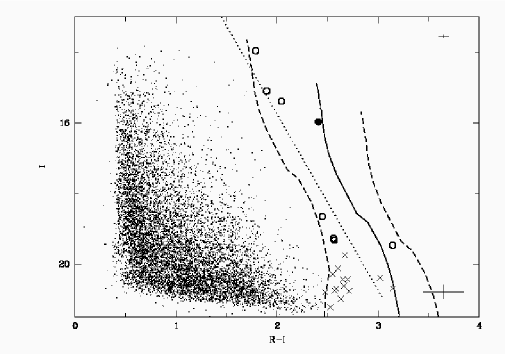
Fig. 4 shows the (H, H) colour-magnitude diagrams for our surveyed areas in Corona Australis and Chamaeleon II. For the brightest objects, we applied the same criterion as in previous works (Lamm et al. lamm05 (2005); Paper (2)), retaining the objects with
| (5) |
as probable cloud members.
In the case of Chamaeleon II, this procedure left us with only one good candidate, ChaII 376. This object is found to have clear H emission, its H colour being as negative as those exhibited by some brown dwarfs and very low-mass stars in Chamaeleon I (see Fig. 3 in Paper (1)). However, as outlined below (Sect. 4.3), its derived spectral type is inconsistent with a brown dwarf. In Corona Australis, 13 candidates are retained as probable cloud members.
The non-detection of H emission does not completely rule out the rest of the objects as members of Corona Australis and Chamaeleon II. For instance, in the slightly older (2-4 Myr) open cluster NGC 2264, Lamm et al. (lamm05 (2005)) found a considerable number of very low-mass stars on the basis of their variability, many of which showed no detectable H emission. Indeed, we later added one object to the Corona Australis and two to the Chamaeleon II candidate lists based on their infrared properties (see Sect. 4.4 below). The rest need confirmation of their status by follow-up observations.
4.3 Spectral types
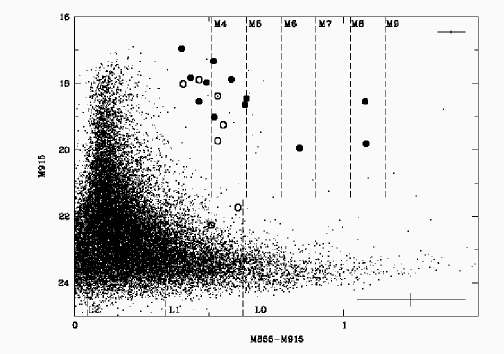
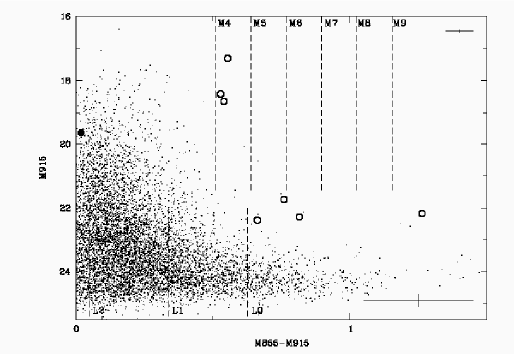
To identify the spectral types of our candidates, we followed the method outlined in Paper (1), based on the observations of field M- and early L-dwarfs in the two medium-band filters and . The former lies in a spectral region including the TiO and VO absorption bands used to classify medium and late M-type objects (see Kirkpatrick et al. kirkpatrick91 (1991)). The filter covers a pseudo-continuum region in these late-type objects. In Paper (1), a correlation was found between the – colour index and the spectral type for the range M4-M9. This enabled us to derive spectral types for our brown dwarf candidates from their position in a (, ) colour-magnitude diagram. We estimated an error of 1-2 subclasses in this calibration. For spectral types earlier than M4 the – colour saturates, because the TiO and VO features are not prominent or not present at all in the spectra. Therefore, it is not possible to determine spectral types earlier than M4 with this method.
A second correlation, of opposite sign, was found for spectral types L0-L2, due to the progressive disappearance of the TiO and VO from the spectra. In this case, however, the uncertainties are larger than for late M-type objects, given that extincted early M-objects would be placed in the same region of the colour-magnitude diagram.
Based on comparison with published spectral types for some previously identified Chamaeleon I members, in Paper (1) we estimated that about 80% of the spectral types derived with this photometric method are correct (within the quoted errors). Wrong spectral types would be derived, though, for highly extincted objects and unresolved binaries. Comerón et al. (comeron04 (2004)) report an objective prism survey of the entire Chamaeleon I cloud, providing long-slit spectroscopy and imaging of the identified candidates. Seven of their objects are also included in our Chamaeleon I survey, and our given spectral types agree fairly well with the ones provided by these authors. Luhman (2004a ) provides optical spectroscopy for 179 possible members of this dark cloud. Of the 25 objects in common with our own survey, 17 have spectral types that are in good agreement with our photometric classification. For another four objects, Luhman (2004a ) gives spectral types which are still marginally coincident with our predictions. Hence, 100% of our objects in common with Comerón et al. (comeron04 (2004)) and at least about 68% of our objects in common with Luhman (2004a ) have photometrically derived spectral types confirmed and refined by these authors. This makes a total of 75% of coincidence between the spectroscopic and the photometric spectral types (within the estimated errors), in fairly good agreement with the expectations. The discrepancies correspond to earlier type objects for which our method yielded a much later spectral type, probably due to local high extinction towards them.
A detailed discussion of this photometric spectral type classification, its error sources and its limitations can be found in Paper (1).
| Name | (2000) | (2000) | H | SpTc | Classification | Other namesd | ||||
| mag | mag | mag | mag | mag | ||||||
| CrA~205 | 19 01 11.5 | -37 22 21.1 | 17.12 | 15.15 | 16.74 | 19.00 | 18.54 | M4 | star | |
| CrA~432 | 19 00 59.8 | -36 47 09.2 | 19.16 | 16.86 | 18.21 | 20.78 | 19.95 | M7 | BD | |
| CrA~444 | 19 00 45.3 | -37 11 47.3 | 17.34 | 15.39 | 15.38 | 19.62 | 18.54 | M8.5 | BD cand. | |
| CrA~452 | 19 00 44.6 | -37 02 09.5 | 15.25 | 13.49 | 14.96 | 17.35 | 16.96 | M4 | star | ISO-CrA~98 |
| CrA~453 | 19 01 04.6 | -37 01 28.4 | 17.80 | 15.69 | 17.49 | 19.53 | 19.01 | M4 | star | |
| CrA~465 | 19 01 53.7 | -37 00 33.6 | 19.20 | 16.78 | 17.26 | 20.90 | 19.81 | M8.5 | BD cand. | WMB~185831.1-370456 |
| CrA~466e | 19 01 19.0 | -36 58 27.2 | 18.25 | 16.01 | 18.09 | 19.80 | 19.25 | 4.5 | star | |
| CrA~468 | 19 01 49.3 | -37 00 28.1 | 16.12 | 14.33 | 15.88 | 18.26 | 17.83 | M4 | star | WMB~185826.8-370450 |
| CrA 4107 | 19 02 54.6 | -36 46 18.9 | 16.60 | 14.57 | 15.50 | 18.46 | 17.88 | M4.5 | star | ISO-CrA~177 |
| CrA 4108 | 19 02 09.7 | -36 46 33.5 | 16.66 | 14.63 | 16.35 | 18.46 | 17.97 | M4 | star | ISO-CrA~141 |
| CrA 4109 | 19 02 16.7 | -36 45 48.5 | 15.99 | 13.98 | 15.73 | 17.85 | 17.33 | M4 | star | ISO-CrA~146 |
| CrA 4110 | 19 01 16.3 | -36 56 27.3 | 17.25 | 15.16 | 16.89 | 19.09 | 18.45 | M5 | star | ISO-CrA~123 |
| CrA 4111 | 19 01 20.8 | -37 03 02.3 | 17.45 | 15.33 | 17.06 | 19.28 | 18.64 | M5 | star | |
| ChaII~376 | 13 03 13.3 | -76 50 50.9 | 18.38 | 15.97 | 16.39 | 19.66 | 19.64 | M4 | star | |
| ChaII~304e | 12 55 15.9 | -76 46 21.8 | 21.8; | 19.27 | 21.1; | 23.1; | 22.3; | M9.5 | BD cand. | |
| ChaII~305e | 12 55 16.3 | -76 46 20.9 | 21.9; | 19.33 | 21.9; | 23.0; | 22.4; | M9.5 | BD cand. |
-
a
H, , and magnitudes are instrumental magnitudes.
-
b
Photometric errors: blank: 0.05 mag; semicolon: 0.1 mag; colon: 0.2 mag
-
c
Errors in the spectral types: M4-M6: 2 subclasses; M6.5-M9: 1 subclass
- d
-
e
Infrared selected (see text).
Fig. 5 shows the (, ) colour-magnitude diagrams for our surveyed fields in Corona Australis and Chamaeleon II. Many of our brightest candidates in both clouds have spectral types earlier than M6 according to these diagrams. Hence, if they belong to the cloud, they must be low-mass stars. Only a few H emitters in Corona Australis with spectral types between M6.5 and M9 could be brown dwarfs. Some non-emitters in both clouds could also have spectral types corresponding to the brown dwarf regime.
The – colour of our single clear H emitter in Chamaeleon II, ChaII 376, is remarkably bluer than expected for M-type objects (). This might be an indication of a very early spectral type. The object might be either an extincted early-type member of Chamaeleon II or an older H emitting object, such as an AGB star. Even if its membership of the star forming region were confirmed, ChaII 376 is not likely to be a brown dwarf.
The WFI photometry and the estimated spectral types for all the probable members of Corona Australis (as well as an infrared selected candidate, see Sect.4.4.1 below) are summarized in Table 3. This table also includes the WFI photometry for ChaII 376 and other possible members of Chamaeleon II (see Sect. 4.4.2). Note that only three objects in Corona Australis and two in Chamaeleon II have estimated spectral types that are clearly substellar for the age of these regions.
4.4 Infrared detections
We made use of the database of the 2MASS survey222Available online at the URL of the NASA-IPAC Infrared Science Archive (IRSA): http://irsa.ipac.caltech.edu/ and of published results from other authors to look for near-infrared counterparts of the objects (with and without H emission) in our initial candidate lists for both clouds. Moreover, we also checked whether some of our optical sources had been detected in the mid-infrared by ISOCAM or Spitzer. In this way, we intended not only to further confirm the youth of our H emitters, but also to identify new candidate cloud members.
4.4.1 Infrared sources in Corona Australis
All the probable Corona Australis members from Table 3 have a near-infrared counterpart within about 1, except CrA 205, CrA 432, and CrA 452, for which the closest 2MASS source is found at about 1.9, 2.1, and 1.5, respectively. However, all three objects are placed in areas of high cloud density, and no other optical source is seen in our WFI images that could correspond to the near-infrared detection. We therefore identified the 2MASS sources with our new cloud members. The near-infrared photometry for all our H emitters (and one object with mid-infrared excess, see below) is summarized in Table 4. Two of these objects (CrA 465 and CrA 468) had also previous near-infrared photometry available from Wilking et al. (wilking97 (1997)). In addition, six objects without H emission from our initial candidate selection also have 2MASS counterparts.
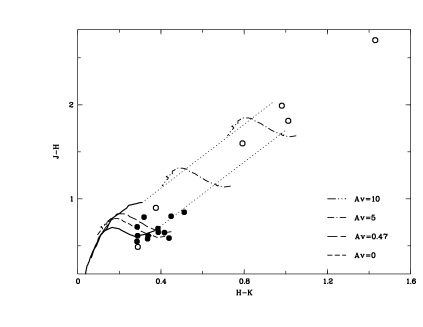
The upper panel of Fig. 6 shows the colour-colour diagram for all the 2MASS detected objects in Corona Australis. The locus of dereddened dwarfs and giants (Bessell & Brett bessell88 (1988)) is also indicated, as well as the direction of the reddening vector and the positions of a 1 Myr isochrone from the models of Baraffe et al. (baraffe98 (1998)) for different values of extinction. We see that most of the objects without H emission are placed at high values of extinction (A 10 mag), while the H emitters all have low extinction, consistent with our selection criterion in Sect. 4.1. However, since none of our objects has a near-infrared excess, we cannot confirm their young status.
Among the H emitters, the most extincted objects are CrA 432 and CrA 453 (A1.5 mag). The former has an estimated spectral type of M7 and is considered a brown dwarf candidate in Table 3; however, according to the models of Chabrier et al. (chabrier00 (2000)), our estimated mean cloud extinction, and the temperature scale of Luhman (luhman99 (1999)), and with an extinction of A1.5 mag, CrA 432 should have a spectral type of about M8.5, even later than our classification. It might be that this apparent underluminosity is intrinsic to the object itself, as in the case of another member of the R CrA cloud, LS-RCrA 1 (Fernández & Comerón fernandez01 (2001)). Possible causes could be extinction by surrounding dust or accretion processes. Also CrA 453 seems too faint for its estimated spectral type (M4).
Corona Australis has also been observed in the mid-infrared by the ISO satellite (Olofsson et al. olofsson99 (1999)). Unfortunately, the ISOCAM observations could not map the densest part of the cloud core, because the brightest stars would have saturated the detector. Therefore, the overlap with our own survey is small. Still, we find five objects in common with these authors: CrA 452 (ISO-CrA 98), CrA 466 (ISO-CrA 127), CrA 4107 (ISO-CrA 177), CrA 4109 (ISO-CrA 146) and CrA 4110 (ISO-CrA 123). The mid-infrared photometry for all these objects is listed in Table 4.
With a single exception, all the ISOCAM detected sources have H emission according to their H colour. The position of the only non-emitter, CrA 466, in the near-infrared colour-colour diagram could correspond to a highly extincted young star or to a field dwarf. In the WFI mosaic, this object is found at the upper right corner of the CCD#55. No other object is seen nearby, and the mismatch in the coordinates of the optical and the mid-infrared source is of only 1. However, given the gaps between the different CCDs and the pointing errors of the ISOCAM positions, we cannot exclude that the true counterpart of the ISOCAM source is another star not seen in our images. Still, with a H colour of –0.16, H emission from this object cannot be completely ruled out, given the errors in that part of the colour-magnitude diagram (upper panel of Fig. 4). CrA 466 is further discussed in Sect. 5.2.
| Name | 2MASS Id. | J | H | K | F6.7 | F14.3 |
| mag | mag | mag | mJy | mJy | ||
| CrA 4107 | 19025464-3646191 | 12.440 | 11.795 | 11.408 | 1.07 | 7.30 |
| CrA 4108 | 19020967-3646344 | 12.580 | 11.972 | 11.634 | ||
| CrA 4109 | 19021667-3645493 | 12.004 | 11.303 | 11.017 | 5.60 | |
| CrA 4110 | 19011629-3656282 | 12.954 | 12.314 | 11.897 | 6.50 | |
| CrA 4111 | 19012083-3703027 | 13.233 | 12.687 | 12.402 | ||
| CrA 205 | 19011169-3722213 | 13.315 | 12.741 | 12.405 | ||
| CrA 432 | 19005974-3647109 | 14.190 | 13.333 | 12.821 | ||
| CrA 444 | 19004530-3711480 | 12.924 | 12.342 | 11.903 | ||
| CrA 452 | 19004455-3702108 | 11.571 | 10.766 | 10.447 | 8.60 | |
| CrA 453 | 19010460-3701292 | 13.338 | 12.524 | 12.075 | ||
| CrA 465b | 19015374-3700339 | 14.084 | 13.401 | 13.015 | ||
| CrA 466 | 19011893-3658282 | 12.834 | 11.245 | 10.453 | 31.00 | 30.00 |
| CrA 468c | 19014936-3700285 | 12.498 | 11.891 | 11.603 | ||
| ChaII 304/305 | 12551617-7646213 | 15.950 | 15.192 | 14.612 | ||
| ChaII 376 | 13031246-7650509 | 14.337 | 13.620 | 13.366 |
4.4.2 Infrared sources in Chamaeleon II
Vuong et al. (vuong01 (2001)) report a list of objects in Chamaeleon II that have near-infrared excesses according to DENIS photometry. We only find two objects in common with these authors (C30 and C31), which represents 10% of the DENIS sources in the overlapping area. If they indeed belonged to Chamaeleon II, both of these DENIS objects would have spectral type M4 according to our calibration. Hence, they would be low-mass stars. However, neither of them is a H emitter according to our WFI photometry.
We also searched for near-infrared counterparts to our Chamaeleon II objects in the database of the 2MASS survey. We found five positive detections, including ChaII 376 and both of our DENIS objects.
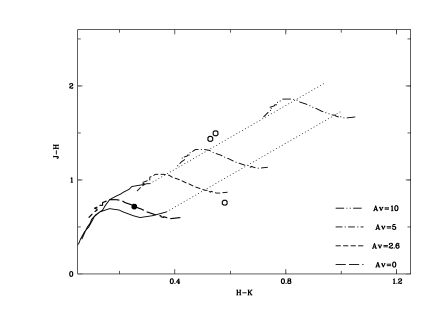
The lower panel of Fig. 6 shows the (, ) colour-colour diagram for our 2MASS detected objects in Cha II. The locus of dereddened dwarfs and giants (Bessell & Brett bessell88 (1988)) is also indicated, as well as the direction of the reddening vector and the positions of a 1 Myr isochrone from the models of Baraffe et al. (baraffe98 (1998)) for different values of extinction. Most of our near-infrared detected candidates have optical extinction values in the range 2-5 mag according to this diagram. These values are in agreement with our selection criteria from Sect. 4.1. No evident excess emission can be inferred from the near-infrared colours, as the objects are all placed along the reddening band. Hence, we cannot separate cloud members and non-members with these data.
The position of ChaII 376 in Fig. 6 is consistent with that of an unreddened brown dwarf (M8) according to the theoretical 1 Myr isochrone. However, its optical colours are bluer than expected for this age and mass, and suggest a more massive substellar object (). Moreover, in Sect. 4.3 it was not possible to assign a spectral type to this object by means of its () colour. In view of these considerations, and since H emission is not exclusive of young objects, ChaII 376 might be an older active star. The 2MASS photometry of this object is given in Table 4.
Two objects, ChaII 304 and ChaII 305, have the same 2MASS counterpart. They are seen close to each other in the WFI images () and have similar brightness and colours. Visual inspection confirmed that the pair is not resolved in the 2MASS -band image (which has a pixel size of ). Thus, the near-infrared photometry provided in Table 4 seems to correspond to the unresolved pair. In the (, ) colour-colour diagram, the 2MASS counterpart is placed towards the right of the reddening band at an extinction value of about 2.6 mag (the average value used for candidate selection in Sect. 4). Interestingly, both members of this visual pair have similar optical photometry, consistent with two objects close to or right below the deuterium burning mass limit (0.015-0.012 ) according to the Chabrier et al. (chabrier00 (2000)) models. The near-infrared colours of the 2MASS detection, however, are consistent with a single object of this mass. Given that no close neighbour is seen in the 2MASS image, this may indicate that the unresolved pair is not a very low-mass object in Chamaeleon II. A further possibility is that one of the two objects from our WFI images is a background star whose near-infrared magnitudes are fainter than the 2MASS detection threshold. In this latter case, the remaining object (most likely ChaII 304, whose position is closer to the 2MASS source) would have optical and near-infrared colours consistent with a planetary mass object (M⊙) in Chamaeleon II (according to the Chabrier et al. models). The WFI photometry for ChaII 304 and ChaII 305 is summarized in Table 3, as well as the estimated spectral type and their classification if they were members of the dark cloud.
The two DENIS objects C30 and C31 are placed along the direction of the reddening vector for giants. Both objects show a featureless optical spectrum according to the observations by Barrado y Navascués & Jayawardhana (2004b ), which did not allow these authors to conclusively confirm or exclude their membership to Chamaeleon II. Although these objects could still be extincted cloud members (A5 mag), it seems more probable, in view of their position in the (, ) diagram, that they belong to the background.333Barrado y Navascués & Jayawardhana (2004b ) compare the 2MASS photometry of the DENIS sources provided by Vuong et al. (vuong01 (2001)) with that of confirmed Chamaeleon II members, showing that, in general, the DENIS objects lie above the main CTTS locus (Figure 4b in that work). The other objects without H emission have ambiguous positions in the (, ) colour-colour diagram: They could be moderately extincted Chamaeleon II members or background dwarfs.
We also cross-correlated our candidate list with that of the Chamaeleon II ISOCAM sources provided by Persi et al. (persi03 (2003)), but none of our objects has a mid-infrared excess according to these authors. Young et al. (young05 (2005)) do not detect any of our candidates either in their Spitzer-MIPS survey, covering more area at longer wavelengths and with greater sensitivity.
4.5 Object classification
After the selection process described above, we are left with 12 good candidate members of Corona Australis that are H emitters. Nine of them have spectral types earlier than M6, and are classified as very low-mass stars. The remaining three candidates have estimated spectral types M7-M8.5, corresponding to brown dwarfs. This classification is summarized in Table 3. We also include in this table the star CrA 466, which has a mid-infrared excess but no clear H emission.
In Chamaeleon II, ChaII 376, our only H emitter, seems to be more likely a foreground star. Still, the pair formed by ChaII 304 and ChaII 305 could contain one or two objects in the transition from brown dwarfs to planetary mass objects.
5 Properties of the new very low-mass members of Corona Australis
5.1 Spatial distribution and visual binaries
As seen in Fig. 1, all but one of our new Corona Australis members are located within our northern WFI field, CrA-4. This is not surprising, given that this field contains the cloud core where most of the previously known members of this star forming region are located (the Coronet cluster).
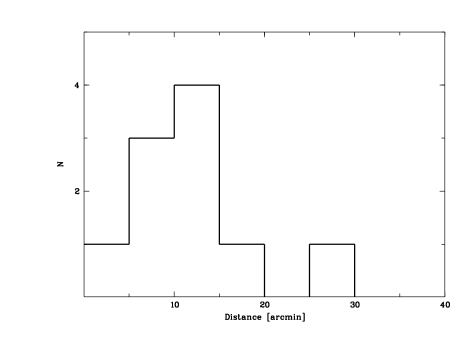
The objects tend to be clustered around the star R CrA. In Fig. 7, we show the number of our objects found at different distance bins from this star. There are no obvious differences in the spatial distribution of low-mass stars and brown dwarf candidates. Moreover, similar to the case of Lupus 3 (Paper (2)), most of our new Corona Australis members are placed at distances 5-15 from the intermediate-mass star. Note that objects very close to R CrA might be blended by this brighter star and its associated reflection nebula.
Given the low number of objects, we cannot use the observed distribution to test the proposed formation scenarios. We remark, however, that this distribution suggests a connection between the very low-mass objects and the cloud core containing the star R CrA, in agreement with the results in Chamaeleon I (cf. Paper (1)) and Lupus 3 (cf. Paper (2)).
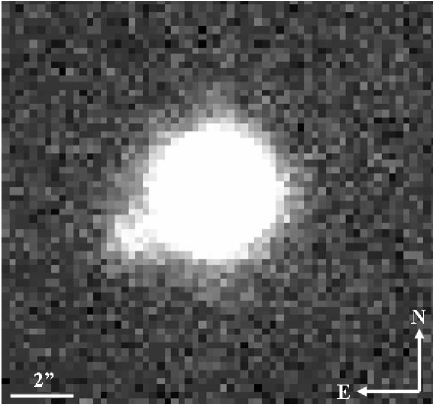
We also checked for possible binary systems among our new Corona Australis members. Within a maximum estimated radius of about 9′′ (about 1170 AU, calculated, as in Paper (1) and Paper (2), by estimating the mean object surface density in our surveyed region), we do not find any visual pair among our objects. Nonetheless, several objects have faint neighbours that were not considered candidates according to our selection criteria, because their colours did not match those expected for young very low-mass objects. More interesting, the brown dwarf candidate CrA 444 could have a faint companion at about 3 (390 AU) that was not found by the automatic search (see Fig. 8). This object, CrA~444b, is only visible in our deep exposure.
We made an attempt to measure CrA 444b using a small aperture to remove as much of its brighter neightbour as possible, and then performing a correction based on other nearby objects of similar brightness to get an approximate instrumental magnitude. The obtained value is about 4 magnitudes fainter than the instrumental magnitude for CrA 444. In absolute photometry, CrA 444b must have 19 mag. Given that this object is not seen in the -band images, its magnitude must lie below our survey completeness limit, 21 mag. The optical colour of CrA 444b seems thus to be similar to that of ChaII 304 and ChaII 305 in Chamaeleon II. If it belonged to the cloud, the companion to CrA 444 would have a mass below the deuterium burning limit (M⊙).
5.2 Infrared properties
As seen in Table 4, most of the ISOCAM detected objects are very faint and visible only at 6.7 m. Only two objects, CrA 4107 and CrA 466, are detected in both bands. Both of them have a mid-infrared excess.
CrA 4107 (ISO-CrA 177) is a star (M4.5) with a very blue H colour (–1.1), implying strong H emission. These properties strongly suggest that CrA 4107 is young and has an accretion disk. A similar correlation between H emission (detected as a blue H colour) and a mid-infrared excess had also been found in several Chamaeleon I very low-mass objects (Paper (1)).
CrA 466 (ISO-CrA 127) is the only object without H emission in the sample, although this classification might be ambiguous, because its H colour (–0.16) would place it among the emitters if it were a little bit brighter. Curiously, this is also the brightest mid-infrared source. In the (, ) diagram, CrA 466 is found in the centre of the reddening band with an extinction value of about 8 mag. However, this is not a particularly faint source either in the optical (I=16.01 mag) nor in the near-infrared ( 12.834 mag, 10.453 mag). An independent estimation of the extinction towards this object from its colour and its estimated spectral type (M4.5) yields a extinction value of only A 2.15 mag. (We used the intrinsic colours from Comerón et al. comeron00 (2000) in this computation.) Hence, it seems that the near-infrared colours of CrA 466 could be intrinsic to the object rather than caused by high extinction, which also hints to the presence of circumstellar material and/or accretion. Follow-up spectroscopy of this star might confirm the presence of H emission.
5.3 H emission
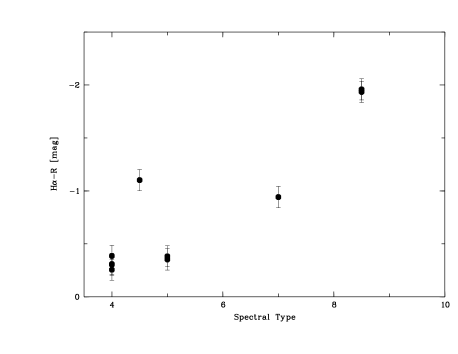
The relation between the H colour index and the spectral type is shown in Fig. 9. Like in previously studied regions (cf. Fig. 13 of Paper (1) and Fig. 7 of Paper (2)), an increase of emission towards later spectral types might be present. However, given the faintness of these later-type objects, this apparently strong emission might be just the consequence of a lower continuum.
To better study the emission properties of our objects, we proceeded as in our previous works (Paper (1) and Paper (2)). First, a H pseudoflux F̃Hα was computed as:
| (6) |
where denotes the H (instrumental) magnitude, and F0 is a hypothetical H absolute flux. Note that this is not the flux in the H emission line, which requires spectroscopy to be measured. From this quantity F̃Hα, a H pseudoluminosity was computed using the distance estimate of 130 pc.
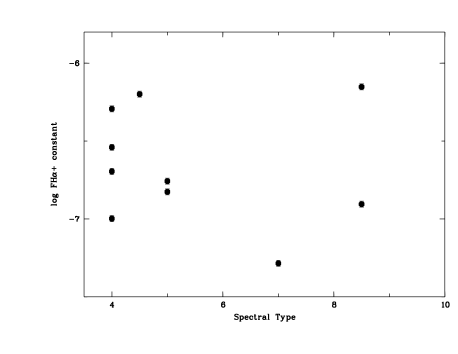
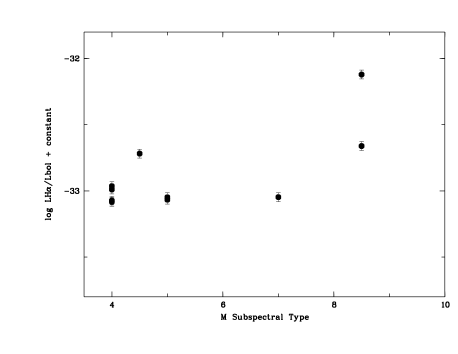
The upper panel in Fig. 10 shows log F̃Hα versus the spectral type for our objects in Corona Australis. Although the values of the H pseudoflux are consistent with those measured in other star forming regions, in Corona Australis we do not see a decrease of log F̃Hα with later spectral type (compare the upper panel of Fig. 10 with the upper panels of Fig. 14 in Paper (1) and Fig. 8 in Paper (2)). On the other hand, no trend with the spectral type is found either in the ratio of H pseudoluminosity to bolometric luminosity, L̃Hα/Lbol.444The bolometric luminosity was computed from the I-magnitude and estimated spectral type for each object as in Comerón et al. (comeron00 (2000)). This is in agreement with our results in other regions (cf. Paper (1) and Paper (2)).
6 No brown dwarfs in Chamaeleon II?
Our survey in Chamaeleon II has provided no good candidate members in this star forming region. Our only H emitter has been almost completely discarded as a young very low-mass object, because its inferred mass and spectral type from optical and near-infrared photometry are not consistent with each other. It seems also unlikely that the objects without H emission detected by 2MASS are members of Chamaeleon II, since they do not exhibit appreciable near-infrared excesses.
Although the surveyed area is relatively large, these results do not automatically imply a lack of brown dwarfs in Chamaeleon II. Not all young objects show H emission or near-infrared excess; thus, it cannot be excluded that some of the objects in our candidate list might eventually turn out to be young members of this dark cloud. Furthermore, it must be taken into account that Chamaeleon II is a very large region: It has an extension of about 1.5 deg2 and contains eleven cores according to C18O measurements (Mizuno et al. mizuno99 (1999)). Our field ChaII-3 covers only part of one of these cores. Moreover, given the large and variable extinction in this region, objects deeply embedded in the cloud might not be detectable at optical passbands. Hence, the apparent lack of brown dwarfs inferred from our survey might be due to selection effects.
Another thing to keep in mind is that very few T Tauri stars (the higher mass counterparts to the young brown dwarfs) are known in Chamaeleon II. The brown dwarf population identified so far in the neighbouring Chamaeleon I cloud is about 10% of its stellar population (e.g. Comerón et al. comeron00 (2000); Paper (1); Luhman 2004a ). If the same ratio held also for Chamaeleon II, we would expect to find only two brown dwarfs in this dark cloud.
7 Conclusions
We have presented the results of a deep multi-band survey in the Corona Australis and Chamaeleon II star forming regions. Low-mass member candidates were selected from and H photometry, and spectral types were assigned by means of their – colours.
In Corona Australis, we identified ten stars and three brown dwarf candidates in an area of about 0.6 deg2, mostly located in the area of the Coronet cluster. All but one of these objects exhibit H emission according to their H colours. The only non-emitter included in our final sample, CrA 466, is the probable counterpart of an ISOCAM source with mid-infrared excess. Its H emission is not clear in our data due to the photometric errors. Apart from this low-mass star, other four objects from our candidate list had been detected by ISOCAM, but only one, CrA 4107, shows a mid-infrared excess. This M4.5 object is also a strong H emitter. Hence, it is most probably surrounded by an accretion disk.
There is no obvious difference in the spatial distribution of stars and brown dwarf candidates: They all tend to be clustered around the intermediate mass star R CrA. However, the number of objects is too low to drive any significant conclusions about their formation process from this distribution.
The visual binary frequency of our Corona Australis objects is very low: None of our candidate members has a close neighbour with colours suggesting membership of the star forming region. The only exception is the brown dwarf candidate CrA 444, which has a faint close companion in our deep exposure. More observations are needed to certify whether this is a real double system.
In Chamaeleon II, an area of about 0.6 deg2 was observed to the North-West of the cloud. We do not find any good candidate members in this region. Our only H emitter, ChaII 376, seems to be a foreground star. A pair of very faint objects, ChaII 304 and ChaII 305, are identified with a near-infrared source from the 2MASS survey. The colours of these objects are consistent with two low-mass brown dwarfs or planetary mass objects close to the deuterium burning limit. However, they need spectral confirmation of their true nature. The rest of objects could be extincted young Chamaeleon II members or older field stars. Since none of them shows H emission or an infrared excess, nothing can be stated until spectroscopy is available for them.
Given these results and the uncertainties in our analysis, we are led to the conservative conclusion that it is unlikely that the identified candidates are substellar members of Chamaeleon II. Hence, our data seem to indicate a lack of brown dwarfs in this dark cloud. We cannot exclude, however, that this result is a consequence of having surveyed only a limited region. The Chamaeleon II dark cloud has an extension of about 1.5 deg2 and contains eleven cores according to C18O measurements (Mizuno et al. mizuno99 (1999)). Moreover, deeply embedded brown dwarfs might not be detected in optical passbands. Larger and deeper surveys are needed to state if the deficit of brown dwarfs observed here is real.
Acknowledgements.
We acknowledge much support from I. Baraffe and F. Allard, providing us with synthetic photometry from their brown dwarf models. We are also very grateful to C. Bailer-Jones for his help with the field selection, and to A. Scholz for useful discussions. J. E. kindly thanks E. Pompei and the 2p2-team for their support during the observations. This publication makes use of data products from the Two Micron All Sky Survey (2MASS), a joint product of the University of Massachussets and the Infrared Processing and Analysis centre/California Institute of Technology, funded by the US National Aeronautics and Space Administration and the US National Science Foundation. We used the SIMBAD database and the Vizier catalogue service, both operated at the Centre de Données astronomiques de Strasbourg (CDS) in Strasbourg (France), as well as the NASA/IPAC Infrared Science Archive, operated by the Jet Propulsion Laboratory, California Institute of Technology, under contract with the US National Aeronautics and Space Administration. This work was supported by the German Deutsche Forschungsgemeinschaft (DFG), projects EI 409/7-1 and EI 409/7-2. B. L. M. acknowledges financial support from the Spanish Ministerio de Educación y Ciencia through a Juan de la Cierva fellowship.References
- (1) Alcalá, J. M., Radovich, M., Silvotti, R. et al. 2002, Proc. SPIE, 4836, 406
- (2) Apai, D., Pascucci, I., Henning, Th. et al. 2002, ApJ 573, L115
- (3) Baraffe, I., Chabrier, G., Allard, F., & Hauschildt, P. H. 1998, A&A 337, 403
- (4) Barrado y Navascués, D., Stauffer, J., Briceño, C. et al. 2001, ApJS 134, 103
- (5) Barrado y Navascués, D. Mohanty, S. & Jayawardhana, R. 2004a, ApJ 604, 248
- (6) Barrado y Navascués, D. & Jayawardhana, R. 2004b, ApJ 615, 840
- (7) Bate, M. R., Bonnell, I. A. & Bromm, V. 2003, MNRAS 339, 557
- (8) Béjar, V. J. S., Zapatero Osorio, M. R. & Rebolo, R. 1999, ApJ 521, 671
- (9) Bertin, E. & Arnouts, S. 1996, A&AS 117, 393
- (10) Bessell, M. S. & Brett, J. M. 1988, PASP 100, 1134
- (11) Chabrier, G., Baraffe, I., Allard, F., & Hauschildt, P. 2000, ApJ 542, 464
- (12) Comerón, F., Neuhäuser, R. & Kaas, A. A. 2000, A&A 359, 269
- (13) Comerón, F., Fernández, M., Baraffe, I. et al. 2003, A&A 406, 1001
- (14) Comerón, F., Reipurth, B., Henry, A. & Fernández, M. 2004, A&A 417, 583
- (15) Delgado Donate, E., Clarke, C. J. & Bate, M. R. 2003, MNRAS 342, 926
- (16) Fernández, M. & Comerón, F. 2001, A&A 380, 264
- (17) Gauvin, L. S. & Strom, K. M. 1992, ApJ 385, 217
- (18) Graham, J. A. 1991, in: Reipurth, B. (Ed.), ESO Scientific Report No.11, Low Mass Star Formation in Southern Molecular Clouds, 185
- (19) Hughes, J. D., Hartigan, P., Graham, J. A. et al. 1991, ApJ 101, 1013
- (20) Hughes, J. D. & Hartigan, P. 1992, AJ 104, 680
- (21) Jayawardhana, R., Mohanty, S. & Basri, G. 2002, ApJ 578, L141
- (22) Jayawardhana, R., Mohanty, S. & Basri, G. 2003, ApJ 592, 282
- (23) Kirkpatrick, J. D., Henry, T. J. & McCarthy, D. W. 1991, ApJS 77, 417
- (24) Kroupa, P. & Bouvier, J. 2003, MNRAS 346, 369
- (25) Lamm, M. H., Mundt, R., Bailer-Jones, C. A. L. & Herbst, W. 2005, A&A 430, 1005
- (26) Landolt, A. U. 1992, AJ 104, 340
- Paper (1) López Martí, B., Eislöffel, J., Scholz, A. & Mundt, R. 2004, A&A 416, 555 (Paper 1)
- Paper (2) López Martí, B., Eislöffel, J., & Mundt, R. 2005, A&A, in press (Paper 2)
- (29) Loren, R. B. 1979, ApJ 227, 832
- (30) Luhman, K. L. 1999, ApJ 525, 466
- (31) Luhman, K. L. 2004, ApJ 602, 816
- (32) Marraco, H. G. & Rydgren, A. E. 1981, AJ 86, 62
- (33) Martín, E. L., Dougados, C., Magnier, E., et al. 2001, ApJ 561, L195
- (34) Mizuno, A., Hayakawa, T., Tachihara, K., et al. 1999, PASJ 51, 859
- (35) Mohanty, S., Jayawardhana, R., Natta, A. et al. 2004, ApJ 609, L33
- (36) Mohanty, S., Jayawardhana, R. & Basri, G. 2005, ApJ 626, 498
- (37) Natta, A. & Testi, L. 2001, A&A 376, L22
- (38) Neuhäuser, R., Walter, F. M., Covino, E. et al. 2000, A&ASS 146, 323
- (39) Olofsson, G., Huldtgren, M., Kaas, A. A. et al. 1999, A&A, 350, 883
- (40) Padoan, P. & Nordlund, Å 2002, ApJ 576, 870
- (41) Pascucci, I., Apai, D., Henning, Th. et al. 2003, ApJ590, L111
- (42) Patten, B. 1998, in: Donahue, R. A. & Bookbinder, J. A. (Eds.): The Tenth Cambridge Workshop on Cool Stars, ASP Conf. Ser. 125, 34
- (43) Persi, P., Marenzi, A. R., Gómez, M., & Olofsson, G. 2003, A&A, 399, 995
- (44) Reipurth, B. & Clarke, C. 2001, AJ 122, 432
- (45) Rieke, G. K. & Lebofsky, M. J. 1985, ApJ 288, 618
- (46) Scholz, A. & Eislöffel, J. 2004, A&A 429, 1007
- (47) Schwartz, R. D. 1977, ApJS 35, 161
- (48) Schwartz, R. D. 1991, in ESO Scientific Report No.11, Low Mass Star Formation in Southern Molecular Clouds, Ed. Reipurth, B., 93
- (49) Sterzik, M. F., Pascucci, I., Apai, D., et al. 2004, A&A 427, 245
- (50) Stetson, P. B. 1987, PASP 99, 191
- (51) Taylor, K. N. R. & Storey, J. W. V. 1984, MNRAS 209, 5P
- (52) Testi, L., Natta, A., Comerón, F. et al. 2002, A&A 393, 597
- (53) Vuong, M.H., Cambrésy, L. & Epchtein, N., 2001, A&A 379, 208
- (54) Walter, F. M., Vrba, F. J., Wolk, S. J. et al. 1997, AJ 114, 1544
- (55) Wang, H., Mundt, R., Henning, Th. & Apai, D. 2004, ApJ 617, 1191
- (56) Whittet, D. C. B., Prusti, T., Franco, G. A. et al. 1997, A&A 327, 1194
- (57) Whitworth, A. P. & Zinnecker, H. 2004, astro-ph/0408522
- (58) Wilking, B. A., Greene, T. P., Lada, C. J. et al 1992, ApJ 397, 520
- (59) Wilking, B. A., Mc Caughrean, M. J., Burton, M. G. et al 1997, AJ 114, 2029
- (60) Wilking, B. A., Greene, T. P. & Meyer, M. L. 1999, AJ 117, 469
- (61) Young, K. E., Harvey, P. M., Brooke, T. Y. et al. 2005, astro-ph/0503670