Cross-Correlation analysis of WMAP and EGRET in Wavelet Space
Abstract
We cross correlate the Wilkinson Microwave Anisotropy Probe (WMAP) first year data and the diffuse gamma-ray intensity maps from the Energetic Gamma Ray Experiment Telescope (EGRET) using spherical wavelet approaches. Correlations at significance level have been detected, at scales around in the WMAP foreground cleaned W-band and Q-band maps, based on data from regions that are outside the most conservative WMAP foreground mask; no significant correlation is found with the Tegmark cleaned map. The detected correlation is most likely of Galactic origin, and thus can help us probing the origins of possible Galactic foreground residuals and ultimately removing them from measured microwave sky maps.
Subject headings:
cosmic microwave background — cosmic rays — diffuse radiation — methods: data analysis1. Introduction
The study of the anisotropies of the cosmic microwave background (CMB) is a powerful tool in cosmology. Results from the Wilkinson Microwave Anisotropy Probe (WMAP) provide us with the angular power spectrum and its cosmological implications (Bennett et al. 2003a; Spergel et al. 2003; Page et al. 2003). However unwanted signals due to foregrounds would contaminate any intrinsic signals, most importantly on large angular scales (Tegmark & Efstathiou 1996; de Oliveira-Costa et al. 2003).
The WMAP team chose the CMB-dominated bands (two Q-band maps at 40.7 GHz, two V-band maps at 60.8 GHz and four W-band maps at 93.5 GHz) and combined them to give a signal-to-noise ratio enhanced map. Despite that the maps at selected frequencies are dominated by CMB, Galactic foregrounds as well as extragalactic point sources all contribute significantly to the map, where the WMAP team performed a foreground template fit (thermal dust from Finkbeiner et al. 1999; free-free from Finkbeiner 2003 and Schlegel et al. 1998; synchrotron from Haslam et al. 1982) to avoid the Galactic emissions and separated them from the underlying CMB signal according to the frequency-dependence property of foregrounds (Bennett et al. 2003b). Since the foreground fluctuations depend on the multipole moment as well (Bouchet et al. 1995), -dependent statistical weights have been applied in Tegmark et al. (2003) where an independent foreground analysis was made. Several works of WMAP non-Gaussianity detection found residuals or the systematic effect correction as the sources (Chiang et al. 2003; Chiang & Naselsky 2004; Naselsky, Doroshkevich & Verkhodanov 2003, 2004; Eriksen et al. 2004; Hansen et al. 2004; Liu & Zhang 2005).
Wibig and Wolfendale (2005) have shown evidence that the Tegmark cleaned map contains residual foregrounds possibly induced by cosmic rays, where the Energetic Gamma Ray Experiment Telescope (EGRET) diffuse gamma-ray intensity map (Hunter et al. 1997) was adopted as the Galactic tracer. Diffuse Galactic gamma-ray emission is supposedly produced in interactions of Galactic cosmic rays with the interstellar gas and radiation field, and thus provides us with an indirect measurement of cosmic rays in various locations in the Galaxy 111See Bertsch et al. 1993 and Hunter et al. 1997 for three-dimensional modeling. In this paper we cross-correlate the WMAP first-year data and the EGRET maps, which are based on more data and more complete point-source subtraction (Cillis & Hartman 2005), in wavelet space to probe the origins of potential residual foregrounds with characteristic scales. Both the WMAP combined foreground cleaned maps (Bennett et al. 2003b) and the Tegmark cleaned map (Tegmark et al. 2003) have been used.
2. Cross-correlation in wavelet space
A measure of the correspondence of two data sets on the sphere is the angular cross-correlation function , which represents how the two measures of the sky separated by an angle are correlated. Previous works have performed the cross correlation of the CMB data and the nearby galaxy density tracers in search for the Integrated Sachs-Wolfe effect (ISW) (Boughn & Crittenden 2002, 2004; Nolta et al. 2004; Fosalba & Gaztañaga 2004; Fosalba et al. 2004; Afshordi et al. 2004; Vielva et al. 2004b). As being performed in Vielva et al. (2004b), cross-correlation studies can also be made in wavelet space.
Wavelet approach is very useful for detecting signals with a characteristic scale that a most optimal detection can be made by filtering the data at a given scale, thus structures at that scale are amplified. It has been adopted in the CMB-related analysis for non-Gaussianity studies (Hobson et al. 1999; Barreiro et al. 2000; Aghanim et al. 2003; Cayón et al. 2001, 2003; Martínez-González et al. 2002; Mukherjee & Wang, 2004; Vielva et al. 2004a; McEwen et al. 2004; Liu & Zhang 2005). In wavelet space, the cross-correlation covariance at a given scale is defined as (Vielva et al. 2004b):
| (1) |
where and are the wavelet coefficients of the WMAP and EGRET data at position on the sky map, and the sum is extended over all the pixels () that are not masked by the Galactic mask “Kp0”. Equation (1) gives the auto-correlation covariance (ACC) when the two data sets are the same. To make the analysis more robust and less sensitive to any discrepancies between CMB data and simulations, we use the dimensionless and normalized cross-correlation coefficient as the test statistics, which is given by , where and are the WMAP and EGRET auto-correlation covariances respectively.
The wavelet coefficients are obtained by convolving the map with a certain spherical wavelet basis at a given scale:
| (2) |
where is the spherical wavelet basis and is the data set to be analyzed. The spherical wavelet can be obtained from the Euclidean Wavelet counterpart following the stereographic projection suggested by Antoine & Vanderheynst (1998). Martínez-González et al. (2002) has described the projection for the Spherical Mexican Hat Wavelet (SMHW) as well as its properties, whereas the Spherical Morlet Wavelet (SMW) has been applied for non-Gaussianity detection in the WMAP data (McEwen et al. 2004, Liu & Zhang 2005). In this correlation study we have adopted both wavelets, of which the SMW seems to be more sensitive than the SMHW. We only present results from the SMW analysis here, even though similar correlations are also found when applying the SMHW.
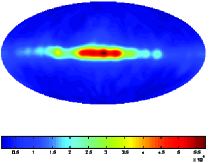
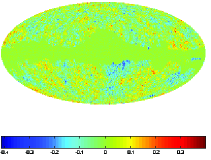
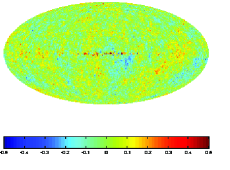
The preprocessing pipelines for the WMAP CMB data and Monte Carlo simulations are the same as in Liu & Zhang (2005), whereas the gamma-ray intensity maps are degraded to the same resolution with the CMB data to be cross-correlated, all in equi-angular spherical grid pixalisation. The preprocessed maps are shown in Fig. 1. 10,000 simulations of the WMAP data have been applied, following the cosmological model given by the Table 1 of Spergel et al. (2003), to obtain the significance levels of any correlation detection. We obtain these levels in a robust way by taking into account the probability distribution of the wavelet cross-correlation coefficient at each scale. Although the map-making algorithm presented by Cillis and Hartman (2005) possibly produced some systematic effects in the EGRET data, these can be calibrated out by simulations.
3. Results
Cross correlation with the EGRET maps in wavelet space has been performed to both of the Q-V-W combined WMAP map and the Tegmark cleaned map to detect foreground residuals (here and throughout, all WMAP CMB maps used are foreground removed maps). Also we have performed the analysis to: (a) the WMAP map in each band separately, i.e. Q, V, and W; (b) systematic beam and noise maps from subtracting maps of the receivers at the same frequency; and (c) a foreground map almost free of CMB, which is made by subtracting the two receivers of Q band and the two receivers of V band from the four receivers of W band (Vielva et al. 2004a).
For every CMB related map, we have performed the analysis using EGRET maps in different energy ranges separately, i.e. MeV, MeV, MeV and GeV, and only the results from the GeV map are shown here because: (a) it has been stated by Cillis & Hartman (2005) that the GeV intensity map has the best statistical accuracy compared with others from lower energy ranges, where possible correlations can be smeared out by statistical uncertainty fluctuations; and (b) the analysis with different gamma-ray energy ranges stated above generally give similar correlations and the significance level seems to increase a little with the energy of the adopted gamma-ray data. Note this variance of correlation significance does not conflict with the power-law energy spectrum, since the cross-correlation coefficient is a normalized quantity.
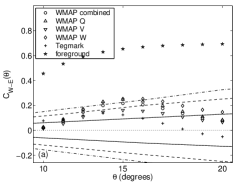
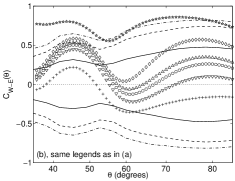
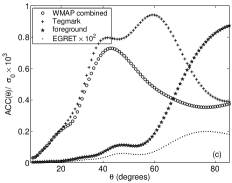
The cross-correlation coefficients are illustrated in Figs. 2(a) and 2(b), where the corresponding size on the sky can be obtained from equation (3) in Liu & Zhang (2005); we have analyzed scales from to , where we are only concerned about results at scales due to the angular resolution limit in the EGRET data. We have shown the ACCs (normalized by the map dispersion in the real space) of the WMAP combined map, the Tegmark cleaned map, the foreground-component map and the diffuse gamma-ray intensity map in Fig. 2(c), which indicate that the general patterns of in Figs. 2(a) and 2(b) are caused by the convolution of the gamma-ray data and the wavelets, not by systematical artifacts. Note at all the concerned scales the foreground map correlates more significantly with the EGRET map, consistent with the assumption that most of the foregrounds have been removed from the CMB maps. Results from analyzing the systematic beam and noise maps are not shown since their correlation coefficients are all consistent with zero values within statistical fluctuations.
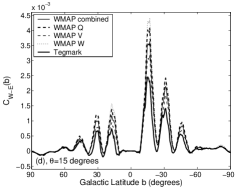
For the WMAP CMB maps, correlations at significant level are detected at scales from about to , in the W-band and Q-band maps; less significant correlations () are found at larger scales, from about to , only in the W-band map. In sum, the W-band and Q-band maps exhibit more significant correlations compared with those from the V-band map, at all the concerned scales. This frequency dependence feature can be easily understood according to Fig. 10(a) in Bennett et al. (2003b), showing evidence that the detected correlations are caused by residual foreground signals. In order to test whether the detected signal has a Galactic origin, we have shown in Fig. 2(d) the cross-correlation coefficients as a function of the galactic latitude around . Note that the sum of the cross-correlation coefficients at all the latitudes in Fig. 2(d) corresponds to the in Figs. 2(a). Here the oscillating pattern is given by the SMW, and we have tested that the outline profile is caused by the EGRET intensity maps. Tests at other scales also present similar profiles. The results show some consistency with the co-sec law for the Galactic components, and also present a north-south asymmetry where the correlation is stronger in the southern hemisphere.
Analysis of the Tegmark cleaned map does not show any significant correlation at all the concerned scales, as an evidence that it is “cleaner” than the WMAP combined map.
4. Conclusions and Discussions
We have performed cross-correlation analysis of the WMAP first-year data with the EGRET diffuse gamma-ray intensity maps in wavelet space, finding correlations in the WMAP foreground cleaned maps, based on regions that are outside the most conservative WMAP foreground mask. Analysis of the WMAP W-band and Q-band maps exhibits correlation at significant level at scales around in the sky, and at scales around less significant correlation () is found only in the WMAP W-band map. The Tegmark cleaned map seems to be compatible with pure CMB simulations at all the concerned scales.
These cross-correlation signals are not caused by systematic beams nor noise because: (a) the analysis of the systematic beam and noise map show almost zero correlation results; and (b) the correlations are detected at the scales where noise and beam effects can be ignored (Tegmark et al. 2003). We thus conclude that these cross-correlation signals are most probably caused by foreground residuals because: (a) correlations from the Q and W bands are more significant than those from the V band, consistent with the frequency dependence nature of foreground; (b) the correlation coefficients from the CMB maps present similar patterns with those from the foreground map, whereas random simulations do not show correlations at the the detected level; (c) the Tegmark cleaned map, which has been commonly believed to be cleaner than the WMAP combined map in terms of the foreground removal, shows no significant correlation with the EGRET map in the analysis; and (d) the detected cross-correlation coefficient as a function of the galactic latitude appears to be consistent with the co-sec law as an evidence for the Galactic origin. It is possible that these foreground residuals may be induced by cosmic rays, since the Galactic diffuse gamma-ray emission is supposedly produced in interactions of cosmic rays with gas and ambient photon fields and thus can be an indicator of cosmic rays in various locations in the Galaxy.
The detected foreground residuals can be located in the coefficient map at a certain scale. It is therefore worthwhile to make correlation study with cosmic ray’s spatial and spectral distributions in detail. Note that the diffuse gamma-ray emission has not been well understood that at energies GeV the observed intensity in inner Galaxy displays a GeV excess at a level of compared with predictions (Hunter et al. 1997), which has been interpreted in several models (Strong et al. 2000; de Boer 2005). Further cross-correlation work must be done to fully understand the nature of foreground residuals and finally remove them from the CMB maps completely, in order to minimize the impacts of foreground residuals to the cosmological studies of CMB.
Acknowledgement: We are very grateful to the anonymous referees whose extremely detailed and insightful comments and suggestions allowed us to clarify several issues and improve the readability of the paper. This research has made use of the Astrophysical Integrated Research Environment (AIRE) which is operated by the Center for Astrophysics, Tsinghua University. We acknowledge the use of LAMBDA, support for which is provided by the NASA Office of Space Science, the YAWtb (http://www.fyma.ucl.ac.be/projects/yawtb) toolbox developed by A. Coron, L. Jacques, A. Rivoldini and P. Vandergheynst, the software packages HEALPix (http://www.eso.org/science/healpix), developed by K.M. Gorski, E. F. Hivon, B. D. Wandelt, J. Banday, F. K. Hansen and M. Barthelmann., and CMBFAST (http://www.cmbfast.org), developed by U. Seljak and M. Zaldarriaga. This study is supported in part by the Special Funds for Major State Basic Research Projects and by the National Natural Science Foundation of China. SNZ also acknowledges partial funding support from the US NASA Long Term Space Astrophysics program.
References
- (1) Afshordi, N., Loh, Y.-S., & Strauss, M. A. 2004, Phys. Rev. D, 69, 3524
- (2) Aghanim, N., Kunz, M., Castro, P. G., & Forni, O. 2003, A&A, 406, 797
- (3) Antoine, J.-P., & Vandergheynst, P. 1998, J. Math. Phys., 39, 3987
- (4) Barreiro, R. B., et al. 2000, MNRAS, 318, 475
- (5) Bennett, C. L., et al. 2003a, ApJS, 148, 1
- (6) Bennett, C. L., et al. 2003b, ApJS, 148, 97
- (7) Bertsch, D. L., et al. 1993, ApJ, 416, 587
- (8) Boughn, S. P., & Crittenden, R. G. 2002, Phys. Rev. Lett., 88, 21302
- (9) Boughn, S. P., & Crittenden, R. G. 2004, Nature, 427, 45
- (10) Bouchet, F., et al. 1995, Space Science Review, astro-ph/9410004
- (11) Cayón, L., et al. 2001, MNRAS, 326, 1243
- (12) Cayón, L., et al. 2003, MNRAS, 339, 1189
- (13) Chiang, L.-Y., Naselsky, P. D., Verkhodanov, O. V., & Way, M. J. 2003, ApJ, 590, L65
- (14) Chiang, L.-Y., & Naselsky, P. D. 2004, astro-ph/0407395
- (15) Cillis, A. N., & Hartman, R. C. 2005, ApJ, 621, 291
- (16) de Boer, W. 2005, New Astron.Rev., 49, 213
- (17) de Oliveira-Costa, A., et al. 2003, Phys. Rev. D, 68, 083003
- (18) Eriksen, H. K., Novikov, D. I., Lilie, P. B., Banday, A. J., Gorski, K. M. 2004, ApJ, 612, 64
- (19) Finkbeiner, D. P. 2003, ApJS, 146, 407
- (20) Finkbeiner, D. P., Davis, M., & Schlegel, D. J. 1999, ApJ, 524, 867
- (21) Fosalba, P., & Gaztañaga, E. 2004, MNRAS, 350, 37
- (22) Fosalba, P., Gaztañaga, E., & Castander, F. 2004, ApJ, 597, L89
- (23) Hansen, F. K., Cabella, P., Marinucci, D., & Vittorio, N. 2004, ApJ, 607, L67
- (24) Hartman, R. C., et al. 1999, ApJS, 123, 79
- (25) Haslam, C. G. T., Salter, C. J., Stoffel, H., & Wilson, W. E. 1982, A&AS, 47, 1
- (26) Hobson, M. P., et al. 1999, MNRAS, 309, 125
- (27) Hunter, S. D., et al. 1997, ApJ, 481, 205
- (28) Liu, X., & Zhang, S. N. 2005, ApJ, 633, 542
- (29) Martínez–González, E., et al. 2002, MNRAS, 336, 22
- (30) McEwen, J. D., et al. 2005, MNRAS, 359, 1583
- (31) Mukherjee, P., & Wang, Yun 2004, ApJ, 613, 51
- (32) Naselsky, P. D., Doroshkevich, A., & Verkhodanov, O. V. 2004, MNRAS, 349, 695
- (33) Naselsky, P. D., Doroshkevich, A., & Verkhodanov, O. V. 2003, ApJ, 599, L53
- (34) Nolta, M. R., et al. 2004, ApJ, 608, 10
- (35) Page, L., et al. 2003, ApJS, 148, 233
- (36) Schlegel, D. J., Finkbeiner, D. P., & Davis, M. 1998, ApJ, 500, 525
- (37) Spergel, D. N., et al. 2003, ApJS, 148, 175
- (38) Tegmark, M., & Efstathiou, G. 1996, MNRAS, 281, 1297
- (39) Tegmark, M., de Oliveira-Costa, A., & Hamilton, A. J. S. 2003, Phys. Rev. D, 68, 123523
- (40) Vielva, P., et al. 2004a, ApJ, 609, 22
- (41) Vielva, P., Martínez–González, E., & Tucci, M. 2004b, astro-ph/0408252
- (42) Wibig, T., & Wolfendale, A. W. 2005, MNRAS, 360, 236