An Optical Study of Stellar and Interstellar Environments of Seven Luminous and Ultraluminous X-ray Sources
Abstract
We have studied the stellar and interstellar environments of two luminous X-ray sources and five ultraluminous X-ray sources (ULXs) in order to gain insight into their nature. Archival Hubble Space Telescope images were used to identify the optical counterparts of the ULXs Ho IX X-1 and NGC 1313 X-2, and to make photometric measurements of the local stellar populations of these and the luminous source IC 10 X-1. We obtained high-dispersion spectroscopic observations of the nebulae around these seven sources to search for He II 4686 emission and to estimate the expansion velocities and kinetic energies of these nebulae. Our observations did not detect nebular He II emission from any source, with the exception of LMC X-1; this is either because we missed the He III regions or because the nebulae are too diffuse to produce He II surface brightnesses that lie within our detection limit. We compare the observed ionization and kinematics of the supershells around the ULXs Ho IX X-1 and NGC 1313 X-2 with the energy feedback expected from the underlying stellar population to assess whether additional energy contributions from the ULXs are needed. In both cases, we find insufficient UV fluxes or mechanical energies from the stellar population; thus these ULXs may be partially responsible for the ionization and energetics of their supershells. All seven sources we studied are in young stellar environments and six of them have optical counterparts with masses ; thus, these sources are most likely high-mass X-ray binaries.
1 Introduction
Very luminous X-ray sources with X-ray luminosities () in the range – ergs s-1 are often binaries with stellar mass black holes or, less frequently, neutron stars as primaries. In contrast, ultraluminous X-ray sources (ULXs) with ergs s-1 are of great interest because their bolometric luminosities surpass the Eddington limit for a 100 black hole ( ergs s-1). Although these unresolved, extragalactic, off-nuclear ultraluminous sources were first discovered with the Einstein X-ray Observatory (Fabbiano, 1989), systematic studies of ULXs and similar luminous sources have been made possible only recently by the high angular resolution afforded by the Chandra X-ray Observatory (Humphrey et al., 2003; Swartz et al., 2004).
While some of these objects may be associated with recent supernovae, or in some cases misidentified background active galactic nuclei (Swartz et al., 2004), there exist ULXs that exhibit variability over short time scales, indicating a compact nature (e.g., Strohmayer & Mushotzky, 2003). These compact ULXs may be binary systems containing black holes with masses of 102–104 (Colbert & Mushotzky, 1999; Wang et al., 2004). The existence of such intermediate-mass black holes (IMBHs) is intriguing, as they cannot be produced by current stellar evolutionary models. The hypothesis of a massive accreting black hole nature is supported by spectral analyses of several ULXs whose X-ray spectra can be successfully fitted with a regular or modified disk blackbody model, assuming an optically thick accretion disk (Colbert & Mushotzky, 1999; Makishima et al., 2000; Wang et al., 2004).
It has recently been suggested that thin accretion disks with inhomogeneities may produce fluxes exceeding the Eddington limit by factors of 10–100 (Begelman, 2002). Thus stellar mass black hole binaries could account for sources with luminosities up to ergs s-1. The more luminous sources with , however, may still harbor IMBHs (Miller et al., 2005). Alternatively, if ULXs radiate in the form of anisotropic “beams” in the direction of the observer, their luminosities would be sub–Eddington, a proposal that is not entirely implausible as examples exist of beamed Galactic X-ray sources (Liu, Bregman, & Seitzer, 2002). In this case, ULXs may contain more conventional black holes or neutron stars with masses (King et al., 2001).
The nature of a luminous X-ray source can be ascertained if its optical counterpart can be unambiguously identified (Liu et al., 2004). For example, M101 ULX-1 is coincident with a B supergiant, and their physical association is confirmed by the unresolved He II 4686 emission in the stellar spectrum; thus M101 ULX-1 is most likely a high-mass X-ray binary (HMXB; Kuntz et al., 2005). When optical counterparts cannot be uniquely identified, the local stellar population can be used to infer the nature of the sources; for example, the presence of early-type stars supports a HMXB origin (Liu et al., 2004; Roberts et al., 2001, 2003; Soria et al., 2005).
Observations of the local interstellar environment can also be used to infer the nature of these luminous X-ray sources (Pakull & Mirioni, 2002). Luminous X-ray sources are often observed to be surrounded by shell nebulae with diameters reaching up to several hundred parsecs, called “supershells”; the X-ray sources may contribute to the expansion and ionization of these nebulae (Pakull & Mirioni, 2003; Miller, 1995). Pakull, Grise, & Motch (2005) give two potential scenarios for the formation and expansion of such nebulae. The first scenario posits that the compact X-ray source and the diffuse nebula were both formed in a single supernova explosion; the second, that continuous input by stellar winds and/or jets creates a large “bubble” around the system. (Of course, these scenarios are not mutually exclusive.) Calculations of the energy required to create a supernova remnant, as required by the first hypothesis, equivalent to the observed nebulae around ULXs require explosions of ergs, which has led some authors to suggest these as the remnants of particularly energetic events, called “hypernovae” (e.g., Wang, 2002). Pakull, Grise, & Motch (2005) offers the more prosaic interpretation that the supernova may have exploded in the low-density surroundings of a pre-existing superbubble, brightening substantially as it hit the superbubble wall (e.g., Chu & Mac Low, 1990). The second hypothesis, of continuous energy input, encounters a similar problem of high input energies, as well as questions about the lifetime over which such a system will produce strong winds/jets. Again, these problems can be largely ameliorated if the system is within a pre-existing cavity.
Most importantly, nebulae photoionized by X-rays are “He III regions” in which He is present in the He+2 state and its recombination leads to He II 4686 emission (Pakull & Angebault, 1986). Therefore, the distribution of nebular He II emission and the nebular ionization requirement can be used to assess whether the source emits beamed radiation (e.g., Pakull & Mirioni, 2002; Kaaret et al., 2004). Another possibility, as Pakull & Mirioni (2003) suggest, is that these nebulae are shock-ionized by same processes that generate the mechanical energy inputs discussed above. However, in low-density regions this process will have very low efficiency. A third scenario is that the nebula was flash-ionized in a very energetic explosion, and is still in the recombination stage; but the lifetime of this phase is not long (of order /, where is the ambient density). All in all, the coupling of energetics between the ULX and the nebula is not well understood. A critical study of supershells associated with luminous X-ray sources may provide insight into their nature and energetics, just as studies of supershells that are hypernova remnant candidates have been used to assess their energetics and confirm their nature (Lai et al., 2001; Chen et al., 2002).
We have obtained high-dispersion echelle spectroscopic observations of the nebular environments of seven luminous X-ray sources. These data are used to search for He II emission and to study the kinematics of the surrounding medium. Additionally, we have utilized archival Hubble Space Telescope (HST) images to study the local stellar populations for some of these sources. In this paper, we report our observations and reduction in §2, and analyze individual objects in §3. The conclusions are summarized in §4.
2 Observations and Reduction
2.1 High-Dispersion Echelle Spectroscopic Observations
High-dispersion spectra of the nebular environments of luminous X-ray sources were obtained with the echelle spectrographs on the 4 m telescopes at Kitt Peak National Observatory (KPNO) from an observing run in 2003 November and at Cerro Tololo Inter-American Observatory (CTIO) in 2004 January. The KPNO observations were all made in the multi-order observing configuration, using the 79 line mm-1 echelle grating, G226-1 cross dispersor, a GG385 filter, the red long focus camera, and a Tek2K CCD (T2KB). A slit width of 300 m (2″) was used, giving an instrumental FWHM of 181 km s-1 in the H line. The pixel size of 24 m corresponds to 026 along the spatial axis and 0.082 Å along the dispersion for the H line. The observations covered a wavelength range of 4500–6900 Å.
The CTIO observations were made in both the multi-order/short-slit and the single-order/long-slit observing configurations. The multi-order configuration used a setup similar to that used in the KPNO observations, but with a SITe2K#6 CCD, which had the same pixel size and thus the same scales as the T2KB. These observations covered a wavelength range of 4400–6900 Å. The single-order configuration used the 79 line mm-1 echelle grating with a flat mirror replacing the cross disperser, and a post-slit H filter ( = 6563 Å, = 75 Å) was inserted to isolate a single order. This spectral coverage is wide enough to include both the H line and the flanking [N II] 6548, 6583 lines. For both configurations, a slit width of 250 m (164) was used, and the resulting FWHM of the instrumental profile was km s-1.
For both the KPNO and CTIO observations, the spectral dispersion was calibrated by a Th-Ar lamp exposure taken in the beginning of the night, but the absolute wavelength was calibrated against the geocoronal H line present in the nebular observations. A journal of the echelle observations is given in Table 1. A total of seven nebulae were observed. The luminous source LMC X-1 is included to assess the feasibility of our echelle observing configuration, as it is known to possess a He III region (Pakull & Angebault, 1986).
As X-ray sources are not visible, target acquisitions often need to be made through blind-offset from nearby bright stars. The ionized nebulae associated with our target X-ray sources are very faint, so their observations are very sensitive to sky conditions and moonlight. Furthermore, these objects are mostly at megaparsec distances, and have angular diameters of only a few arcseconds. Owing to these difficulties, we missed the key position of two objects, Ho II X-1 and IC 342 X-1 and hence they will be discussed in the appendix. However, we were able to collect useful H spectra for Ho IX X-1, IC 10 X-1, M 81 X-6, and NGC 1313 X-2, in addition to LMC X-1. These observations are analyzed in this paper.
2.2 Hubble Space Telescope Images
To study the stellar environments of our sources, we have used the archival HST continuum images of Ho IX X-1, IC 10 X-1, M81 X-6, and NGC 1313 X-2. These observations, listed in Table 2, were made with either the Wide Field Planetary Camera 2 (WFPC2) or the Advanced Camera for Surveys (ACS). The calibrated pipeline-processed images were acquired from the MAST archive and photometry was carried out using the APPHOT package in IRAF.
3 Results for Individual Nebulae
We first analyze our observations of the He III nebula around LMC X-1 to illustrate the range of capabilities of our observing configuration, such as the ability to detect He II emission. We use the same method to analyze the nebulae around luminous X-ray sources and in some cases, we also analyze their stellar populations. Below we report on our detailed analysis of the five objects for which we obtained useful echelle observations. In addition, two objects for which we missed the key positions are discussed in the appendix.
3.1 LMC X-1
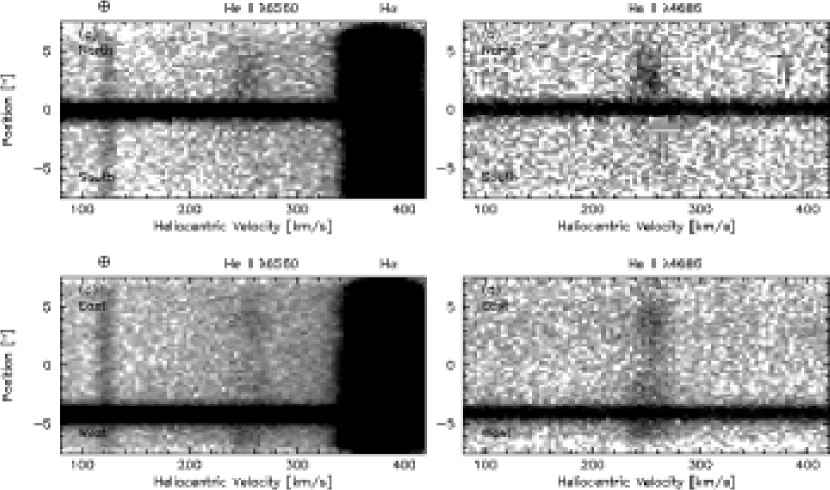
LMC X-1 is a = 1–2 ergs s-1 source (Schlegel et al., 1994) in the H II region N159F which has a size of 24′′, corresponding to 6 pc at the distance to the LMC, 50 kpc (Feast, 1999). We have N-S and E-W slit positions centered on the star R148 at a position 25 east of LMC X-1. In each case not only the He II 4686 line but also the He II 6560 line was detected (see Fig. 1). The He II 4686 line is narrow, with an observed FWHM of 0.390.07 Å, or 255 km s-1. The observed FWHM consists of contributions from the thermal width (11 km s-1 for He II at 104 K), instrumental broadening, and turbulence in the gas. Quadratically subtracting the thermal and instrumental widths from the observed width, we obtain a turbulent FWHM of 18 km s-1. The turbulence in the nebula photoionized by LMC X-1 is thus of order of 10 km s-1, comparable to the isothermal sound velocity of a 104 K medium. There is no highly supersonic motion in the He III nebula around LMC X-1. Therefore it does not appear that LMC X-1 is injecting a significant amount of mechanical energy into the interstellar medium. Our echelle observations of the He III nebula around LMC X-1 illustrate that high-dispersion spectroscopy provides a powerful way to study such objects.
3.2 Holmberg IX X-1 (M81 X-9)
This ULX was first cataloged as M81 X-9 based on Einstein observations (Fabbiano, 1989); however, it is projected within 2′ of the nucleus of Holmberg IX, corresponding to a projected separation of 2 kpc at a distance D 3.6 Mpc (Freedman et al., 1994), so it has also been referred to as Ho IX X-1. It is found at a position near the center of an ionized gas shell with km s-1 (Miller, 1995). This velocity is similar to the systemic velocity of Holmberg IX, 64 km s-1, as opposed to the negative velocities expected for M 81 at this position due to its rotation (Adler & Westpfahl, 1996). If the ULX is indeed associated with this ionized gas shell, it is likely a member of Holmberg IX; thus, we will call it Ho IX X-1 in this paper.
3.2.1 Optical Counterpart of Ho IX X-1
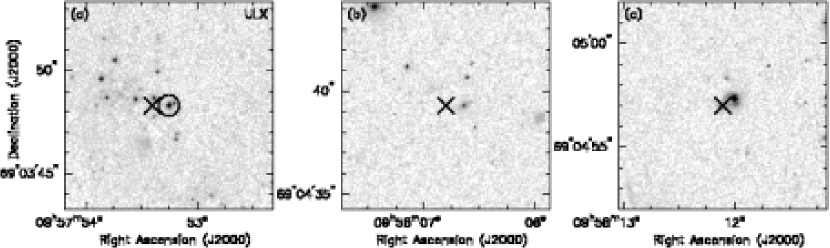
To search for an optical counterpart of Ho IX X-1, we have used archival Chandra ACIS-S observations (Seq Num 600406, Obs ID 4751) and HST ACS images listed in Table 2. We have used six stars in the USNO B1.0 catalog to determine astrometric solutions for the ACS image, resulting in an rms accuracy of . Our initial comparison of Chandra X-ray images with the HST optical images shows the centroid of the Ho IX X-1 source to be offset by from a bright star at 09h57m5325, 69∘03′483 (J2000.0). To verify the alignment of the X-ray and optical images, we searched for other X-ray sources within the ACIS-S B3 field and their possible optical counterparts. We found two faint X-ray sources at 9h58m068, 69∘04′393 (J2000.0) and 9h58m121, 69∘04′570 (J2000.0), respectively. At these X-ray positions, the ACS images show extended objects, possibly galaxies, at an offset of 05. Figure 2 shows that the offsets from the X-ray positions to the nearest optical objects are similar for all three X-ray sources. If we assume that these offsets are caused by pointing uncertainties of Chandra and HST, Ho IX X-1 would be coincident with the aforementioned star within 01. Therefore, we suggest that this bright star is the optical counterpart of the ULX Ho IX X-1.
3.2.2 Kinematics and Ionization of the Supershell around Ho IX X-1
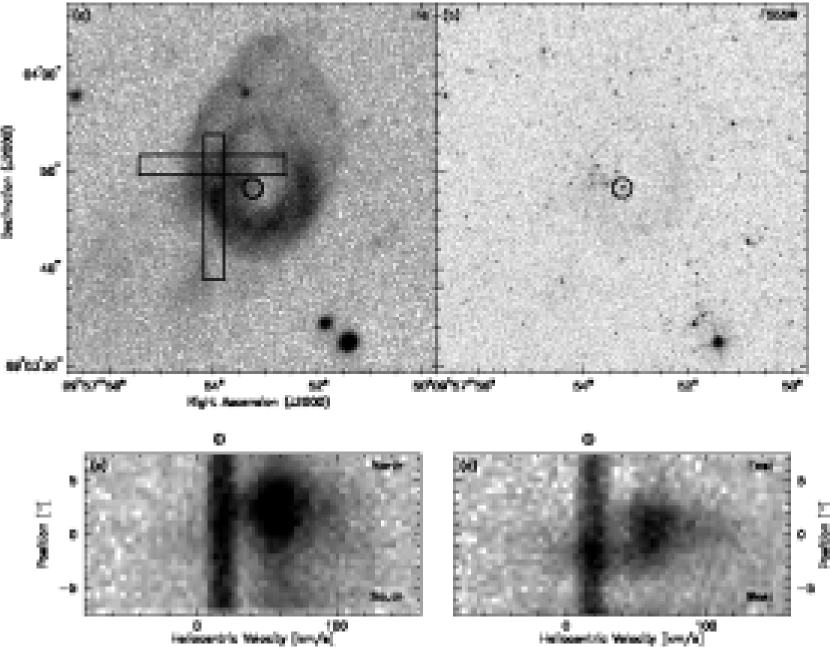
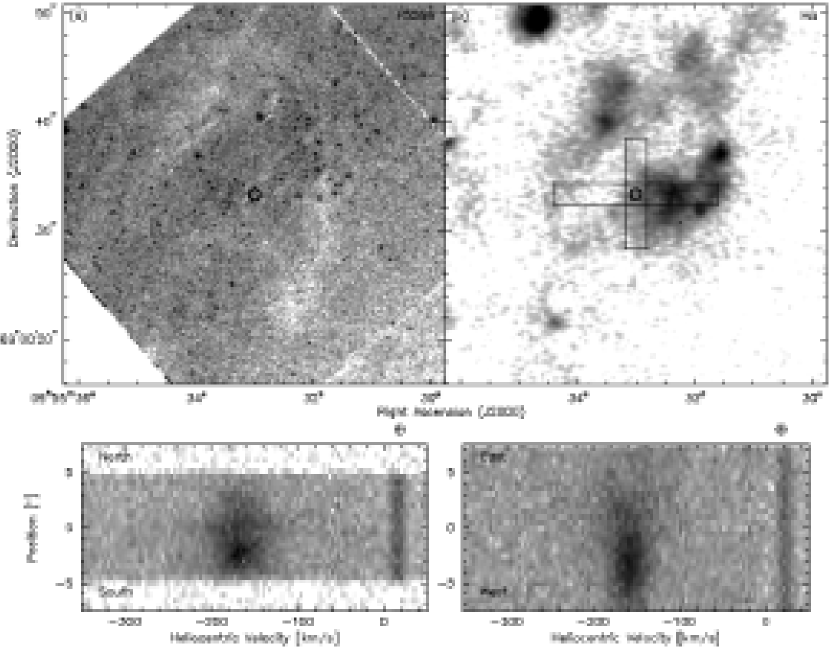
The ionized gas shell around Ho IX X-1 has been observed by Miller (1995) to have strong [S II] and [O I] line emissions that are characteristic of supernova remnants (SNRs). However, the shell size of 25, corresponding to pc, is much larger than those of known SNRs. It is possible that this shell is energized by an OB association that Miller (1995) describes as a knot of blue stars. The high-resolution H image presented by Pakull & Mirioni (2003) shows a complex nebular morphology consisting of a bright, thin, inner ring and a fainter and broader outer ring (see Fig. 3a).
We obtained echelle observations for two slit positions on the supershell around Ho IX X-1: a N-S slit along the eastern rim and a E-W slit from the eastern rim to the center of the shell (see Fig. 3). Nebular emission is detected in H, H, [O III] 4959, 5007, and [N II] 6548, 6583 lines, but not He II 4686 or 6560. The velocity structures appear similar in each of the lines detected, thus we use the strongest detection, the H line, for our analysis of the shell kinematics. Both slit positions show a bright emission component centered at km s-1. This velocity is in good agreement with the velocity of Holmberg IX, and is adopted as the systemic velocity of the shell. The E-W slit position shows faint emission extending up to = +60 and 80 km s-1 from the systemic velocity, while the N-S slit position shows faint emission up to = +70 and 100 km s-1. The velocity structure does not resemble that of a simple expansion: the highest velocity offsets along the N-S slit occur at the outer edge of the shell; the E-W slit shows a brighter blue-shifted component at the inner ring, but it is dominated by a red-shifted component at the outer ring. The 3-D structure of the shell may be pear-shaped, with the inner ring corresponding to the top of the pear which is expanding toward us (with a negative velocity), and the outer ring corresponding to the base which is expanding away from us (with positive velocity), suggestive of a bipolar expansion structure. While the expansion structure cannot be determined unambiguously, the overall expansion velocity is likely on the order of 80–100 km s-1.
The H flux of the ionized gas shell has been reported by Miller & Hodge (1994) to be ergs s-1 cm-2. This H emission requires an ionizing flux of photons s-1, if the nebula is optically thick (to ionizing photons). Assuming that the emitting material is distributed in a prolate ellipsoidal pc shell with a fractional shell thickness () of 0.1, we estimate the rms density of the shell to be 1.4 H-atom cm-3 and the shell mass to be . For an expansion velocity of 80 km s-1, the kinetic energy of the shell is ergs.
3.2.3 Local Stellar Population and Energy Consideration
To determine the roles played by the local stellar population, and possibly the ULX, in the ionization and energetics of the supershell, we examine the stellar content using the HST ACS images of Ho IX X-1. We have carried out photometry of stars in the F450W, F555W, and F814W bands, and transformed the results into the VEGAMAG system, which is similar to the Johnson system. We have produced color-magnitude diagrams (CMDs) in versus and versus , correcting for only a distance modulus of 27.78. The former was found to be more useful because the stars of interest are blue. This CMD of versus for stars within the shell is presented in Figure 4 (in filled symbols), overplotted with evolutionary tracks for massive stars from Lejeune & Schaerer (2001). The highest concentration of stars is distributed near and most likely represents the upper part of the main sequence. If these are O-stars with , the amount of reddening would be . We have applied this reddening correction to all stars and plotted them in open symbols in Figure 4. It is apparent that the main sequence stars detected are within the mass range of –, suggesting an age of 4–6 Myr for this OB association.
To determine the amount of stellar energy that has been injected into the surrounding medium, we need to know the number of supernovae that have exploded in the past and the masses and temperatures of the most massive living stars, but this information cannot be determined from the photometry alone. We therefore assume a Salpeter initial mass function, and estimate the massive stellar population by extrapolation from the observed main sequence stars in a lower mass range that is not seriously affected by incompleteness. We then use the relation , where is the number of stars, is a constant that can be determined from the star counts, is the mass, and and are the upper and lower mass limits. Five stars are observed to be in the 12–20 range, thus we estimate . The number of stars with mass greater than is , adopting an of 100 . Since we observe only one star with , we estimate roughly six supernovae have likely exploded. Assuming each supernova releases ergs of explosion energy, the total supernova energy input is approximately ergs, roughly half of the observed kinetic energy of the expanding shell. Additionally, using Starburst99 (Leitherer et al., 1999), we estimate a collective ionizing luminosity of 0.4–2.0 photons s-1, only 1/2 of that required by the observed H luminosity of the shell. Therefore, we conclude that the stellar population alone cannot provide sufficient energy to produce the observed kinematics and ionization of the nebula. It is possible that Ho IX X-1 supplies the additional required energy. Our echelle spectroscopic observations suggest that there may be a bipolar expansion. If this is the case, the source may be “beaming” X-ray emission into the nebula toward and away from us. As our echelle observations had limited spatial coverage, the suggested bipolar expansion needs to be confirmed in the future with kinematic observations over the full extent of the nebula.
3.3 IC 10 X-1
Using ROSAT HRI, IC 10 X-1 was discovered as a rather luminous X-ray source within the optical extent of the galaxy (Brandt et al., 1997). Recent Chandra and XMM-Newton observations show that IC 10 X-1 has a mean 0.3-8.0 keV luminosity of ergs s-1 and shows a large variation by a factor of up to 6 on time-scales of s (Wang et al., 2005). It was found to be within of the centroid of a nonthermal radio supershell 45′′ in diameter, corresponding to 150 pc at the distance of IC 10, Mpc (Yang & Skillman, 1993).
3.3.1 Optical Counterpart and Stellar Environment
A possible optical counterpart, an emission-line source, was identified as WR star [MAC92] 17 (Massey et al., 1992). This was later resolved into two components, [MAC92] 17A and B, of which only the A component is a WR star (Crowther et al., 2003). Recent Chandra and HST observations by Bauer & Brandt (2004) with improved spatial resolution and astrometric accuracy allowed further characterization of the nature of the X-ray source. They give a J2000.0 position 00h20m2909, 59∘16′5195 for the point source, and report a 0.5–8.0 keV absorbed flux of ergs cm-2 s-1 with faint emission extending up to away. Their observations support the association with [MAC92] 17A, located within 023 of the X-ray source. The high luminosity and variability of this X-ray source, and its likely association with the nearby WR star, lead them to hypothesize that the source is most likely a massive BH binary with a progenitor that evolved more rapidly, and would thus have been more massive than [MAC92] 17A.
We have carried out photometry using the HST ACS images in the F435W, F606W, and F814W bands, and constructed CMDs for a distance modulus of 24.23. The CMD of versus for stars in the vicinity of IC 10 X-1 is presented in Figure 5a. As IC 10 is located at a low Galactic latitude, the foreground extinction due to the Galactic plane is evident. Assuming that the bluest stars are main sequence stars with an intrinsic color of , the reddening is . We have applied this reddening correction to all stars and produced another CMD in Figure 5b, along with evolutionary tracks for massive stars (Lejeune & Schaerer, 2001). The most massive stars in the vicinity of the IC 10 X-1 have masses of 20. The lack of more massive stars suggests that this stellar population was formed about 4–6 Myr ago. This age is consistent with the what would be expected from the presence of a WR star, the optical counterpart of IC 10 X-1.
3.3.2 Complex Interstellar Environment
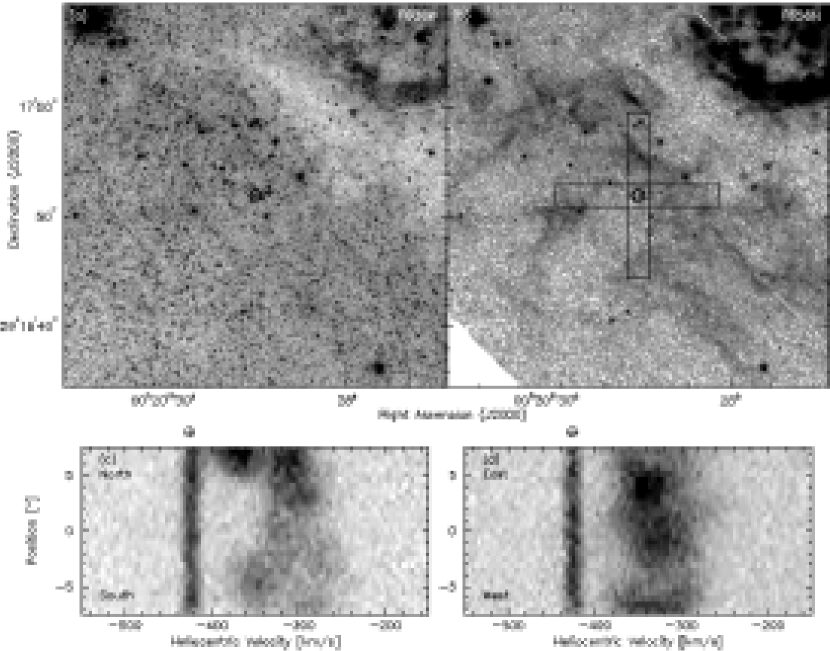
We obtained N-S and E-W echelle spectra with slit positions centered near IC 10 X-1 using a slit length of 15′′ (see Fig. 6). No He II line was detected. The spectral lines from the E-W slit position were uniform and symmetric and thus were useful in estimating a systemic velocity for the nebula, 330 km s-1, close to the systemic velocity of IC 10, 344 km s-1 (de Vaucouleurs et al., 1991). We apply this systemic velocity to the N-S spectrum which shows an expansion structure with low velocity at the center of the slit and higher velocities at the edges. We find an overall expansion velocity km s-1, somewhat higher than the 50–70 km s-1 found by Bullejos & Rosado (2002). It is not unusual that high-dispersion spectroscopy can detect emission at higher velocities than lower-dispersion spectroscopy.
The velocity structure along the N-S slit position does not represent a regular expanding shell. This is understandable as the H image in Figure 6b shows an irregular, filamentary structure that is best described as a turbulent, frothy interstellar medium. This interstellar structure may have resulted from the explosion of the most massive stars in the population around IC 10 X-1. This interstellar environment is too complex to assign specific features that have been energized by IC 10 X-1. It is thus difficult to assess unambiguously the influence of this X-ray source on its surrounding medium.
3.4 M81 X-6 (NGC 3031 X-11)
The ULX M 81 X-6 is located near a nebula with an enhanced [S II]/H ratio that was identified as the SNR MF 22 (Matonick & Fesen, 1997). Pakull & Mirioni (2003) presented a high-quality H image of this region revealing a large 260350 pc shell structure with the SNRs MF 22 and MF 23 on the southern and northern portions of the shell, respectively. Comparing Chandra and HST images, Liu, Bregman, & Seitzer (2002) identified a unique optical counterpart for M81 X-6, and further suggested it to be an O8 V star based on its colors and magnitudes.
To show the distribution of stars and the ionized interstellar gas near the ULX M81 X-6, we present an archival HST F555W image in Figure 7a and the continuum-subtracted H image from Pakull & Mirioni (2003) in Figure 7b. The continuum image shows regions of high extinction, and the H emission appears brightest in regions of lower extinction. We obtained two echelle spectra with N-S and E-W orientations. The slit positions are marked in Figure 7b and the data are shown in Figures 7c and 7d. The echellograms show a main velocity component at km s-1 with a FWHM of 30–40 km s-1. In addition, the N-S slit clearly shows a velocity spike extending over 250 km s-1, which is typically seen in unresolved extragalactic SNRs (e.g., Dunne et al., 2000). The E-W slit shows bright emission at the west end, and diffuse emission fanning out with high velocity at the east end. Reconstruction of the exact slit positions reveals that the spike corresponds to MF 22, confirming its SNR nature.
If the nebulae surrounding the two objects were physically related as one supershell, we would expect to see a symmetric expansion structure throughout the length of the N-S slit with two distinct velocity components, red- and blue-shifted. We did not, however, observe a split-line structure even at the center of the “supershell” that would indicate an expansion. The apparent shell morphology results from foreground extinction. We cannot draw any conclusions about the role of the ULX in the ionization or energetics of the surrounding ISM.
3.5 NGC 1313 X-2
NGC 1313 X-2, located south of the nucleus of NGC 1313, was among the first ULXs discovered (Fabbiano & Trinchieri, 1987). The position of this ULX was accurately determined by Chandra observations to be 3h18m2218, 66∘36′033 (J2000.0), which aided in the identification of an pointlike object as the optical counterpart of the ULX. Based on this optical identification and X-ray spectral properties, Zampieri et al. (2004) suggest that NGC 1313 X-2 is a black hole X-ray binary with a 15–20 companion. The black hole mass has been estimated to be 800 based on the spectral analysis of XMM-Newton observations of NGC 1313 X-2 (Miller et al., 2003; Wang et al., 2004).
NGC 1313 X-2 does not reside in a region of active star formation. A deep H image reveals an elongated supershell around the ULX, and spectroscopic observations show strong [S II] and [O I] lines with a FWHM of 80 km s-1 centered near the systemic velocity of NGC 1313 (Pakull & Mirioni, 2003). The nebular spectra change abruptly across the supershell, with the west side brighter in H emission and the east side higher in [O III]/H ratio (Zampieri et al., 2004).
3.5.1 Optical Counterpart and Stellar Environment
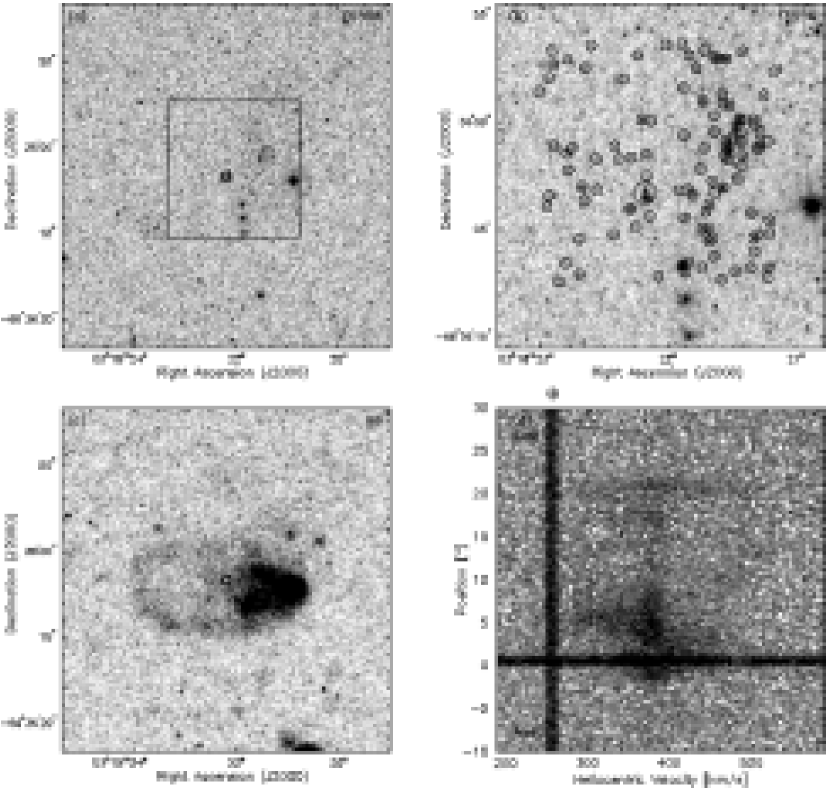
To examine the optical counterpart and stellar environment of NGC 1313 X-2, we have used archival HST ACS images in the F435W, F555W, and F814W bands. The exposure times and observation dates of these ACS images are given in Table 2. Figure 8 shows the F435W and F814W images along with the H image from Pakull & Mirioni (2002). We have used stars in the USNO B1.0 catalog to determine astrometric solutions for these ACS images, resulting in an rms accuracy of 05. With our refined ACS coordinates, it is easy to identify the optical counterpart of the ULX, as marked on the ACS images in Figure 8. It is also evident that within the H shell, a higher concentration of bright stars exists to the west of the ULX. This optical identification is consistent with the identification of Pakull, Grise, & Motch (2005) based on He II emission (Mucciaelli et al., 2005).
We have carried out photometric measurements for the optical counterpart of the ULX and the bright stars to its west. The results are transformed to magnitudes and used to construct CMDs in versus and in versus . We have adopted a distance of 4.1 Mpc (Méndez et al., 2002), but did not make any extinction correction. Figure 9 shows the vs (B-V) CMD plotted with evolutionary tracks of stars of various masses (from Lejeune & Schaerer, 2001). The stars are marked in the F555W image in Figure 8b.
The optical counterpart of NGC 1313 X-2 has , , and , equivalent to a B1–B2 giant reddened by . The mass of the star would be . The second set of F555W images taken three months after the first show a mag variation in . This variation is small but real. It is interesting to note that the optical counterparts of M101 ULX-1 and the ULX NGC 5204 are B supergiants, and in the case of M101 ULX-1 the B supergiant shows no detectable photometric variation over a timespan of 13 months (Liu et al., 2004; Kuntz et al., 2005).
The optical counterpart of NGC 1313 X-2 is one of the three brightest blue stars in this region; these three blue stars are all 7–9 early B giants. The fainter blue stars are most likely main sequence stars with masses . The brightest red star has colors and magnitudes consistent with either a 20 red supergiant in NGC 1313 or a Galactic M8 dwarf at a distance of 160 pc. As there are no blue main sequence stars above 10 in this region of NGC 1313, we consider the Galactic M dwarf a more likely interpretation for this red star. The stellar population within the supershell is thus at least 107 yr old and consequently no longer contains O stars.
3.5.2 Ionization and Energetics of the Supershell surrounding NGC1313 X-2
The 500 340 pc H shell surrounding NGC 1313 X-2, if photoionized and optically thick, requires an ionizing flux of photons s-1, assuming a prolate ellipsoidal shell with a fractional shell thickness of = 0.1 and a density of 1 H-atom cm-3. This ionizing flux exceeds that produced by the observed blue stars, mostly B stars, by two orders of magnitude. Pakull & Mirioni (2002) suggested that the shell is ionized by shocks.
To study the energetics of the supershell around NGC 1313 X-2, we obtained echelle observations for two slit positions (Figure 8). The N-S slit position was observed in the multi-order mode; broad nebular emission is detected in H, but the S/N ratio is too low for accurate velocity measurements. The He II line was not detected. The E-W slit position was observed in the single-order, long-slit mode, and this observation has provided the most useful kinematic information. The H line shows a narrow component at a nearly constant heliocentric velocity of km s-1 within the shell boundary and at 30′′ west of the shell. This component represents the local interstellar medium, and its velocity will be adopted as the systemic velocity of the shell around NGC 1313 X-2. The H line also shows curved blue-shifted and red-shifted components indicating an expanding shell. The red-shifted component shows an extreme velocity offset of +110 km s-1 from the systemic velocity. The blue-shifted component is blended with the bright telluric OH lines at 6571.383 and 6571.386 Å, so it is difficult to determine its extreme velocity offset, but it is at least km s-1 from the systemic velocity. We thus conservatively assign an expansion velocity of 100 km s-1 to the large shell around NGC 1313 X-2. This expansion velocity is higher than the 80 km s-1 determined by Pakull & Mirioni (2002) using a lower-resolution spectrum. For a shell pc in size, this 100 km s-1 expansion velocity is unusually high, and supports the shock ionization of the nebula, as suggested by Pakull & Mirioni (2003).
The kinetic energy of this shell, assuming the aforementioned shell density and geometry, is ergs. This energy is much higher than the canonical supernova explosion energy of 1051 ergs and the shell size is much larger than those of known SNRs. There could be a large number of normal supernova explosions that power the expansion of this large supershell, but this is not supported by the small number of main sequence B stars. It is most likely that the energetic process producing the ULX NGC 1313 X-2 is also responsible for powering this large expanding shell.
4 Conclusions
The luminous X-ray sources for which we obtained echelle observations were selected because they were surrounded by gaseous nebulae. It is thus not surprising that all seven of our program X-ray sources are in young stellar environments. For example, the CMDs of stellar populations near Ho IX X-1, IC 10 X-1, and NGC 1313 X-2 all show main sequence stars typically in the mass range 10–25 . The young stellar environment suggests that these X-ray sources are likely HMXBs. The most direct way to assess the nature of a luminous X-ray source is to identify an optical counterpart. Optical counterparts have been identified for six of our program X-ray sources, and in all cases the counterparts are massive stars ranging from to several tens of . These results further support the suggestion that these luminous or ultraluminous X-ray sources are HMXBs. (See Table 3 for a summary of the stellar and interstellar environments of the luminous X-ray sources we studied.) To confirm the association between these stars and the X-ray sources, spectroscopic observations of the optical counterparts are needed to search for irradiated stellar He II 4686 emission (e.g., Kuntz et al., 2005). Once confirmed, spectroscopic monitoring observations can be used to measure the orbital parameters of these systems in order to determine conclusively whether the ULXs are associated with IMBHs.
The detection of a spatially resolved He II 4686 emitting nebula around a luminous X-ray source can be used to determine whether the X-ray emission is beamed or isotropic. However, besides LMC X-1, none of the nebulae around luminous X-ray sources for which we obtained clear, accurately positioned echelle spectra emitted the He II 4686 line. To assess our negative results, we compare the nebulae for which we did not detect the He II line to the He II-emitting nebulae associated with LMC X-1 and Ho II X-1. LMC X-1 is surrounded by a dense H II region with a diameter of 6 pc, while Ho II X-1 is in an H II region 3045 pc in size. This size difference reflects the two orders of magnitude difference in X-ray luminosity between these two objects. The four nebulae for which we do not detect the He II line are large supershells or diffuse H II regions with low concentrations of gas in the vicinity of the X-ray source. For such distributions of interstellar gas, X-ray emission from the source would be dispersed into a large volume of low-density gas, resulting in an extremely low surface brightness of He II recombination emission. Thus the He II 4686 line would be difficult, if not impossible, to detect for these regions.
By comparing the total ionization energy requirements and expansion velocity of a shell nebula with contributions from the local stellar population, we make estimates of energy contributions from Ho IX X-1 and NGC 1313 X-2. In both cases, the stellar populations were insufficient in producing the energy required for the observed ionization and kinematics of the nebulae, and thus we concluded that these ULXs played a significant role in the energetics of their respective supershells.
Appendix A Ho II X-1
This ULX was first detected by ROSAT observations (Zezas et al. 1999). Recent observations by Pakull & Mirioni (2002) detected a “foot-shaped” nebula with He II emission concentrated in the “heel” of the Foot nebula. Further Chandra observations by Kaaret et al. (2004) pinpointed the ULX at 08h19m2898, 70∘42′193 (J2000.0), indeed within the “heel.” The He III nebula, ionized by the erg s-1 X-ray source, has an intrinsic FWHM of 22, corresponding to 34 pc at a distance 3.39 Mpc (Pakull & Mirioni, 2002).
Our slit positions unfortunately missed the He III nebula. However, the echelle spectra centered at 08h19m60, 70∘42′510 (J2000.0), corresponding to the middle of the “Foot,” reveal an expanding shell structure, and show 65–75 km s-1. The velocity was found to be +145 km s-1, corresponding well to the km s-1 of Ho II. An HST H image of the whole foot region shows both nebulosity and a high concentration of bright stars. The detection of a blue star at the position of the ULX by Kaaret et al. (2004) suggests a possible optical counterpart with to , and , consistent with a range of spectral types from O4V to B3 Ib.
Appendix B IC 342 X-1
IC 342 X-1 is associated with a “tooth-shaped” nebula 6′′ in diameter, corresponding to 110 pc at a distance 3.9 Mpc (Roberts et al., 2003). This nebula has a high [S II]/H ratio of 1.2 and a high [O I]/H ratio of 0.4 which is characteristic of SNRs (Pakull & Mirioni, 2002). Spectroscopy by Roberts et al. (2003) confirms the high [S II]/H and [O I]/H ratios, and finds a high electron temperature ( K) from the [N II] lines and a low density ( cm-3) from the [S II] doublet. The presence of [O III] in two regions within the nebula further suggests the possibility of X-ray photoionization.
Only one set of echelle observations, obtained with a N-S oriented slit, revealed narrow and [N II] lines with a sufficient S/N ratio. However, reconstruction of our slit position revealed that it was centered on a bright nebular object to the east of the target. The line shows that the nebula has a = km s-1.
References
- Adler & Westpfahl (1996) Adler D. S., Westpfahl D. J. 1996, AJ, 111, 735
- Bauer & Brandt (2004) Bauer, F. E., & Brandt, W. N. 2004, ApJ, 601, L67
- Begelman (2002) Begelman, M. C. 2002, ApJ, 568, L97
- Brandt et al. (1997) Brandt, W. N., Ward, M. J., Fabian, A. C., & Hodge, P. W. 1997, MNRAS, 291, 709
- Bullejos & Rosado (2002) Bullejos, A., & Rosado, M. 2002, Revista Mexicana de Astronomia y Astrofisica Conference Series, 12, 254
- Chen et al. (2002) Chen, C.-H. R., Chu, Y.-H., Gruendl, R., Lai, S.-P., & Wang, Q. D. 2002, AJ, 123, 2462
- Chu & Mac Low (1990) Chu, Y.-H., & Mac Low, M.-M. 1990, ApJ, 365, 510
- Colbert & Mushotzky (1999) Colbert, E. J. M., & Mushotzky, R. F. 1999, ApJ, 519, 89
- Crowther et al. (2003) Crowther, P. A. et al. 2003, A&A, 404, 483
- de Vaucouleurs et al. (1991) de Vaucouleurs G., de Vaucouleurs A., Corwin J. R., Buta R. J., Paturel G., & Fouque P. 1991, Third reference catalogue of bright galaxies. Springer-Verlag, New York
- Dunne et al. (2000) Dunne, B. C., Gruendl, R. A., & Chu, Y.-H. 2000, AJ, 119, 1172
- Fabbiano (1989) Fabbiano, G. 1989, ARA&A, 27, 87
- Fabbiano & Trinchieri (1987) Fabbiano, G., & Trinchieri, G. 1987, ApJ, 315, 46
- Feast (1999) Feast, M. 1999, IAU Symp. 190: New Views of the Magellanic Clouds, 190, 542
- Freedman et al. (1994) Freedman W. L., et al. 1994, ApJ, 427, 628
- Georgiev et al. (1991) Georgiev, Ts. B., Bikina B. L., Tikhonov N. A., & Karachentsev I. 1991, A&AS, 89, 529
- Henkel et al. (1993) Henkel, C., Stickel M., Salzer J. J., Hopp U., Brouillet N., & Baudry A. 1993, A&A, 273, L15
- Humphrey et al. (2003) Humphrey, P. J., Fabbiano, G., Elvis, M., Church, M. J., & Bałucińska-Church, M. 2003, MNRAS, 344, 134
- Kaaret et al. (2004) Kaaret, P., Ward, M. J., & Zezas, A. 2004, MNRAS, 351, L83
- King et al. (2001) King, A. R., Davies, M. B., Ward, M. J., Fabbiano, G., & Elvis, M. 2001, ApJ, 552, L109
- Kuntz et al. (2005) Kuntz, K. D., Gruendl, R. A., Chu, Y.-H., Chen, C.-H. R., Still, M., Mukai, K., & Mushotzky, R. F. 2005, ApJ, 620, L31
- La Parola et al. (2001) La Parola, V., Peres, G., Fabbiano, G., Kim, D. W., & Bocchino, F. 2001, ApJ, 556, 47
- Lai et al. (2001) Lai, S.-P., Chu, Y.-H., Chen, C.-H. R., Ciardullo, R., & Grebel, E. K. 2001, ApJ, 547, 754
- Leitherer et al. (1999) Leitherer, C., et al. 1999, ApJS, 123, 3
- Lejeune & Schaerer (2001) Lejeune, T., & Schaerer, D. 2001, A&A, 366, 538
- Liu, Bregman, & Seitzer (2002) Liu, J.-F. , Bregman, J. N., & Seitzer, P. 2002, ApJ, 580, L31
- Liu et al. (2004) Liu, J.-F., Bregman, J. N., & Seitzer, P. 2004, ApJ, 602, 249
- Makishima et al. (2000) Makishima, K. et al. 2000, ApJ, 535, 632
- Massey et al. (1992) Massey, P., Armandroff, T. E., & Conti, P. S. 1992, AJ, 103, 1159
- Matonick & Fesen (1997) Matonick, D. M., & Fesen, R. A. 1997, ApJS, 112, 49
- Méndez et al. (2002) Méndez, B., Davis, M., Moustakas, J., Newman, J., Madore, B. F., & Freedman, W. L. 2002, AJ, 124, 213
- Miller (1995) Miller, B. W. 1995, ApJ, 446, L75
- Miller & Hodge (1994) Miller, B. W., & Hodge, P. 1994, ApJ, 427, 656
- Miller et al. (2005) Miller, N. A., Mushotzky, R. F., & Neff, S. G. 2005, ApJ, 623, L109
- Miller et al. (2003) Miller, J. M., Fabbiano, G., Miller, M. C., & Fabian, A. C. 2003, ApJ, 585, L37
- Mizuno, Kubota & Makishima (2001) Mizuno, T., Kubota, A. & Makishima, K. 2001, ApJ, 554, 1282
- Mucciaelli et al. (2005) Mucciaelli, P., Zampieri, L., Falomo, R., Turolla, R., & Treves, A. 2005, astro-ph/0510085
- Pakull & Angebault (1986) Pakull, M. W., & Angebault, L. P. 1986, Nature, 322, 511
- Pakull & Mirioni (2002) Pakull, M. W., & Mirioni, L. 2002, in proceedings “New Visions of the X-ray Universe in the XMM-Newton and Chandra Era”, held 26-30 November 2001 in The Netherlands (astro-ph/0202488)
- Pakull & Mirioni (2003) Pakull, M. W., & Mirioni, L. 2003, RevMexAA (Serie de Conferencias) 15, 197
- Pakull, Grise, & Motch (2005) Pakull, M. W., Grise, F. & Motch, C. 2005, IAU Symp. No. 230, “Populations of High-Energy Sources in Galaxies”, held on 2005 August 15-19 in Dublin, Ireland
- Roberts et al. (2003) Roberts, T. P., Goad, M. R., Ward, M. J., & Warwick, R. S. 2003, MNRAS, 342, 709
- Roberts et al. (2001) Roberts, T. P., Goad, M. R., Ward, M. J., Warwick, R. S., O’Brien, P. T., Lira, P., & Hands, A. D. P. 2001, MNRAS, 325, L7
- Schlegel et al. (1994) Schlegel, E. M., Marshall, F. E., Mushotzky, R. F., Smale, A. P., Weaver, K. A., Serlemitsos, P. J., Petre, R., & Jahoda, K. M. 1994, ApJ, 422, 243S
- Soria et al. (2005) Soria, R., Cropper, M., Pakull, M., Mushotzky, R., & Wu, K. 2005, MNRAS, 356, 12
- Strohmayer & Mushotzky (2003) Strohmayer, T. E., & Mushotzky, R. F. 2003, ApJ, 586, L61
- Swartz et al. (2004) Swartz, D. A., Ghosh, K. K., Tennant, A. F., & Wu, K. 2004, ApJS, 154, 519
- Wang (2002) Wang, Q. D. 2002, MNRAS, 332, 764
- Wang et al. (2004) Wang, Q. D., Yao, Y., Fukui, W., Zhang, S. N., & Williams, R. 2004, ApJ, 609, 113
- Wang et al. (2005) Wang, Q. D., Whitaker, K. E., & Williams, R. 2005, MNRAS, 698
- Yang & Skillman (1993) Yang, H., & Skillman, E. D. 1993, AJ, 106, 1448
- Zampieri et al. (2004) Zampieri, L., Mucciarelli, P., Falomo, R., Kaaret, P., di Stefano, R., Turolla, R., Chieregato, M., & Treves, A. 2004, Nuclear Physics B Proceedings Supplements, 132, 387
- Zezas et al. (1999) Zezas, A. L., Georgantopoulos, I., & Ward, M. J. 1999, MNRAS, 308, 302


| Object | Slit | Exposure | Date of | |||
|---|---|---|---|---|---|---|
| No. | Name | Orient. | (s) | Observation | Observatory | Remarks |
| 1 | Ho II X-1 | NS | 31800 | 2003 Nov 5 | KPNO | |
| 2 | Ho II X-1 | EW | 31800 | 2003 Nov 8 | KPNO | |
| 3 | Ho IX X-1 | NS | 41800 | 2003 Nov 5 | KPNO | |
| 4 | Ho IX X-1 | EW | 41800 | 2003 Nov 7 | KPNO | |
| 5 | IC 10 X-1 | NS | 11800 | 2003 Nov 5 | KPNO | Cloudy. |
| 6 | IC 10 X-1 | NS | 31800 | 2003 Nov 5 | KPNO | |
| 7 | IC 10 X-1 | EW | 41800 | 2003 Nov 7 | KPNO | |
| 8 | IC 342 X-1 | NS | 31800 | 2003 Nov 6 | KPNO | |
| 9 | IC 342 X-1 | NS | 41800 | 2003 Nov 6 | KPNO | Bright sky. |
| 10 | IC 342 X-1 | EW | 31800 | 2003 Nov 8 | KPNO | |
| 11 | M 81 X-6 | NS | 41800 | 2003 Nov 6 | KPNO | |
| 12 | M 81 X-6 | EW | 41800 | 2003 Nov 8 | KPNO | |
| 13 | NGC 1313 X-2 | EW | 31800 | 2004 Jan 8 | CTIO | Low S/N. |
| 14 | NGC 1313 X-2 | NS | 31800 | 2004 Jan 9 | CTIO | |
| 15 | NGC 1313 X-2 | EW | 31800 | 2004 Jan 12 | CTIO | Single order. |
| 16 | LMC X-1 | EW | 31200 | 2004 Jan 8 | CTIO | |
| 17 | LMC X-1 | NS | 11200 | 2004 Jan 9 | CTIO |
| Date of | Exp. Time | ||||
|---|---|---|---|---|---|
| Object | PI/PID | Observation | Filter | Camera | (s) |
| Ho IX X-1 | Miller/9796 | 2004 Feb 7 | F435W | ACS WFC | |
| F555W | ACS WFC | ||||
| F814W | ACS WFC | ||||
| IC 10 X-1 | Bauer/9683 | 2002 Oct 12 | F435W | ACS WFC | |
| 2002 Oct 13 | F606W | ACS WFC | |||
| F814W | ACS WFC | ||||
| Hunter/6406 | 1999 Jun 9 | F656N | WFPC2 | ||
| BM81 X-6 | Bregman/9073 | 2001 Jun 4 | F555W | WFPC2 | |
| NGC 1313 X-2 | Miller/9796 | 2003 Nov 22 | F435W | ACS WFC | |
| F555W | ACS WFC | ||||
| F814W | ACS WFC | ||||
| 2004 Nov 22 | F555W | ACS WFC |
| Object | Stellar | Optical | Interstellar |
|---|---|---|---|
| Name | Environment | Counterpart | Environment |
| Ho II X-1 | … | BSG | H II region |
| Ho IX X-1 | blue stars | … | Supershell, 290440 pc |
| 4-6 Myr old | = 80–100 km s-1 | ||
| ergs | |||
| IC 10 X-1 | reddened blue stars | WR star | Interstellar froth |
| 80 km s-1 | |||
| IC 342 X-1 | blue stars | … | H II region |
| LMC X-1 | blue stars | 08 III | H II region |
| M81 X-6 | blue stars | O8 V | diffuse H II |
| nearby SNR | |||
| NGC 1313 X-2 | blue stars | B | Supershell, 496340 pc |
| = 100 km s-1 | |||
| ergs |