Discovery of a Very Young Field L Dwarf, 2MASS J014158234633574111Some of the data presented herein were obtained at the W. M. Keck Observatory, which is operated as a scientific partnership among the California Institute of Technology, the University of California, and the National Aeronautics and Space Administration. The Observatory was made possible by the generous financial support of the W. M. Keck Foundation.
Abstract
While following up L dwarf candidates selected photometrically from the Two Micron All Sky Survey, we uncovered an unusual object designated 2MASS J014158234633574. Its optical spectrum exhibits very strong bands of vanadium oxide but abnormally weak absorptions by titanium oxide, potassium, and sodium. Morphologically such spectroscopic characteristics fall intermediate between old, field early-L dwarfs () and very late M giants (), leading us to favor low gravity as the explanation for the unique spectral signatures of this L dwarf. Such a low gravity can be explained only if this L dwarf is much lower in mass than a typical old field L dwarf of similar temperature and is still contracting to its final radius. These conditions imply a very young age. Further evidence of youth is found in the near-infrared spectrum, including a triangular-shaped H-band continuum reminiscent of young brown dwarf candidates discovered in the Orion Nebula Cluster. Using the above information along with comparisons to brown dwarf atmospheric and interior models, our current best estimate is that this L dwarf has an age of 1-50 Myr and a mass of 6-25 . Although the lack of a lithium detection (pseudo equivalent width 1 Å) might appear to contradict other evidence of youth, we suggest that lithium becomes weaker at lower gravity like all other alkali lines and thus needs to be carefully considered before being used as a diagnostic of age or mass for objects in this regime. The location of 2MASS 01414633 on the sky coupled with a distance estimate of 35 pc and the above age estimate suggests that this object may be a brown dwarf member of either the 30-Myr-old Tucana/Horologium Association or the 12-Myr-old Pic Moving Group. Distance as determined through trigonometric parallax (underway) and a measure of the total space motion are needed to test this hypothesis.
1 Introduction
The search for dwarfs later than late-M has had a brief, but surprisingly productive, history. The first L dwarf was discovered during a search for brown dwarf companions to nearby (white dwarf) stars by Becklin & Zuckerman (1988). Now the total number of L dwarfs recognized in the Solar Neighborhood exceeds 400 and the number of their cooler brethren, the T dwarfs, exceeds sixty333See the compilation at http://www.DwarfArchives.org.. Research on L and T dwarfs is a rapidly maturing field, and having such a large number of cool objects enables studies that might not otherwise be possible (Kirkpatrick, 2005).
One such study is the identification of L and T dwarfs that show rare spectroscopic traits. A few notable L and T dwarfs with unusual or unique spectroscopic features have been identified. Explanations for the unusual features vary – 2MASS J051859952828372 is believed to be a close binary composed of a late-L and mid-T dwarf (Cruz et al., 2004) whereas 2MASS J05325346+8246465 is probably a low metallicity L dwarf member of the halo (Burgasser et al., 2003). In this paper we present the discovery of a field L dwarf whose unique spectroscopic signatures are likely caused by low gravity, which implies that it is a very young, low-mass brown dwarf.
2 Discovery and Data Acquisition
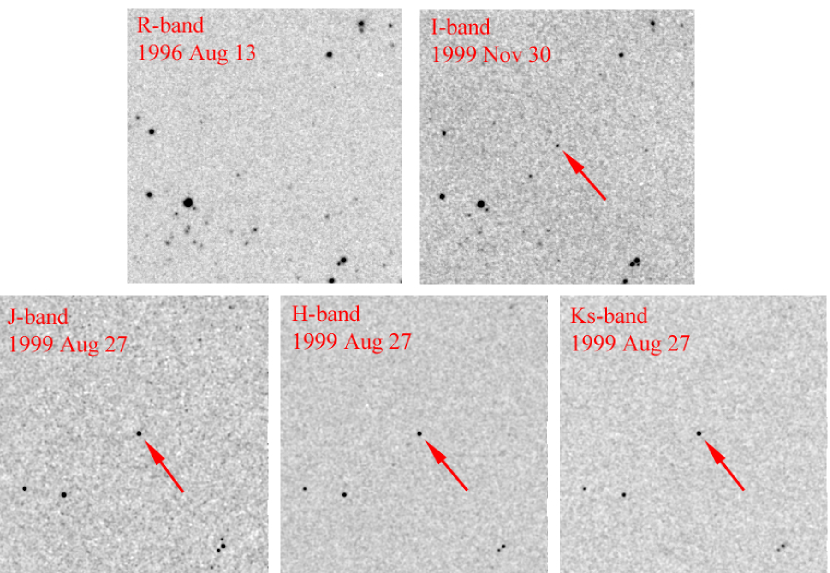
2MASS J014158234633574 (hereafter abbreviated as 2MASS 01414633) was discovered during a photometric search for L dwarfs using data from the Two Micron All Sky Survey (2MASS, Skrutskie et al. 2005). The goal of this search was to produce a sizable list of southern hemisphere targets whose trigonometric parallaxes could be obtained from the Anglo Australian Observatory. 2MASS 01414633 was selected because of its red color () and relatively bright magnitudes of , , and as measured by the 2MASS All Sky Point Source Catalog (Cutri et al., 2003). Figure 1 shows optical and near-infrared finder charts of the region. Additional information on other objects discovered during this L dwarf search can be found in Kirkpatrick et al. (2005).
2.1 Keck LRIS Data
2MASS 01414633 was followed up spectroscopically using the Low Resolution Imaging Spectrograph (Oke et al., 1995) at the 10-m W. M. Keck Observatory on the clear night of 2003 Dec 24 UT. A 400 lines/mm grating blazed at 8500 Å was used with a 1 slit and a 20482048 CCD to produce spectra covering the range 6300 – 10100 Å and having a resolution of 9 Å. The OG570 order-blocking filter was used to eliminate second-order light. Flat-field exposures of the interior of the telescope dome were used to normalize the response of the detector. 2MASS 01414633 was observed in two 1200-second exposures. Between these two exposures, a 20-second spectrum of the G0 dwarf HD 11342 – 1.5 degrees away on the sky – was observed to provide a template for telluric correction. The data, all taken at the parallactic angle to mitigate differential color refraction, were reduced and calibrated using standard IRAF routines as detailed in Kirkpatrick et al. (1999). We interpolated the continuum across the O2 bands at 6867-7000 and 7594-7685 Å and the H2O bands at 7186-7273, 8161-8282, 8950-9300, and 9300-9650 Å in the resulting spectrum of HD 11342 to produce a “telluric free” version. This cleaned spectrum of the G dwarf was then divided into the pre-cleaned spectrum of itself to produce a telluric correction factor as a function of wavelength. The reduced spectrum of 2MASS 01414633 was then multiplied by this correction factor to produce a telluric-corrected version of the target.
2.2 IRTF SpeX Data
Near-infrared spectra of 2MASS 01414633 were obtained with SpeX (Rayner et al., 2003) on the 3-m NASA Infrared Telescope Facility. The target was first observed on 2004 Sep 05 UT in prism mode to provide continuous coverage from 0.7-2.5 m in a single order on a 10241024 InSb array. Use of the slit resulted in a resolving power of . For accurate sky subtraction, the target was observed in three sets of dithered pairs having 180-second integrations per position. On the following night, the target was observed in cross-dispersed mode to provide higher-resolution spectra over 0.9-2.4 m in four orders. Use of the slit resulted in a resolving power of . In this mode the target was observed in four dithered pairs having 300-second intergrations per position. Observations of the A0 dwarf HD 8977 were taken on both nights near a similar airmass and time as the target to provide both telluric correction and flux calibration. For all observations the instrument rotator was positioned at the parallactic angle. For instrumental calibration internal flat-field and argon lamps were observed immediately after the observation of the A0 star. Standard reductions were employed using the Spextool package version 3.2 (Cushing et al., 2004; Vacca et al., 2003) as described in Burgasser et al. (2004).
2.3 Keck NIRSPEC Data
2MASS 01414633 was also observed on 2004 Nov 06 UT with the Near-Infrared Spectrometer (NIRSPEC, McLean et al. 1998, 2000) on the 10-m W. M. Keck Observatory. Large fluctuations in relative humidity were noted during the observations, but sky transparency was otherwise fine. Using a 10241024 InSb array and the spectrograph in low-resolution mode, we selected the grating angle to cover the part of the J-band window from 1.14 to 1.36 m where the most diagnostic near-infrared features lie. Use of the slit results in a resolving power of . The data were obtained in two sets of dithered pairs, with a 300-second exposure obtained at each position. To measure telluric absorption, the A0 dwarf HD 8977 was observed in a couple of 60-second nodded pairs shortly after the target and close to the same airmass; such early-A stars are essentially featureless in this region, only the star’s hydrogen Paschen line at 1.282 m needing to be interpolated over during the telluric correction step. Calibrations consisted of neon and argon arc lamp spectra, a dark frame, and a spectrum of a flat-field lamp. Standard reductions using the REDSPEC package were employed, as described in detail in McLean et al. (2003).
3 Analysis
3.1 Optical Spectral Features
3.1.1 Empirical Comparisons
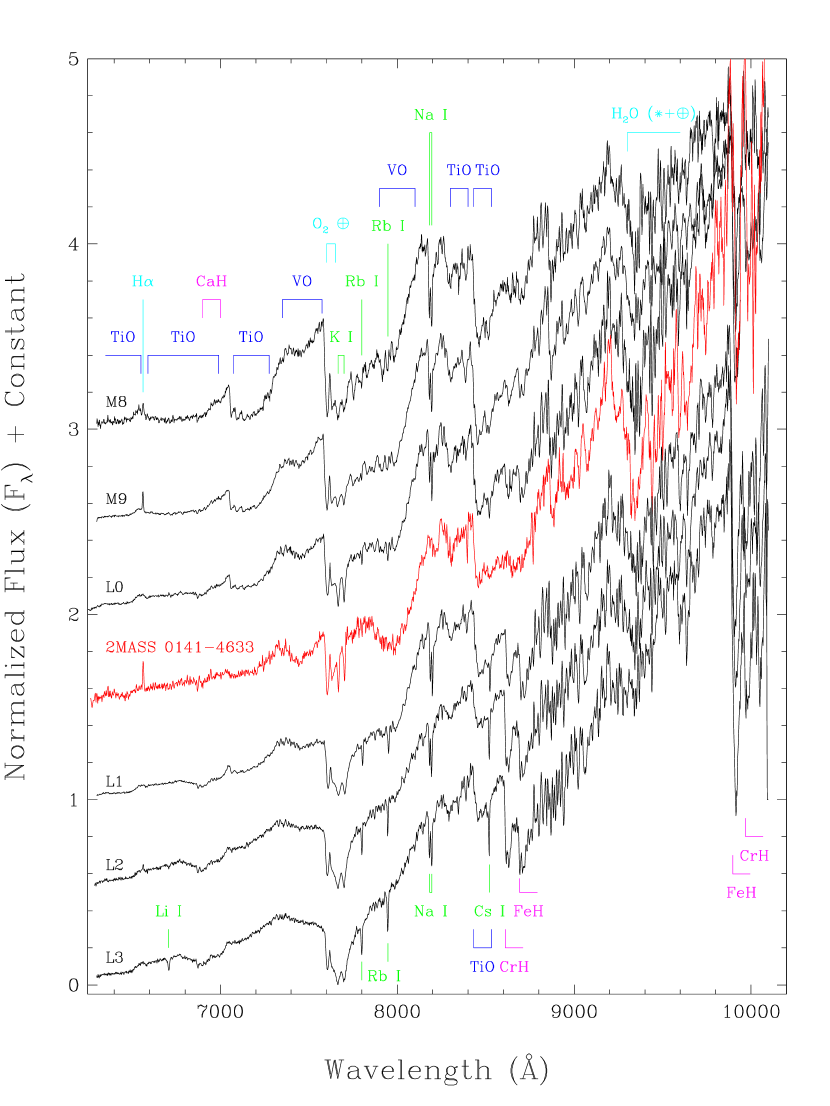
The LRIS optical spectrum of 2MASS 01414633 is displayed in Figure 2 along with a comparison sequence of late-M and early-L dwarf standards from Kirkpatrick et al. (1999). Although the gross appearance of the spectrum is clearly that of a late-M or early-L dwarf, details of the optical spectral morphology of 2MASS 01414633 are unlike that of standard M and L dwarfs and in fact look unlike any dwarf seen previously. Specifically, the VO bands from 7334 to 7534 Å and from 7851 to 7973 Å look most like those seen in an L0 dwarf but are considerably stronger than any of the spectra in the standard sequence. Furthermore, the TiO bands at 7053 Å and shortward are very weak or absent, and those at 8206 and 8432 Å have strengths similar to those same bands in an L1 dwarf.
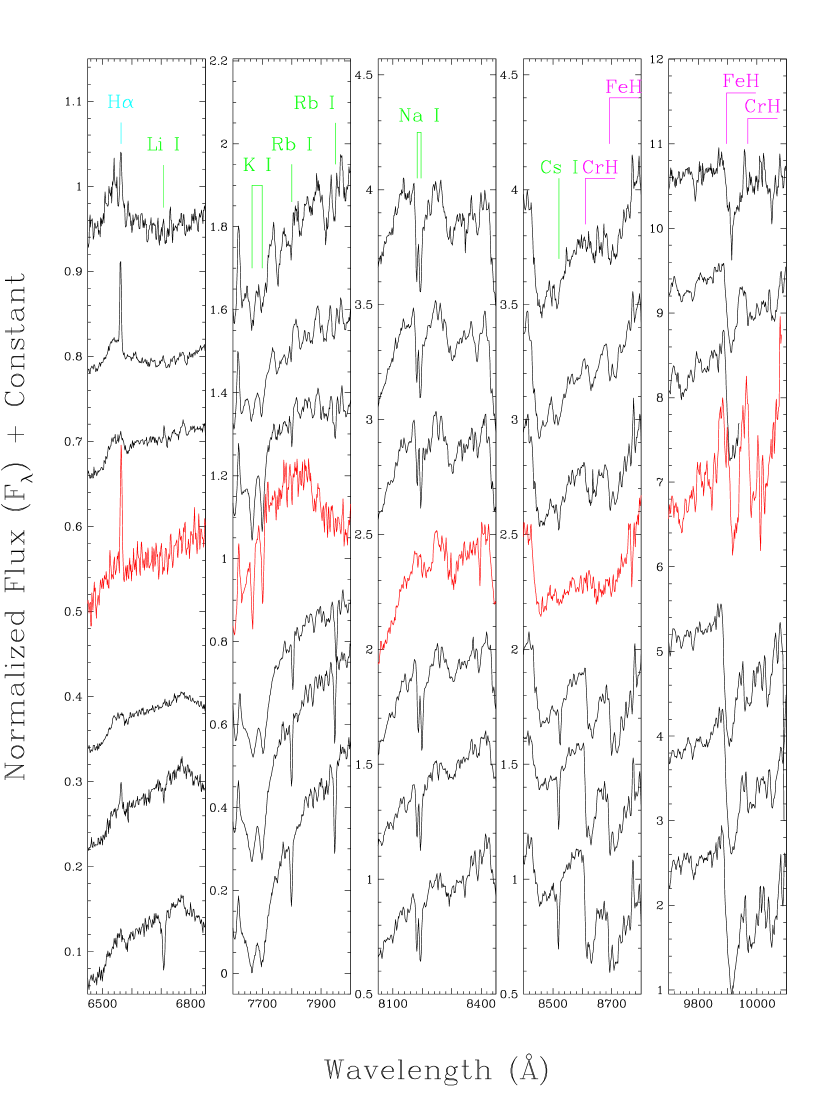
Figure 3 shows details of the same spectra to emphasize how the spectrum of 2MASS 01414633 departs from the norm. The alkali lines – K I, Na I, Rb I, and Cs I – are noticeably weak compared to the same lines in standard late-M/early-L spectra. Moreover, in addition to being weaker the K I lines are distinctly narrower; the cores of these lines have full widths at half minima (relative to the local pseudo-continuum) that are 1.2 to 1.7 times smaller than those of the other late-M and early-L dwarfs show in Figure 3. The Li I doublet is not present either, although this is not unusual at this resolution and spectral type in the standard spectral sequence. Hydride bands of FeH and CrH are also weaker than normal.
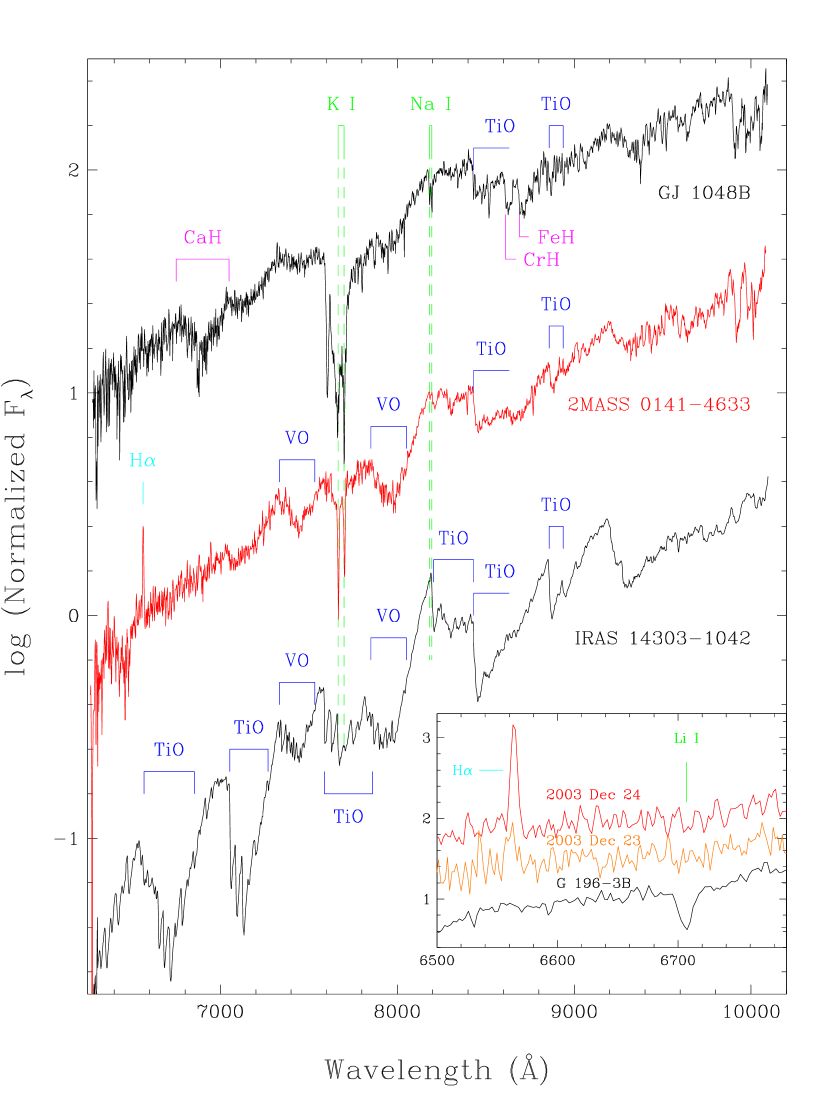
Figure 4 places these anomalies in a different context. Shown for comparison here are the LRIS spectrum of 2MASS 01414633 compared to LRIS spectra of the old, L1 dwarf companion GJ 1048B and the late-M giant IRAS 143031042 (aka BR 14301042). In the spectrum of 2MASS 01414633, the strength of the sodium and potassium lines falls intermediate between the strengths seen in the dwarf and the giant. Likewise, the vanadium oxide strengths fall intermediate between the high- and low-gravity objects. The titanium oxide strengths, on the other hand, are very similar to those of the dwarf and quite unlike those of the giant.
The inset in Figure 4 shows one final optical spectral comparison. The uppermost spectrum in the inset is the 2MASS 01414633 spectrum from 2003 Dec 24 (UT). Just below that is a poorer signal-to-noise spectrum of the same object from a night earlier. (Due to poor sky subtraction at longer wavelengths, this earlier spectrum has not been considered further in this paper.) The later spectrum exhibits an H emission line with a pseudo-equivalent width of 10.51.5 Å. The earlier spectrum shows that the emission was persistent, the measure in this case being 5.02.5 Å. Although these two measurements are only 2 discrepant, it appears that the pseudo-equivalent width measure in the earlier spectrum is contaminated by a noise spike at shorter wavelengths, as the width of the line is broader than in the later spectrum and offset to shorter wavelengths. Hence we believe that these spectra provide strong evidence for variability in the H line itself.
Also shown in this inset is the spectrum (at bottom) of the low-gravity L2 dwarf G 196-3B, which has a measured Li I pseudo-equivalent width of 6 Å (Kirkpatrick et al., 2001). However, no discernable Li I line is seen in either spectrum of 2MASS 01414633 to a level of 1 Å.
3.1.2 Physical Interpretation
We interpret the spectral features in the optical as follows. Alkali lines have long been known to be gravity sensitive, in which case the weakness of these lines in 2MASS 01414633 can be explained if this object has a much lower gravity than a typical field L dwarf. The narrower appearance of the K I doublet also points to lower gravity because these lines lack the familiar pressure broadened wings seen in normal early-L dwarfs.
At face value the strengths of the oxide bands are harder to interpret, but nonetheless point to low gravity as well. Both TiO and VO disappear along the standard late-M/early-L dwarf sequence due to condensation, TiO disappearing first and VO at somewhat colder values of Teff (Kirkpatrick et al., 1999). Lower gravity leads to low atmospheric pressure which tends to inhibit condensation, in the sense that condensation does not occur until even colder temperatures are reached444At their very low gravities, log(g)0, late-M giants never reach temperatures low enough to trigger the formation of TiO- and VO-bearing condensates. Because the weakening and disappearance of these two molecules is the hallmark of the M/L transition, this explains why there is no such thing as an “L giant”.. (See, for example, Table 2 and Figure 2 of Lodders (2002).) In the case of 2MASS 01414633 the Teff is low enough that the formation of TiO-bearing condensates has begun but not low enough to trigger VO-bearing condensation.
As lower gravity can successfully explain all of the spectral peculiarities of 2MASS 01414633, we propose that this is the physical reason underlying its unique spectral signature. Lower gravity means that this object is lower in mass or larger in radius than a typical field dwarf of the same temperature. Both conditions would be present in a very young brown dwarf because it would still be contracting to its final radius and it would not yet have had the time to cool to the temperatures typical of old field objects of the same mass.
The lack of lithium in 2MASS 01414633 may at first consideration seem to contradict our hypothesis of a young age and lower gravity. Many previous studies have used the presence of lithium absorption as an indicator of low mass, as solar metallicity brown dwarfs below a mass of 60 MJupiter never burn their initial lithium content. Young brown dwarfs are expected to exhibit lithium absorption whereas older, higher mass objects at the same temperature (spectral type) are not. The L2 dwarf G 196-3B, shown in the inset of Figure 4, is an example of such a young brown dwarf. In 2MASS 01414633 alkali lines of Na I, K I, Rb I, and Cs I (Figure 3) are noticeably weaker than those of normal field late-M and early-L dwarfs. The low gravity hypothesis for our object implies a low mass (see §4), so it will have retained its nacient lithium content too; however, low gravity also will serve to diminish the Li I line strength just as it does for the other alkali lines. We propose that the lithium line is not detected at our signal-to-noise and resolution simply because the gravity of 2MASS 01414633 is uncommonly low. This should serve as a cautionary tale: at very low gravities the strength of the lithium line will decrease markedly, greatly decreasing its usefulness as a test of substellarity.
3.2 Near-infrared Spectral Features
3.2.1 Empirical Comparisons
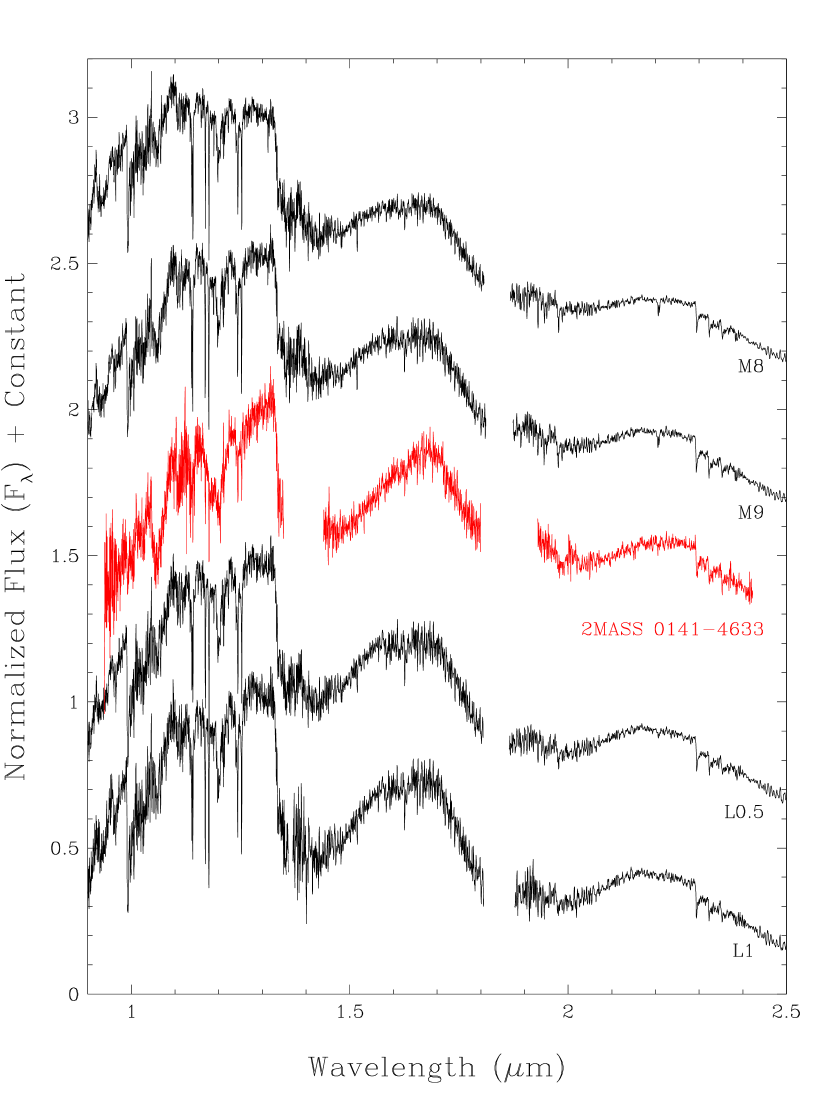
The SpeX near-infrared spectrum of 2MASS 01414633 is shown in Figure 5 along with SpeX spectra of normal field late-M and early-L dwarfs from Cushing et al. (2005). Most notable in the spectrum of 2MASS 01414633 is the triangular-shaped appearance of the H-band spectrum, which stands in stark contrast to the more rounded H-band peaks seen in the comparison objects. Furthermore, the near-infrared spectrum of 2MASS 01414633 is much redder than spectra of normal late-M/early-L dwarfs. Its color of from the 2MASS All Sky Point Source Catalog is significantly redder than the average color of found for normal, field L0 dwarfs (Kirkpatrick et al., 2000).
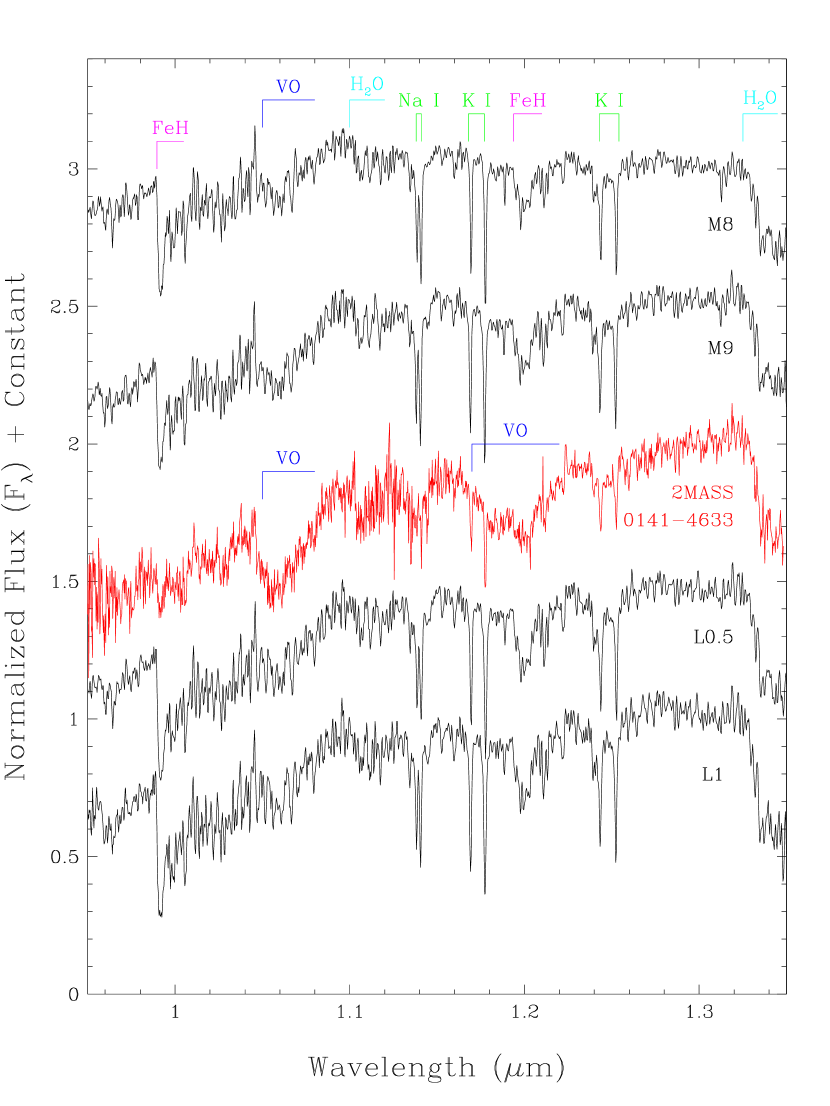
Also notable are two deep molecular bands centered near 1.06 and 1.18 m that are not present in spectra of the normal late-M/early-L dwarfs. Figure 6 shows this region in more detail, revealing that both bands are caused primarily by VO. Note also that lines of Na I and K I along with bands of FeH are weaker in 2MASS 01414633 than in the comparison spectra. In this figure the nature of the peculiarities in the 2MASS 01414633 spectrum mirrors that seen in its optical spectrum.
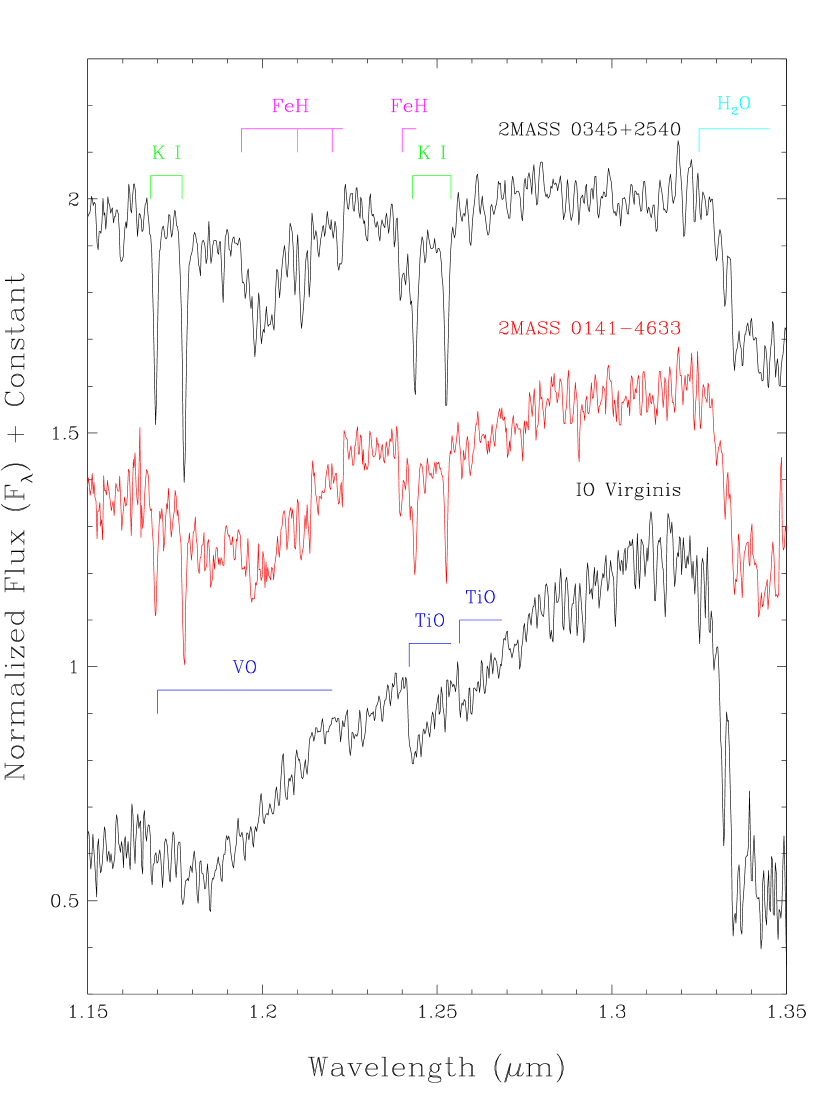
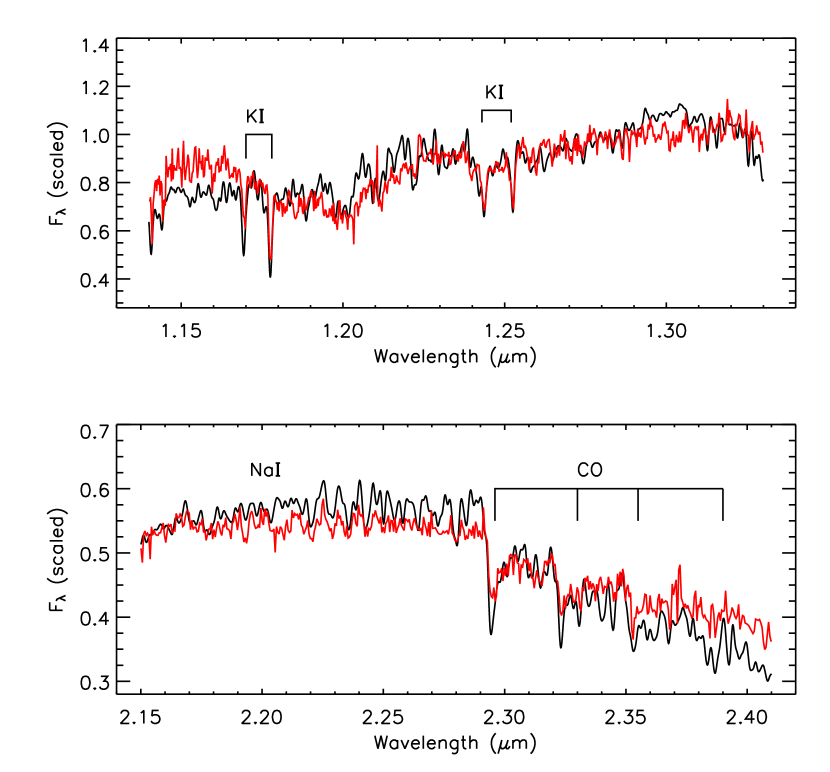
A further comparison is shown in Figure 7, which presents the NIRSPEC J-band spectrum of 2MASS 01414633 along with NIRSPEC spectra of a normal early-L dwarf and a late-M giant. As is seen in the optical spectra of Figure 4, the spectrum of 2MASS 01414633 looks like a hybrid of a dwarf and a giant. Lines of K I are clearly weaker than those in the dwarf, but not nearly as weak as those in the giant. The broad depression between 1.17 and 1.22 m appears to be caused by two major absorptions: VO, which is strong in the giant and very weak or absent in the dwarf, and FeH, which is strong in the dwarf and much weaker or absent in the giant. These two features, VO at shorter wavelengths and FeH at longer ones, conspire to make a broad V-shaped depression centered near 1.20 m in 2MASS 01414633. Lastly, the strong absorption bands of TiO starting near 1.24 m in the giant appear to have no analog in either the normal dwarf or 2MASS 01414633.
3.2.2 Physical Interpretation
As discussed for the optical spectrum, the weakness of the alkali lines and the strength of VO bands in the near-infrared can also be attributed to low gravity. Can a lower gravity also be the cause of the oddly shaped H-band peak and the red J-Ks color? It should be noted that triangular-shaped H-band peaks have been reported previously in the spectra of low-mass brown dwarf candidates in the Orion Nebula Cluster (Lucas et al., 2001). In fact the strangeness of the H-band spectra was used by those authors as proof that their candidates were neither normal foreground nor background stars. Because low-gravity model atmospheres by Allard et al. (2000) reproduce the spirit of this feature, this was taken as further evidence of youth.
Those authors did not attempt to explain the physical reason for the change in the H-band pseudo-continuum, but we note that this is probably due to a reduction in H2 collision induced absorption (CIA). This feature is created by the collective induced quadrupolar moments on symmetric hydrogen molecules by van der Waals forces in a dense gas. Such perturbations are enhanced in atmospheres of higher pressures and densities. From the equation of hydrostatic equilibrium in stellar atmopsheres, we know that atmospheric pressure scales as , where is pressure, is the optical depth, is gravity, and is the Rosseland mean opacity. Photospheres of lower pressure can be produced either through lowering the gravity or increasing the metal content (increasing ). As it is unlikely that 2MASS 01414633 is a super metal-rich L dwarf – this would explain only the strength of the VO bands but neither the weakness of the TiO bands or the alkali lines – the most likely explanation is that H2 CIA is reduced because of lower gravity.
As Borysow et al. (1997) show, H2 CIA produces a very broad feature in the near-infrared. At the temperatures typical of late-M and early-L dwarfs (2300 - 2500K) the strongest part of the absorption at JHK bands is located near 2.5 m with a gradual weakening toward shorter wavelengths. A diminishing of this absorption would have two main effects: 1) Less absorption at K-band relative to J-band produces a redder J-Ks color, and 2) the H-band peak appears less rounded and more peaky. The latter effect is illustrated – albeit for a slightly hotter, 2800K object – in the lower right panel of Figure 5 in Borysow et al. (1997).
It is noteworthy that another early-L dwarf exhibiting features of low gravity – the L2 dwarf G 196-3B (see Figure 4) – also has an unusually red color. DwarfArchives.org currently lists 37 objects with well measured types of L2, and the average 2MASS color for these is 1.53. Of these thirty-seven, G 196-3B has the reddest color of all, . This object is a companion to a young field M dwarf and has been assigned an age of 100 Myr (Rebolo et al., 1998). We expect the reduced influence of H2 CIA, and consequently an uncommonly red color, to be typical of low-gravity brown dwarfs such as this one.
As was the case for the optical spectral features, lower gravity can successfully explain all of the spectral peculiarities of 2MASS 01414633 in the near-infrared. In the next section we use theoretical spectra to attempt to measure the gravity and temperature of 2MASS 01414633, which will further allow us to estimate its mass and age.
4 Comparison to Model Spectra
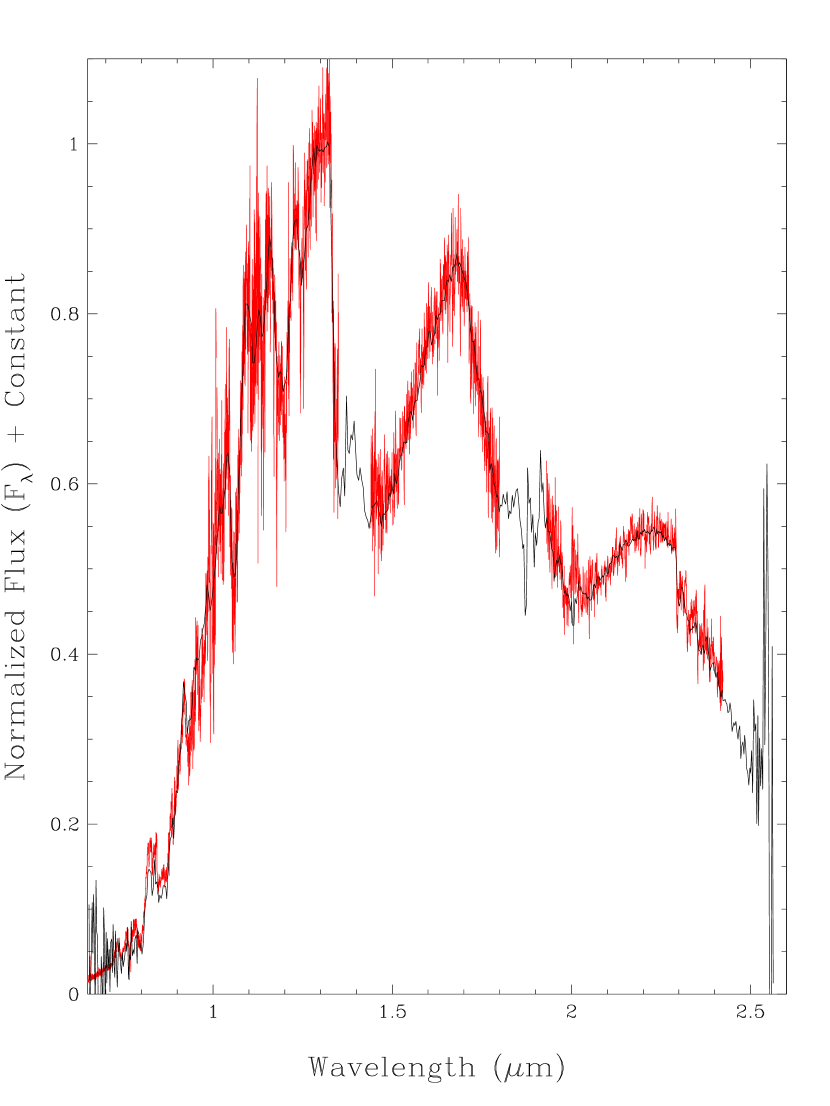
Using data presented in the previous sections, we have pieced together a high-resolution version of the spectrum covering 0.6 to 2.4 m. These pieces have been assembled using the LRIS optical spectrum and the four orders of the SpeX cross-dispersed near-infrared spectrum. The four orders all fall on the same array and have the same relative scaling, so we have merely normalized this set at its peak flux and then normalized the SpeX prism spectrum to one at the same wavelength. We then multiplied the LRIS spectrum by a constant to bring its flux value in agreement with the SpeX prism spectrum at 0.9 m. The scaled LRIS spectrum and SpeX cross-dispersed spectral orders are plotted together in Fig. 8 and overlain on the full SpeX prism data as a comparison. The internal agreement is excellent.
This combined high-resolution spectrum was then compared to a grid of synthetic spectra computed with the PHOENIX model atmosphere code. These models are similar to the “dusty” models described in Allard et al. (2001); however, they include many improvements incorporated in PHOENIX since 2001. Our model grid spanned K to 3000K in 100K increments and to 6.0 (in cgs units) in 0.5 dex increments.
The effective temperature was obtained by fitting the 0.6-2.4 m spectrum while masking the 1.32-1.60 and 1.75-2.20 m regions. These two regions correspond to strong H2O absorption bands known to be poorly represented by current brown dwarf model atmospheres. A best fit of K was determined using a simple least-squares method. With fixed to this value, the gravity was determined by simultaneously fitting the two KI doublets in the -band spectrum, again with a least-squares method. These pairs of KI lines are known to be sensitive gravity indicators (Gorlova et al. 2003, McGovern et al. 2004) and together yield a best fit of . Figure 9 shows these best fits. We note that our 2000K best fit to the entire SED could also be used to estimate gravity, as the CIA H2 is a huge contributor to the SED shape at H and K bands. This best fit yields , consistent with the line-fitting method.
Empirically, these derived values roughly agree with expectations. For normal field early-L dwarfs with measured trigonometric parallaxes, we find K (Kirkpatrick, 2005). Very late Mira-type M giants such as our comparison stars IRAS 143031042 (Wils, 2003) and IO Virginis (Kazarovets et al., 1993) have types between M8 and M10+ (Kirkpatrick et al., 1997), and the values of for such stars range from 2000 to 2500K (van Belle et al., 1996). Based on this empirical evidence, we would expect that the effective temperature of 2MASS 01414633 would also fall intermediate between the giant and dwarf temperatures ranges; i.e., 2200K, or somewhat warmer than the model-fit estimate of K. The empirical guess should only be used as a crude guide, but it at least shows that the value from model fits is plausible.
As for the value of , we would expect a value lying intermediate between that of a dwarf () and a giant (), but probably closer to that of a dwarf since overall the spectral features are a better match to the former than the latter. So the model-fit estimate of also agrees with expectations.
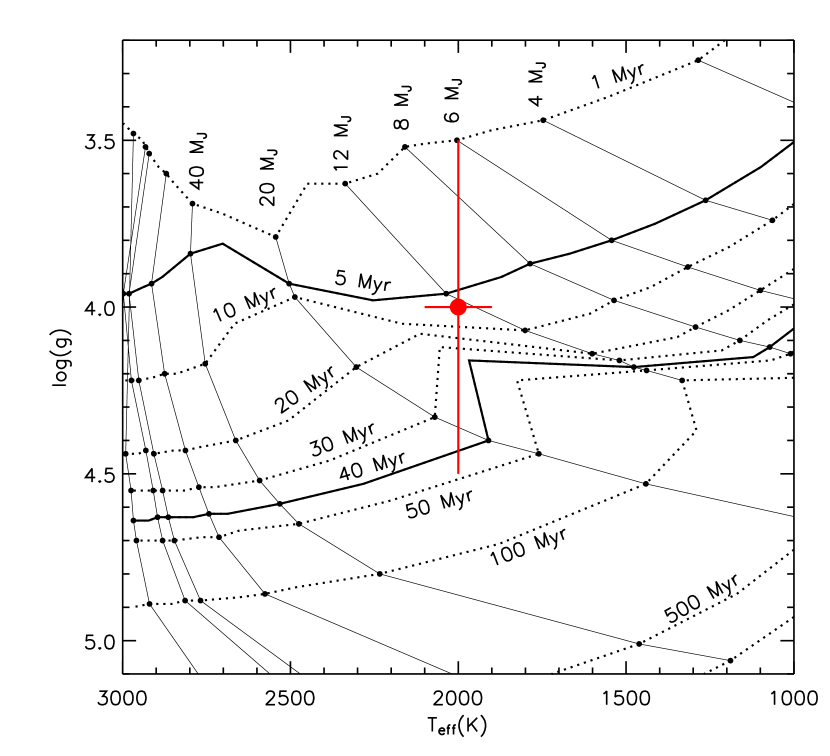
Using these model-fit estimates of and , we can plot 2MASS 01414633 on the theoretical vs. plane to deduce mass and age. Figure 10 shows this plane overplotted with the Dusty evolutionary tracks from Baraffe et al. (2002) and the 1 error box for 2MASS 01414633. This suggests that 2MASS 01414633 has an age between 1 and 50 Myr and a mass between 6 and 25 MJup. The most likely values give an age between 5 and 10 Myr and a mass of 12 MJup. Plotting the values of and on an alternative set of evolutionary isochrones such as those given by Burrows et al. (1997) result in identical estimates of 50 Myr for the age and 25 MJup for the mass, with best guesses of 5 Myr and 11 MJup.
It should be noted, however, that the theoretical models are completely untested in this regime of mass and age. Any derived values for these quantities should be treated with utmost caution. At the moment they are useful only in comparing these derived values (in a relative sense) to derivations for young, low-mass brown dwarfs detected elsewhere. The absolute values of these quantities are largely untestable at present, but we can nonetheless compare the age estimate to other empirical data. Based on a grid of late-M and early-L dwarfs that we are developing for a larger project (Kirkpatrick et al. in prep.), we can already argue that the age of 2MASS 01414633 must be substantially younger than Pleiades members of similar type because its spectral features belie an even lower gravity. As the Pleiades are believed on other grounds to be of age 125 Myr (Stauffer et al., 1998), this means that 2MASS 01414633 is substantially younger than that value. The fact that the triangular peak in the H-band spectrum is so similar to that of brown dwarf candidates in the Orion Nebula Cluster (age fewMyr) is a further clue that the age is substantially younger than the Pleiades. Hence, the theoretically derived best-guess age of 5-10 Myr for 2MASS 01414633 is realistic.
5 The Nature of 2MASS 01414633
5.1 Is It a Member of a Young Association?
Up till now we have considered 2MASS 01414633 to be a field object, but is this seemingly solivagant L dwarf actually part of one of the recently recognized young, nearby, southern associations? (See review by Zuckerman & Song 2004.) An upper age estimate of 50 Myr opens up the possibility that this object is a member of either the AB Doradus Moving Group (age 50 Myr555Luhman et al. (2005) argue that the age of AB Dor is closer to that of the Pleiades, 125 Myr.), the Tucana-Horologium Association (age 30 Myr), the Pictoris Moving Group (age 12 Myr), or the TW Hydrae Association (age 8 Myr). The best-guess age estimate of 5-10 Myr gives a best match to either the Pic group or the TW Hya Association. The location of 2MASS 01414633 on the sky most closely matches the core of the Tucana/Horologium group or the Pic group, but this is not a very strong constraint because these associations are relatively nearby and hence spread over a large angular extent of sky.
Distance can potentially be used as another crude criterion. Using the best-guess estimate of 5-10 Myr for the age and a best guess mass of 12 MJup, we find a luminosity for 2MASS 01414633 (Burrows et al., 1997). Assuming that the K-band bolometric correction for early-L dwarfs of 3.2 (Golimowski et al., 2004) holds for this object, we find that the most likely distance, if 2MASS 01414633 is single, is 35 pc. Unfortunately, this also fails to provide much of a constraint. The median distances of proposed members is found to be 29 pc for the AB Dor Group, 47 pc for the Tucana/Horologium Association, 39 pc for the Pic group, and 54 pc for the TW Hya Association (Zuckerman & Song, 2004). The proposed members tend to scatter over distances of at least 20 pc either side of these medians, meaning that the 35-pc distance estimate to 2MASS 01414633 sheds very little light on possible membership.
Another valuable piece of evidence is the true space velocity. Astrometric measurements are currently underway by one of us (CGT), and these will provide a trigonometric parallax and a tangential velocity. An accurate radial velocity will be required to determine the true space velocity and to compare the space motions to those of the aforementioned associations. The mean motions of these groups are, not surprisingly, very similar (see Table 7 of Zuckerman & Song 2004), but a measurement for 2MASS 01414633 will at least test the hypothesis of youth in general and the possibility that it is a member of any of these. Using our highest resolution spectrum (the NIRSPEC J-band spectrum) we derive a crude radial velocity of 1215 km/s for 2MASS 01414633. This value is smaller than the total space velocity ( km/s) for the four young associations mentioned above, so there is no evidence yet to rule out membership.
Given the scant information currently available, the most likely match to the age, distance, and sky location of 2MASS 01414633 is either the Tucana/Horologium Association or the Pic Moving Group. Additional observations are clearly warranted.
5.2 What is its Spectral Type?
Given that 2MASS 01414633 is so different from the standard spectral sequence, its classification should include the fact that it is spectroscopically peculiar. Given that it best matches the spectral features of an early-L dwarf, we will tentatively assign it a spectral type of L0 pec. We predict that 2MASS 01414633 will begin to look less peculiar as other low-temperature, low-gravity objects are found. Therefore, an augmentation of the L and T spectral classification system will soon be warranted.
As pointed out in Kirkpatrick (2005), we are quickly heading toward a need for other dimensions in our classification of L and T dwarfs to capture information about metallicity and gravity, the two other main parameters besides temperature and clouds that modulate the appearance of the emergent spectrum. We suggest a nomenclature in which the prefix (, , ) indicates the metallicity type, the core indicates the temperature/cloud type (L0, L1, L2… T0, T1, etc.), and the suffix (perhaps , , , etc.) indicates the gravity type. As usual we intend to follow the precepts on the MK Process (Garrison, 1984) and base our system on only empirical constraints. Normal field objects of solar metallicity would earn a prefix of . Mildly metal deficient L and T dwarfs would earn the prefix and extremely metal poor dwarfs would earn the prefix , following the nomenclature of Gizis (1997). The gravity index is actually a measure of the change in line/feature strength at various ages. Old L or T dwarfs in the field would have a suffix of , those L (and T) dwarfs of Pleiades age would earn a suffix of , objects roughly of TW Hya age would get a designation of , and the even younger objects, say of the age of the Orion Nebula Cluster, would get a . Following this reasoning, 2MASS 01414633 might eventually be tagged with a type such as dL0 or dL0 to more fully incorporate its spectral appearance into the spectral classification itself.
Establishing this spectral nomenclature scheme is the subject of an on-going program. Building an empirical spectroscopic grid in metallicity (Burgasser et al. in prep.) and gravity (Kirkpatrick et al. in prep.) phase space is the topic of future papers.
6 Conclusions
We have presented the discovery of 2MASS J014158234633574, an odd early-L dwarf whose peculiarities we prescribe to unusually low gravity. Both empirical and theoretical considerations point to a very young age, likely in the 5-10 Myr range. Fits to model atmospheres suggest an effective temperature of 2000100 K, and placement on theoretical evolutionary tracks indicate a mass of roughly 12 MJup. Its southerly declination, young age, and implied mass suggest that this may be a very low-mass brown dwarf member of a young association such as the Tucana/Horologium Association or the Pic Moving Group. Other detailed observations of this object – including spectroscopic acquisition at higher resolution or at longer wavelengths, astrometric and radial velocity measurements, and imaging searches for even fainter companions – are all important follow-up studies needed to understand better the nature of this rare L dwarf.
7 Acknowledgments
We would like to thank our Keck observing assistants Steven Magee, Terry Stickel, and Cynthia Wilburn and our IRTF observing assistant Paul Sears for providing expert operation of the telescopes during our runs. We are also indebted to our instrument scientists, Paola Amico, Grant Hill, and Marc Kassis at Keck and John Rayner at IRTF for their expertise in running the spectrographs, and to Barbara Schaefer and Popoki for making our Christmas runs at Keck always so pleasant. JDK would like additionally to thank the Watkins Foundation at Wichita State Univesity for awarding him a Watkins Visiting Professorship in 2003 during which both the groundwork of this paper was laid and the collaboration with TSB was begun. He also acknowledges very fruitful discussions with Dave Alexander and Jason Ferguson during this trip. We thank Ben Zuckerman, Adam Burrows, and Michael Cushing (the referee) for other suggestions and advice. This paper uses data from the Brown Dwarf Spectroscopic Survey Archive (http://www.astro.ucla.edu/~mclean/BDSSarchive), the IRTF Spectral Library (http://irtfweb.ifa.hawaii.edu/~spex/spexlibrary/IRTFlibrary.html), and http://DwarfArchives.org. This publication also makes use of data products from the Two Micron All Sky Survey, which is a joint project of the University of Massachusetts and the Infrared Processing and Analysis Center/California Institute of Technology, funded by the National Aeronautics and Space Administration and the National Science Foundation. This research has also made use of the NASA/IPAC Infrared Science Archive, which is operated by the Jet Propulsion Laboratory, California Institute of Technology, under contract with the National Aeronautics and Space Administration. As all three flavors of spectra were obtained from the summit of Mauna Kea, the authors wish to recognize and acknowledge the very significant cultural role and reverence that this mountaintop has always had within the indigenous Hawaiian community. We are most fortunate to have the opportunity to conduct observations there.
References
- Allard et al. (2000) Allard, F., Hauschildt, P. H., & Schwenke, D. 2000, ApJ, 540, 1005.
- Allard et al. (2001) Allard, F., Hauschildt, P. H., Alexander, D. R., Tamanai, A., & Schweitzer, A. 2001, ApJ, 556, 357.
- Baraffe et al. (2002) Baraffe, I., Chabrier, G., All ard, F., & Hauschildt, P. H. 2002, A&A, 382, 563.
- Baraffe et al. (2001) Baraffe, I., Chabrier, G., Allard, F., & Hauschildt, P. 2001, ASP Conf. Ser. 243: From Darkness to Light: Origin and Evolution of Young Stellar Clusters, 243, 571.
- Becklin & Zuckerman (1988) Becklin, E. E., & Zuckerman, B. 1988, Nature, 336, 656.
- Borysow et al. (1997) Borysow, A., Jorgensen, U. G., & Zheng, C. 1997, A&A, 324, 185.
- Burgasser et al. (2003) Burgasser, A. J., et al. 2003, ApJ, 592, 1186.
- Burgasser et al. (2004) Burgasser, A. J., McElwain, M. W., Kirkpatrick, J. D., Cruz, K. L., Tinney, C. G., & Reid, I. N. 2004, AJ, 127, 2856.
- Burrows et al. (1997) Burrows, A., et al. 1997, ApJ, 491, 856 .
- Chabrier et al. (2000) Chabrier, G., Baraffe, I., Allard, F., & Hauschildt, P. 2000, ApJ, 542, 464.
- Cruz et al. (2004) Cruz, K. L., Burgasser, A. J., Reid, I. N., & Liebert, J. 2004, ApJ, 604, L61.
- Cushing et al. (2004) Cushing, M. C., Vacca, W. D., & Rayner, J. T. 2004, PASP, 116, 362
- Cushing et al. (2005) Cushing, M. C., Rayner, J. T., & Vacca, W. D. 2005, ApJ, 623, 1115.
- Cutri et al. (2003) Cutri, R. M., et al. 2003, VizieR Online Data Catalog, 2246, 0.
- Garrison (1984) Garrison, R. F. 1984, The MK Process and Stellar Classification, Toronto: Univ. of Toronto.
- Gizis (1997) Gizis, J. E. 1997, AJ, 113, 806.
- Golimowski et al. (2004) Golimowski, D. A., et al. 2004, AJ, 127, 3516.
- Gorlova et al. (2003) Gorlova, N. I., Meyer, M. R., Rieke, G. H., & Liebert, J. 2003, ApJ, 593, 1074.
- Hamuy et al. (1994) Hamuy, M., Suntzeff, N. B., Heathcote, S. R., Walker, A. R., Gigoux, P., & Phillips, M. M. 1994, PASP, 106, 566.
- Kazarovets et al. (1993) Kazarovets, E. V., Samus, N. N., & Goranskij, V. P. 1993, Informational Bulletin on VariableStars, 3840, 1.
- Kirkpatrick et al. (1997) Kirkpatrick, J. D., Henry, T. J., & Irwin, M. J. 1997, AJ, 113, 1421.
- Kirkpatrick et al. (1999) Kirkpatrick, J. D., et al. 1999, ApJ, 519, 802.
- Kirkpatrick et al. (2000) Kirkpatrick, J. D., et al. 2000, AJ, 120, 447.
- Kirkpatrick et al. (2001) Kirkpatrick, J. D., Dahn, C. C., Monet, D. G., Reid, I. N., Gizis, J. E., Liebert, J., & Burgasser, A. J. 2001, AJ, 121, 3235.
- Kirkpatrick (2005) Kirkpatrick, J. D. 2005, ARA&A, 43, 195.
- Kirkpatrick et al. (2005) Kirkpatrick, J. D., et al. 2005, in prep.
- Lodders (2002) Lodders, K. 2002, ApJ, 577, 974
- Lucas et al. (2001) Lucas, P. W., Roche, P. F., Allard, F., & Hauschildt, P. H. 2001, MNRAS, 326, 695.
- Luhman et al. (2005) Luhman, K. L., Stauffer, J. R., & Mamajek, E. E. 2005, ApJ, 628, L69.
- McGovern et al. (2004) McGovern, M. R., Kirkpatrick, J. D., McLean, I. S., Burgasser, A. J., Prato, L., & Lowrance, P. J. 2004, ApJ, 600, 1020.
- McLean et al. (1998) McLean, I. S., et al. 1998, Proc. SPIE, 3354, 566.
- McLean et al. (2000) McLean, I. S., Graham, J. R., Becklin, E. E., Figer, D. F., Larkin, J. E., Levenson, N. A., & Teplitz, H. I. 2000, Proc. SPIE, 4008, 1048.
- McLean et al. (2003) McLean, I. S., McGovern, M. R., Burgasser, A. J., Kirkpatrick, J. D., Prato, L., & Kim, S. S. 2003, ApJ, 596, 561.
- Monet et al. (2003) Monet, D. G., et al. 2003, AJ, 125, 984.
- Oke et al. (1995) Oke, J. B., et al. 1995, PASP, 107, 375.
- Rayner et al. (2003) Rayner, J. T., Toomey, D. W., Onaka, P. M., Denault, A. J., Stahlberger, W. E., Vacca, W. D., Cushing, M. C., & Wang, S. 2003, PASP, 115, 362.
- Rebolo et al. (1998) Rebolo, R., Zapatero Osorio, M. R., Madruga, S., Bejar, V. J. S., Arribas, S., & Licandro, J. 1998, Science, 282, 1309.
- Skrutskie et al. (2005) Skrutskie, M. F., et al. 2005, AJ, in press.
- Stauffer et al. (1998) Stauffer, J. R., Schultz, G., & Kirkpatrick, J. D. 1998, ApJ, 499, L199.
- Vacca et al. (2003) Vacca, W. D., Cushing, M. C., & Rayner, J. T. 2003, PASP, 115, 389.
- van Belle et al. (1996) van Belle, G. T., Dyck, H. M., Benson, J. A., & Lacasse, M. G. 1996, AJ, 112, 2147.
- Wils (2003) Wils, P. 2003, Informational Bulletin on Variable Stars, 5457, 1.
- Zuckerman & Song (2004) Zuckerman, B., & Song, I. 2004, ARA&A, 42, 685.