Turbulent Gas Flows in the Rosette and G216-2.5 Molecular Clouds: Assessing Turbulent Fragmentation Descriptions of Star Formation
Abstract
The role of turbulent fragmentation in regulating the efficiency of star formation in interstellar clouds is examined from new wide field imaging of 12CO and 13CO J=1-0 emission from the Rosette and G216-2.5 molecular clouds. The Rosette molecular cloud is a typical star forming giant molecular cloud and G215-2.5 is a massive molecular cloud with no OB stars and very little low mass star formation. The properties of the turbulent gas flow are derived from the set of eigenvectors and eigenimages generated by Principal Component Analysis of the spectroscopic data cubes. While the two clouds represent quite divergent states of star formation activity, the velocity structure functions for both clouds are similar. The sonic scale, , defined as the spatial scale at which turbulent velocity fluctuations are equivalent to the local sound speed, and the turbulent Mach number evaluated at 1 pc, , are derived for an ensemble of clouds including the Rosette and, G216-2.5 regions that span a large range in star formation activity. We find no evidence for the positive correlations between these quantities and the star formation efficiency, that are predicted by turbulent fragmentation models. A correlation does exist between the star formation efficiency and the sonic scale for a subset of clouds with that are generating young stellar clusters. Turbulent fragmentation must play a limited and non-exclusive role in determining the yield of stellar masses within interstellar clouds.
1 Introduction
Newborn stars emerge from the cold, dense, molecular phase of the interstellar medium (ISM). The efficiency through which stars form and the mass distribution of the stellar product have important implications to the galactic environment and evolution. The global star formation efficiency, defined as the ratio of mass of newborn stars and the mass of the parent molecular cloud, is observed to be low (several percent) and provides a fundamental observational constraint to descriptions of star formation and interstellar gas dynamics.
The inefficiency of star formation has been attributed to the quasi-static equilibrium of the molecular gas in which self-gravity is balanced by magnetic tension (Mouschovias 1976; Shu, Li, & Allen 2004; Nakamura & Li 2005). In this state, star formation is limited to those regions within a cloud in which the mass to flux ratio, , exceeds the critical value, (Nakano & Nakamura 1978). Ambipolar diffusion provides a mechanism to increase beyond the critical value within a region enabling the production of stars (Lizano & Shu 1989).
More recent descriptions of star formation have proposed that density enhancements from which new stars condense within molecular clouds are generated by shocks driven by supersonic turbulent flows (Padoan & Nordlund 2002; Mac Low & Klessen 2004). Whether such shock-induced compressions lead to self-gravitating protostellar cores that are dynamically decoupled from the overlying turbulent flow depends on specific properties of the velocity field. Klessen, Heitsch, & Mac Low (2000) demonstrate a relationship between the star formation efficiency and the scale, , at which the turbulent velocity field is driven. The driving scale sets the time interval between successive shocks. If sufficiently long, the initial compression has time to evolve into a higher density, self-gravitating configuration that is stable against a subsequent shock and can more likely develop into a protostellar core. The sonic scale, , is defined as the scale at which the turbulent velocity fluctuations are equal to the sound speed and sets the spatial regime at which shocks can occur (). Vazquez-Semadeni, Ballesteros-Paredes, & Klessen (2003) predict more efficient star formation with increasing sonic scale as there is a larger reservoir of material within a thermal core that is susceptible to local collapse (Padoan 1995). For an isothermal gas, the turbulent Mach number, , sets the amplitude of the shock. Deeper compressions from larger Mach number turbulence can more rapidly evolve into dense, self-gravitating cores that are more likely to form stars. One would expect a positive correlation of star formation efficiency with Mach number (Mac Low & Klessen 2004; Nakamura & Li 2005). For MHD turbulence in which the shocks are softened by the magnetic field, the thermal Mach number should be replaced with the Alfvenic Mach number.
This dynamical view of star formation, labeled as “turbulent fragmentation” by its proponents, offers a compelling description of star formation but one that requires further scrutiny by observations. In this paradigm, the respective velocity fields of two clouds with extremely different star formation efficiencies should exhibit very different properties, excluding the effects of feedback. The Rosette molecular cloud (RMC) and G216-2.5 molecular cloud provide such an extreme pair to evaluate descriptions of star formation. The RMC complex is associated with the OB cluster NGC 2244 whose massive star constituents are responsible for the excitation of the Rosette Nebula (NGC 2237/2246). The Rosette nebula is clearly interacting with the ambient cloud and may be responsible for triggering the formation of some of the active sites of star formation within the cloud (Cox, Deharveng, & Leene 1991; Williams, Blitz, & Stark 1995). A fraction of these IRAS Point Sources are comprised of clusters of newborn stars (Phelps & Lada 1997). The giant molecular cloud G216-2.5 (Maddalena’s Cloud) provides a stunning contrast to the Rosette Molecular Cloud. It is larger in size and more massive than the Rosette cloud yet it is currently devoid of massive star formation activity (Maddalena & Thaddeus 1985; Williams & Maddalena 1996).
The star formation rates and efficiencies of the two clouds are quantitatively distinguished by the respective values of the far infrared (FIR) luminosity to molecular gas mass ratio that is often used as a surrogate measure of star formation efficiency as interstellar dust grains, heated by the UV radiation of nearby OB stars, emit thermal radiation into the FIR bands. For GMCs in the inner Galaxy and Solar neighborhood, (Scoville & Good 1989; Mooney & Solomon 1988). The for the Rosette and G216-2.5 clouds are 10 and 0.07 respectively (Lee, Snell, & Dickman 1996). The lower value is similar to low mass star forming regions in which the emitting dust grains are heated exclusively by the interstellar radiation field rather than newborn stars (Snell, Heyer, & Schloerb 1988). Williams & McKee (1997) demonstrated that the massive star formation rate per unit mass in the RMC is an order of magnitude higher than the Galactic average and that G216-2.5 is quite unusual in that 90% of clouds of comparable mass are expected to contain at least one O star.
In this paper, we present new 12CO and 13CO observations of the Rosette Molecular Cloud and limited imaging of the 12CO and 13CO J=1-0 emission from the G216-2.5 molecular cloud obtained with the Five College Radio Astronomy Observatory 14m telescope and SEQUOIA focal plane array system. These new wide field imaging data provide kinematic information to evaluate the predictions of the turbulent fragmentation and its role in regulating the formation of stars both between and within giant molecular clouds in the Galaxy.
2 Observations
All observations analyzed in this paper were taken with the 14m telescope of the Five College Radio Astronomy Observatory. The FWHM beam size of the antenna at the observed frequencies are 45″ (115 GHz) and 47″ (110 GHz). The main beam efficiencies at these frequencies are 0.45 and 0.48 respectively as gauged from measurements of Jupiter. All intensities reported in this paper are main beam temperatures with these efficiencies included (Gordon, Baars, & Cocke 1992).
The 12CO and 13CO J=1-0 observations were taken with the 32 pixel focal plane array SEQUOIA using On-the-Fly mapping in which the telescope is continuously scanned across the source while rapidly reading the spectrometers. The data were resampled onto a regular 20″ spaced grid. Owing to the broad bandwidth of the HEMT amplifiers, the 12CO and 13CO lines were observed simultaneously enabling excellent positional registration and calibration. The backends were comprised of a system of 64 autocorrelation spectrometers each with 50 MHz bandwidth for the Rosette and 25 MHz for G216-2.5. No smoothing was applied to the autocorrelation function so the spectral resolution was 59 kHz and 29.5 kHz per channel for the Rosette and G216-2.5 cloud respectively. System temperatures ranged from 350-500 K at the line frequency of the 12CO line (115.271202 GHz) and 150-250 K at the 13CO line (110.201353 GHz). The median rms values achieved in the 12CO and 13CO data cubes for both clouds are 1.0 K and 0.35 K respectively.
3 Results
3.1 The Rosette Molecular Cloud
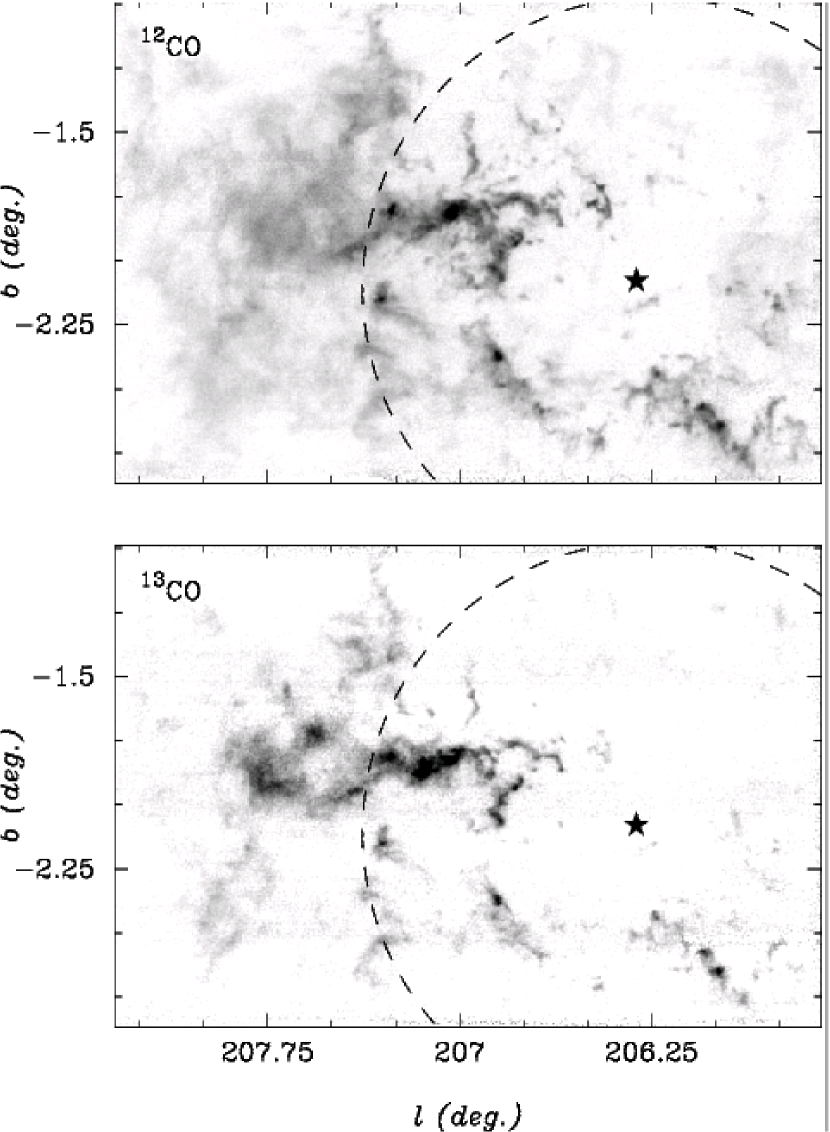
The large scale distribution and kinematics of molecular clouds are best traced by observations of the low rotational transitions of the isotopologues, 12CO and 13CO . While the high opacity of 12CO emission precludes a direct estimate of molecular hydrogen column density, it enables the line to be detected within low column density regimes. 13CO offers a lower opacity tracer of column density but also likely saturates within the high density cores. Images of integrated 12CO and 13CO J=1-0 intensities are displayed in Figure 1. These show the positional relationship between the ionization front of the Rosette nebula (dotted line) and the ambient molecular material. Along the projected boundary of the HII regions, there are both bright, compact features in both 12CO and 13CO images that are embedded within a more diffuse component seen primarily in 12CO. On many lines of sight towards the nebula, there are patches of visual obscuration that are congruent with CO emission features. These spatial coincidences geometrically locate at least part of the cloud along the foreground edge of the HII region. Several of these features are bright rimmed globules that correspond to luminous star forming regions within the cloud (Patel et al. 1993; White et al. 1997).
There are textural variations of the 12CO emission across the observed field and with respect to the projected edge of the ionization front. Within the projected radius of the Rosette nebula, there is bright, high contrast 12CO emission. Exterior to this projected edge, the integrated 12CO emission is smoothly distributed and generally quite weak (=10-30 K km). The line profiles within the diffuse component typically show several velocity components separated up to 6 although the one dimensional velocity dispersion in any one component is 1 . Such composite line shapes are similar to those measured in the translucent cloud population that also exhibit diffuse, low surface brightness distributions of CO emission (Magnani, Blitz, & Mundy 1985).
Such an extended 12CO component can arise from low density, subthermally excited molecular material or small scale, high density, structures with a low beam-filling factor. The 12CO and 13CO J=1-0 data presented here can not distinguish which of these disparate gas configurations applies. This diffuse component is less prominent within the 13CO image owing to lower opacities that reduce the degree of radiative trapping to excite the line. Diffuse emission is also present at the low longitude edge of the surveyed area that is similar to the smooth component external to the nebula. The spectra from these regions exhibit much narrower line widths than the bright, high contrast emission but with velocity centroids consistent with the overall rotation of the complex as described by Williams, Blitz, & Stark (1995). This diffuse component is likely foreground or background material that has not yet been perturbed by the expanding HII region.
The 12CO and 13CO intensities are used to estimate the mass and column densities of the dominant constituent of molecular hydrogen. The 12CO luminosity of the cloud is 3.8104 that corresponds to a molecular mass (including He) of 1.6105 assuming a CO to conversion of 1.91020 molecules cm-2 (K km s-1)-1 (Strong & Mattox 1996). The diffuse component external to the HII region contributes 46% of the CO luminosity. 13CO column densities are derived assuming local thermodynamic equilibrium (LTE) and excitation temperatures derived from optically thick 12CO J=1-0 emission (Dickman 1978). For an to 13CO abundance of 8105, the total mass of the mapped area is 1.16105 . The diffuse component exterior to the HII region has LTE column densities of 0.2-11022 . However, local thermodynamic equilibrium is a poor approximation to the excitation of 13CO line in the diffuse component of the Rosette cloud as the population of the upper rotational energy levels are not properly estimated. This error underestimates the true column densities in this region.
3.2 G216-2.5
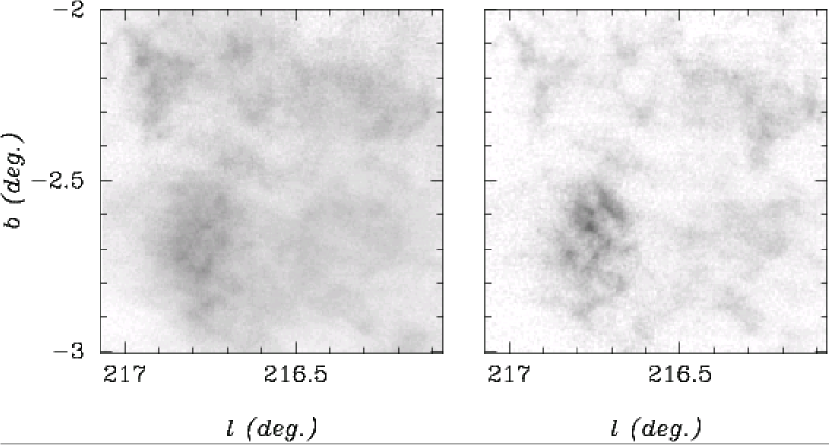
The G216-2.5 cloud subtends 10 deg2 on the sky (Maddalena & Thaddeus 1985; Lee, Snell, & Dickman 1996). Owing to time constraints, our new observations cover 1 deg2 centered on the brightest 12CO emission identified in these previous surveys. Images of velocity integrated emissions are shown in Figure 2. The halftone range spans the same values as Figure 1 to facilitate a direct comparison with the Rosette 12CO and 13CO images. These emphasize the low surface brightness distribution in G216-2.5 that has been noted by earlier studies (Williams & Blitz 1998). The images show flocculent 12CO emission. There are well resolved, coherent clumps that are embedded within a smoothly distributed envelope that extends well beyond the mapped boundary. The 13CO emission identifies localized peaks associated with the aforementioned 12CO clumps. None of these are as bright as the core regions within the Rosette cloud. The molecular line emission from G215-2.5 is similar to the diffuse component in the Rosette cloud that is external to the ionization front. As noted by previous studies, there are several well resolved velocity components that merge to produce broad line widths (FWHM 8.5 km/s). column densities are derived from the 12CO and 13CO data assuming LTE and a to 13CO abundance of 8105. The mass of molecular hydrogen inclusive of He within the mapped area is 7104 .
4 Statistical Measures of Gas Dynamics
The structure function provides a concise, statistical description of velocity fluctuations within a fluid volume. It measures moments of velocity differences, , as a function of spatial displacement , within a volume. The moments of the structure function can be recaste as a linear expression and parameterized by a power law
where is the scaling coefficient and is the scaling exponent. Recovering the structure function parameters, , from spectroscopic imaging data presents a challenging task to evaluate properties of the turbulent gas flow. The observations do not directly measure 3D velocity fields but gather a snapshot-in-time view of intensity at each spectroscopic channel that is integrated along the line of sight and filtered by the opacity and the excitation of the molecular or atomic line transition. This transformation requires statistical analyses that can be related to the structure function of the 3D velocity field. Such analyses have been developed for both 2-dimensional moment representations of the data cube (Scalo 1984; Kleiner & Dickman 1985; Miesch & Bally 1994; Stutzki et al. 1998) and the complete 3-dimensional data cube (Lazarian & Pogasyan 2000; Padoan, Goodman, & Juvela 2003).
Here, we consider Principal Component Analysis to assess the turbulent flows within the Rosette and G216-2.5 molecular clouds. Principal Component Analysis is a powerful method to exploit the informational content within multi-variate data sets such as the wide field, spectroscopic imaging presented in this study (Heyer & Schloerb 1997; Brunt & Heyer 2002). Data are reordered into a set of eigenvectors and eigenimages that describe the degree of spectral and spatial correlation of line profile shapes. Correspondingly, the eigenvectors and eigenimages can be analyzed to recover the statistics of the cloud velocity field as described by the structure function (Brunt & Heyer 2002; Brunt et al. 2003) and place limits on the driving scale of turbulence (Brunt 2003).
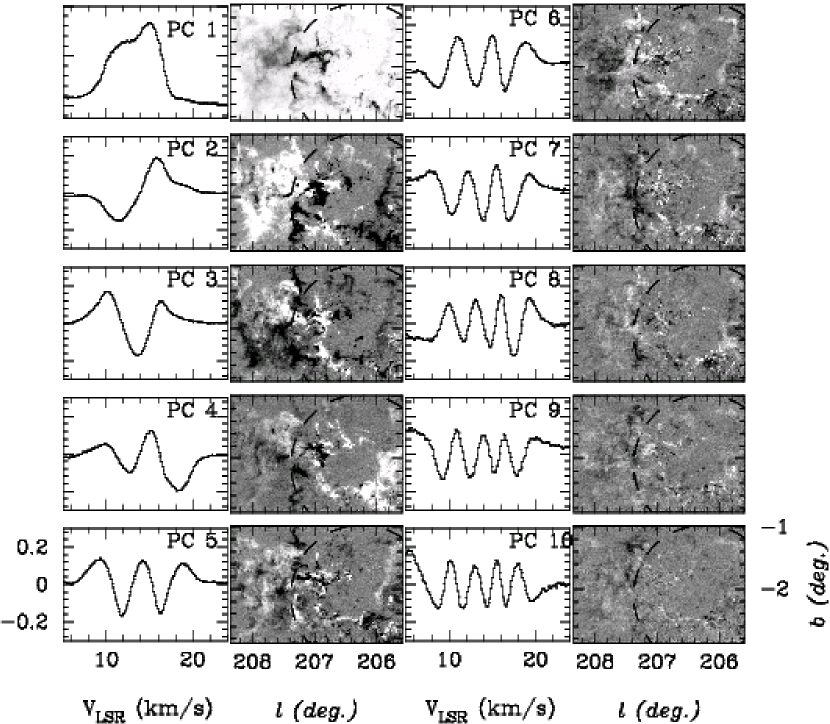
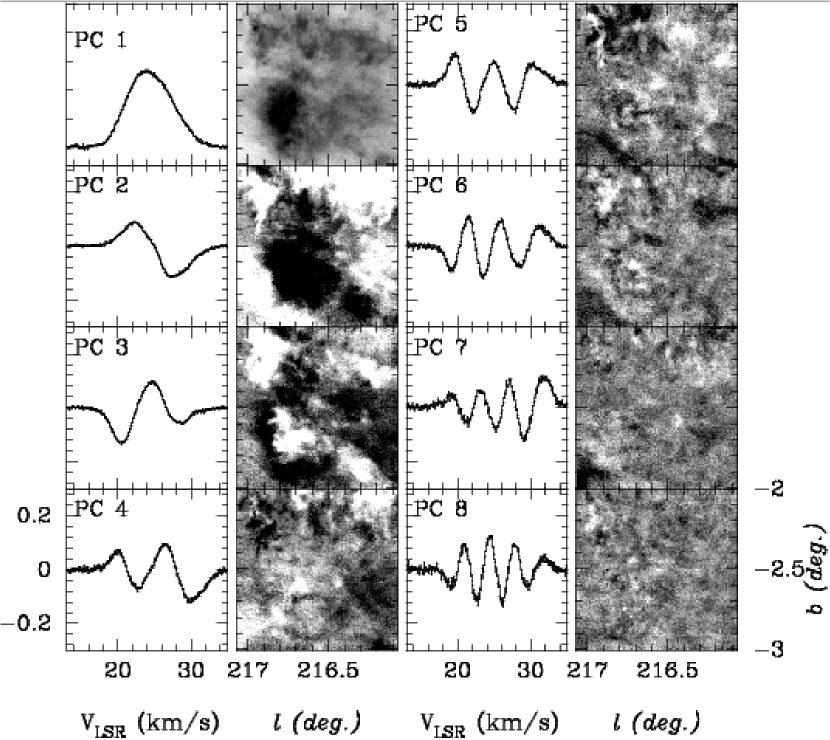
PCA is applied to the 12CO and 13CO data cubes of the Rosette and G216-2.5 molecular clouds. The eigenvectors and eigenimages derived from the 12CO observations of the two clouds are shown in Figure 3 and Figure 4. For each principal component, the characteristic velocity scale, , and spatial scale, , are calculated from the autocorrelation functions of the eigenvector and eigenimage respectively (Brunt & Heyer 2002). This step of the analysis has been modified from previous studies by fitting an ellipse to the 1/e contour of the 2 dimensional ACF to determine the major axis, , minor axis, , and orientation with respect to the cardinal directions. Small corrections are applied to and to account for the finite resolution of the observations (Brunt 1999). The spatial scale, , for a given eigenimage is . This modification provides an improved estimate of the spatial scale when the autocorrelation function is strongly anisotropic. The set of points define a relationship between the magnitude of velocity differences and the spatial scale over which these differences occur that can be related to the velocity structure function (Brunt et al. 2003). This relationship is parameterized by a power law with scaling coefficient, , and scaling exponent, . This PCA-derived exponent, , is related to the scaling coefficient of the structure function, , defined in equation (1), by an empirically defined relationship determined from model velocity fields (Brunt et al. 2003).
and
The results for each cloud and CO isotope are shown in Figure 5 and summarized in Table 1. The power law parameters are derived from a bisector fit to the set of points. The parameters uncertainties are estimated using the bootstrap Monte Carlo method to estimate the underlying probability distribution (Press et al. 1992). For both clouds, there is no significant difference between the fitted parameters derived from 12CO and 13CO data implying that line opacity does not play a significant role in the PCA results. The lower opacity 13CO emission surely probes deeper into higher column density regions than 12CO. However, such regions do not subtend much solid angle and therefore, make a small contribution to the overall molecular line luminosity. Effectively, 12CO and 13CO recover the same velocity field over the projected surface of the cloud (Heyer & Schloerb 1997; Brunt & Heyer 2002).
The power law parameters derived for the Rosette and G216-2.5 clouds are within the range of values found by Heyer & Brunt (2004) for a set of 27 GMCs where =0.900.19 and =0.490.15 that define the universality of velocity structure functions within the molecular ISM. Many of the 27 molecular clouds are massive reservoirs of material (M105 ) and, like the Rosette cloud, are currently producing rich stellar clusters. The near identical form of individual structure functions naturally accounts for the well known but variously interpreted relationship between cloud size and global velocity dispersion identified by Larson (1981). The similarity of the Rosette and G216-2.5 velocity structure functions is remarkable given the respective dynamical and evolutionary states of the two clouds. The Rosette cloud is actively forming massive stars and clusters from which winds and UV radiation have clearly impacted the large scale structure of the cloud. The G216-2.5 cloud is not self-gravitating and not actively forming early type stars, which precludes a source of internal energy input (Lee, Snell, & Dickman 1996). Yet, the derived scaling coefficients, , are comparable that implicates a more significant source of energy present at larger scales that sustains the turbulent flows within these clouds. Energy feedback from protostellar winds and HII regions must play a minimal role in the global dynamics of molecular clouds.
4.1 Variations of turbulent flow properties within the Rosette Cloud
The similarity of velocity structure functions derived over the entire surface of the cloud does not preclude local variations of turbulence within a GMC. The ionization front of the Rosette Nebula has had a significant impact upon one part of the parent molecular cloud as manifest by the gas distribution. In addition, the Rosette 12CO eigenimages in Figure 3 reveal varying gas dynamics within the cloud that are separated by the ionization front. For components 4 through 10, the eigenimages show high frequency power within the ionization front that is distinguished from the diffuse, coherent structure for lines of sight exterior to the front. We have partitioned the Rosette cloud into two zones that are conveniently defined by the projected boundary of the HII region to gauge whether the observed textural differences, identified in Figure 1 and within the eigenimages (Figure 3), are also reflected in the turbulent state of the gas. Zone I corresponds to positions within the projected radius of the Rosette nebula and Zone II covers the area external to the ionization front, exclusive of the small area segment in the upper right corner of the observed field. The relationships derived from the 12CO and 13CO data for both partitions are shown in Figure 6 and the derived scaling law parameters for both 12CO and 13CO are listed in Table 2. While neither set of parameters deviate beyond the range of values found by Heyer & Brunt (2004), there are significant differences between the two regions. The Zone I scaling coefficient, , is significantly larger than the corresponding value calculated for Zone II. The enhanced value parameters in Zone I may result from the interaction between the HII region and cloud. Such interactions inject energy into the system that lead to stronger, non-gaussian velocity fluctuations.
The scaling law parameters in Zone II are similar to the values derived for G216-2.5 that indicate a connection between the diffuse gas distribution in these regions and the properties of the velocity field. These similarities may be due to both regions having recently condensed from overlying atomic material and have not yet achieved thermal or dynamical balance. The absence of resolved high volume or column density cores may arise from local velocity fields with negligible longitudinal components that are responsible for converging flows. However, the scaling exponents are still larger than the value expected from a purely incompressible flow (=1/3). Such smoothly distributed material may also result from continued magnetic support enabled by sufficient ionization by ambient UV radiation in these low column density zones (Johnstone, Di Francesco, & Kirk 2004).
5 Discussion
The decomposition of the Rosette and G216-2.5 spectral line data cubes of 12CO and 13CO emission with PCA offer important constraints to the turbulent flow properties in these clouds and enable a coarse but valuable assessment of the turbulent fragmentation description of star formation. Specifically, we seek to evaluate the relationship of the star formation efficiency with the turbulent flow properties: the driving scale, , the sonic scale, , and the turbulent Mach number that may be expected to regulate the formation and evolution of protostellar cores within molecular clouds. The star formation rate, , within a given solid angle subtended by the mapped area is derived from the measured far infrared luminosity,
where
and are the bandwidth and measured IRAS fluxes at 60 and 100m bands, d is the distance to the cloud and a Miller-Scalo IMF is assumed (Thronson & Telesco 1986). The fluxes include contributions from both embedded point sources and extended emission from grains heated by strong, UV fields of massive stars. Consequently, it provides an upper limit to the star formation rate for low mass star forming regions where the diffuse far-infrared dust component is primarily heated by the ambient interstellar radiation field. The inverse gas depletion time, , is derived from the ratio of the cloud mass to the star formation rate. Its inverse, , provides a surrogate measure of the star formation efficiency. Using 12CO to derive M( ), the values for are 2.910-9 yr-1 for the Rosette and 1.810-10 yr-1 for G216-2.5.
The decomposition of the 12CO and 13CO data cubes with PCA are used to derive the basic turbulent flow properties to compare with the star formation efficiencies. The role of the turbulent driving scale is not considered here as there is no accurate measure of but only coarse estimates that is comparable to or larger than the size of the cloud (Brunt 2003).
The sonic scale, , corresponds to the scale at which the turbulent velocity fluctuations are comparable to the local sound speed. It can be observationally defined from the scaling parameters, and ,
where is the local 1D, isothermal sound speed for inclusive of He abundance. Inverting this expression, the sonic scale is,
where T is the kinetic temperature of the gas and is the mean molecular weight. Values of for the Rosette and G216-2.5 are derived for each isotope assuming a kinetic temperature of 10 K and are listed in Table 1. This may underestimate the sonic scale for the Rosette for which warmer temperatures may prevail within the star or cluster forming cores (Williams & Blitz 1998). However, such cores comprise a small fraction of the total mass of the cloud. The 12CO peak temperatures for much of the Rosette cloud are consistent with 10 K. Based on the 12CO data, the sonic scales for the Rosette and G216-2.5 clouds are 0.330.02 pc and 0.200.04 pc respectively.
The turbulent Mach number is conventionally estimated from the dispersion of velocities within a cloud volume. Formally, this global line width simply reflects the structure function evaluated at the cloud size and is not useful when comparing clouds with different sizes. For example, two clouds with identical structure functions but with different sizes, would have different global velocity dispersions. Numerical simulations of interstellar turbulence often quote the variance of the full velocity field. However, such studies typically keep the size of the model cloud constant so these effectively evaluate the Mach number at a fixed scale. A more useful quantity to compare clouds is the mean turbulent velocity fluctuation at a fixed scale. The scaling coefficient, , defined in equation 1, describes the amplitude of velocity fluctuations at a scale of 1 pc. We use this quantity to derive the Mach number, measured at this fixed reference scale,
The is 4.20.17 for the Rosette and 4.70.12 for G216-2.5 assuming a kinetic temperature of 10 K.
From this limited sample of two extremely different clouds, one could conclude that the turbulent Mach number does not regulate the formation of stars in molecular clouds and there is some positive relationship between star formation efficiency and . This assumes that our measure of the star formation efficiency, , is indicative of the fraction of the cloud that is converted into stellar mass after several crossing times. To more critically examine this relationship, we have supplemented the Rosette and G216-2.5 clouds with 12CO measurements from GMCs within the FCRAO Outer Galaxy Survey (Heyer et al. 1998) and recent imaging surveys of the Cepheus region of the Galaxy (Brunt & Mac Low 2004). These additional clouds span the range of star formation efficiencies set by the Rosette and G216-2.5 clouds and comprise the sample used by Heyer & Brunt (2004). For GMCs with , we designate the derived values of the inverse gas depletion time to be upper limits as a significant fraction of the emitted far infrared flux is from grains heated by the ambient radiation field rather than nearby, recently formed early type stars. The variation of with and is shown in Figure 7. For the full set of clouds, no systematic trends can be identified between the star formation efficiency and either the sonic scale or Mach number.
A relationship between and can be identified within the set of clouds with that are currently producing OB stars and stellar clusters. The relationship is described by the fitted exponential, yr-1 that demonstrates a sensitive dependence of the star formation efficiency on the sonic scale for these regions. However, the ratio of newborn stellar mass to that of the parent molecular cloud for this sample of clouds is low (several percent). Such low star formation efficiencies are realized in numerical simulations of turbulence for which the driving scale is small compared to the cloud size enabling wide-spread support of the cloud against self-gravity (Klessen, Heitsch, & Mac Low 2000). In the non-magnetic case, simulations that drive the turbulent motions at large scales are overly efficient at producing newborn stars (Klessen, Heitsch, & Mac Low 2000; Vazquez-Semadeni, Ballesteros-Paredes, & Klessen 2003). Li et al. (2004) show that MHD turbulence driven at large scales can delay the onset collapse and reduce the efficiency. Similarly, Vazquez-Semadeni et al. (2005) demonstate that the efficiencies are similar to observed values by the inclusion of the magnetic field that limits the probability of forming collapsing cores.
These results dictate that non-magnetic, turbulent fragmentation does not exclusively regulate the formation of stars in the ISM. It may play a role in determining the efficiency through which stars are produced within molecular clouds currently forming clusters and massive stars. Such regions may be globally supercritical, () so that density perturbations can readily develop from supersonic shocks generated by turbulent gas flows or from external triggering agents such as an expanding ionization front. For low mass star forming regions, the role of non-magnetic turbulent fragmentation must necessarily be limited in this sample of clouds.
6 Summary
Wide field imaging of 12CO and 13CO J=1-0 emission from the Rosette and G216-2.5 molecular clouds is presented. These GMCs represent quite different states of star formation activity and provide valuable information to assess interstellar turbulence and its role in regulating star formation. From the analysis of the spectroscopic data, we find
-
1.
The velocity fields of both clouds are described by structure functions with similar scaling parameters. This suggests that turbulent motions are sustained by an external source of energy and not by internal energy sources.
-
2.
Within the Rosette Molecular cloud, we identify local variations of the velocity structure function due to the expansion of ionized gas. However, such interactions are spatially limited and have not yet propagated through the cloud to significantly modify the global dynamics of the cloud.
-
3.
None of the relationships predicted by turbulent fragmentation descriptions of star formation are identified within the full set of giant molecular clouds that span a broad range of masses and specfic star formation rates, . For a subset of clouds that are currently forming clusters, a correlation is found between the sonic scale and the inverse gas depletion time, . We conclude that turbulent fragmentation does not exclusively regulate star formation activity within all clouds.
References
- Blitz & Stark (1986) Blitz, L. & Stark, A.A. 1986, ApJ, 300, L89
- Brunt (1999) Brunt, C.M. 1999, Ph.D. Dissertation, University of Massachusetts
- Brunt & Heyer (2002) Brunt, C.M. & Heyer, M.H. 2002, ApJ, 566, 276
- Brunt (2003) Brunt, C.M. 2003, ApJ, 584, 293
- Brunt et al. (2003) Brunt, C.M., Heyer, M.H., Vazquez-Semadeni, E., & Pichardo, B. 2003, ApJ, 595, 824
- Brunt & Mac Low (2004) Brunt, C.M. & Mac Low, M. 2004, ApJ, 604, 196
- Cox (91) Cox, P., Deharveng, L. & Leene, L. 1991, AA, 230, 171
- Dickman (1978) Dickman, R. L. 1978, ApJS, 37, 407
- Gordon, Baars, & Cocke (1992) Gordon, M.A., Baars, J.W.M., & Cocke, W.J. 1992, AA, 264, 337
- Heyer & Schloerb (1997) Heyer, M.H. & Schloerb, F.P. 1997, ApJ, 475, 173
- Heyer et al. (1998) Heyer, M.H., Brunt, C., Snell, R.L., Howe, J.E., Schloerb, F.P., & Carpenter, J.M. 1998, ApJS, 115, 241
- Heyer & Brunt (2004) Heyer, M.H. & Brunt, C. 2004, ApJ, 615, L45
- Johnstone, Di Francesco, & Kirk (2004) Johnstone, D., Di Francesco, J., & Kirk, H. 2004, ApJ, 611, L45
- (14) Kleiner, S. C. & Dickman, R. L. 1985, ApJ, 295, 466
- Klessen et al. (2000) Klessen, R.S., Heitsch, F., & Mac Low, M. 2000, ApJ, 535, 887
- Kuchar & Bania (1993) Kuchar, T.A. & Bania, T.M. 1993, ApJ, 414, 664
- Larson (1981) Larson, R.B. 1981, MNRAS, 194, 809
- (18) Lazarian, A. & Pogosyan, D. 2000, ApJ, 537, 720
- Lee, Snell, & Dickman (1996) Lee, Y., Snell, R.L., & Dickman, R.L. 1996, ApJ, 472, 275
- Li etal (2004) Li, P.S., Norman, M.L., Mac Low, M., & Heitsch, F. 2004, ApJ, 605, 800
- (21) Lizano, S. & Shu, F.H. 1989, ApJ, 342, 834
- Mac Low & Klessen (2004) Mac Low, M., & Klessen, R.S. 2004, Reviews of Modern Physics, 76, 125
- Maddalena & Thaddeus (1985) Maddalena, R. & Thaddeus, P. 1985, ApJ, 294, 231
- Magnani, Blitz, & Mundy (1985) Magnani, L. Blitz, L, & Mundy, L. 1985, ApJ, 295, 402
- (25) Miesch, M.S. & Bally, J., 1994, ApJ, 429, 645
- Mooney & Solomon (1988) Mooney, T.J. & Solomon, P.M. 1988, ApJ, 334, L51
- Mouschovias (1976) Mouschovias, T.Ch. 1976, ApJ, 207, 141
- (28) Nakamura, T. & Li, Z.-Y. 2005, ApJ, 631, 411
- (29) Nakano, T. & Nakamura, T. 1978, PASJ, 30, 671
- Padoan (1995) Padoan, P. 1995, MNRAS, 277, 377
- Padoan & Nordlund (2002) Padoan, P. & Nordlund, A. 2002, ApJ, 576, 870
- Padoan, Goodman, & Juvela (2003) Padoan, P., Goodman, A.A., & Juvela, M. 2003, ApJ, 588, 881
- Patel, Xie, & Goldsmith (1993) Patel, N.A., Xie, T.,& Goldsmith, P.F. 1993, ApJ, 413, 593
- Phelps & Lada (1997) Phelps, R.L. & Lada, E.A. 1997, ApJ, 477, 176
- Press etal (1992) Press,W.H., Teukolsky, S.A., Vetterling, W.T., & Flannery, B.P. 1992, in Numerical Recipes in C. The Art of Scientific Computing, Cambridge: University Press, p. 691
- Scalo (1984) Scalo, J.M. 1984, ApJ, 277, 556
- Scoville & Good (1988) Scoville, N.Z. & Good, J.S. 1988, ApJ, 339, 149
- Schneider etal (1996) Schneider, N., Stutzki, J., Winnewisser, G. & Blitz, L. 1996, ApJ, 468, L119
- Schneider etal (1998) Schneider, N., Stutzki, J., Winnewisser, G., Poglitsch, A., & Madden, S. 1998, AA, 338, 262
- Snell, Heyer, & Schloerb (1988) Snell, R.L, Heyer, M.H., & Schloerb, F.P. 1988, ApJ, 337, 739
- Strong & Mattox (1996) Strong, A. W. & Mattox, J. R. 1996, AA, 308, L21
- Stutzki etal (1998) Stutzki, J., Bensch, F., Heithausen, A., Ossenkopf, V., Zielinsky, M. 1998, AA, 336, 697
- (43) Thronson, H.A. & Telesco, C.M. 1986, ApJ, 311, 98
- Vazquez-Semadeni et al. (2003) Vazquez-Semadeni, E., Ballesteros-Paredes, J.E. & Klessen, R.S. 2003, ApJ, 585, L131
- Vazquez-Semadeni et al. (2005) Vazquez-Semadeni, E., Kim, J., Shadmehri, M., & Ballesteros-Paredes, J.E. 2005, ApJ, 618, 344
- White etal (1997) White, G.J., Lefloch, B., Fridlund, C.V.M., Aspin, C.A., Dahmen, G., Minchin, N.R., & Huldtgren, M. 1997, AA, 323, 931
- Williams, Blitz, & Stark (1995) Williams, J.P., Blitz, L., & Stark, A.A. 1995, ApJ, 451, 252
- Williams & Maddalena (1996) Williams, J.P.& Maddalena, R. 1996, ApJ, 464, 247
- Williams & McKee (1997) Williams, J.P. & McKee, C.F. 1997, ApJ, 476, 166
- Williams & Blitz (1998) Williams, J.P. & Blitz, L. 1998, ApJ, 494, 657


| (10 K) | ||||
|---|---|---|---|---|
| (pc) | ||||
| Rosette | ||||
| 12CO | 0.73 0.03 | 0.74 0.04 | 0.660.04 | 0.330.02 |
| 13CO | 0.77 0.04 | 0.84 0.13 | 0.760.12 | 0.360.07 |
| G216-2.5 | ||||
| 12CO | 0.82 0.03 | 0.63 0.04 | 0.520.07 | 0.200.04 |
| 13CO | 0.80 0.02 | 0.56 0.02 | 0.400.04 | 0.130.02 |
| Rosette Zone I | |||
|---|---|---|---|
| 12CO | 1.00 0.04 | 0.79 0.06 | 0.710.05 |
| 13CO | 1.16 0.07 | 0.86 0.09 | 0.780.08 |
| Rosette Zone II | |||
| 12CO | 0.70 0.03 | 0.66 0.06 | 0.580.10 |
| 13CO | 0.68 0.07 | 0.67 0.12 | 0.590.20 |