Nuclear astrophysical plasmas: ion distribution functions and fusion rates
This article illustrates how very small deviations from the Maxwellian exponential tail, while leaving unchanged bulk quantities, can yield dramatic effects on fusion reaction rates and discuss several mechanisms that can cause such deviations.
Fusion reactions are the fundamental energy source of stars and play important roles in most astrophysical contexts. Since the beginning of quantum mechanics, basic questions were addressed such as how nuclear reactions occur in stellar plasmas at temperatures of few keV (1 keV ∘K) against Coulomb barriers of several MeV and what reactions or reaction networks dominate the energy production. It was soon realized that detailed answers to such questions involved not only good measurements or quantum mechanical understanding of the relevant fusion cross sections, but also the use of statistical physics for describing energy and momentum distributions of the ions and their screening [1].
Gamow understood that reacting nuclei penetrate Coulomb barriers by means of the quantum tunnel effect and Bethe successfully proposed the CNO and then the pp cycle as candidates for the stellar energy production: this description has been directly confirmed by several terrestrial experiments that have detected neutrinos produced by pp and CNO reactions in the solar core [2].
In the past only few authors (e.g., d’E. Atkinson, Kacharov, Clayton, Haubold) examined critically the energy distribution and proposed that such distribution could deviate from the Maxwellian form. In fact, it is commonly accepted that main-sequence stars like the Sun have a core, i.e. an electron nuclear plasma, where the ion velocity distribution is Maxwellian. In the following, we first discuss why even tiny deviations from the Maxwellian distribution can have important consequences and then what can originate such deviations.
Thermonuclear reaction in plasmas and distribution tails
In a gas with () particles of type 1 (2) per cubic centimeter and relative velocity , the reaction rate (the number of reactions per unit volume and unit time) is given by
| (1) |
where is the nuclear cross section of the reaction. The reaction rate per particle pair is defined as the thermal average
| (2) |
where the particle distribution function is a local function of the temperature [3].
Therefore, the reaction rate per particle pair is determined by the specific cross section and by the velocity distribution function of the reacting particles. When no energy barrier is present and far from resonances, cross sections do not depend strongly on the energy. Most of the contribution to comes from particles with energy of the order of , and the dependence on the specific form of is weak. The same is true for bulk properties that receive comparable contributions from all particles: e.g., the equation of state.
The situation is very different in the presence of a Coulomb barrier, when the reacting particles are charged, as in the fusion reactions that power stars [7]. The penetration of large Coulomb barriers ( is of the order of thousands in units of when is a typical nuclear radius) is a classically forbidden quantum effect. The penetration probability is proportional to the Gamow factor , where the Gamow energy , is the fine structure constant, is the reduced mass, and are the charges of the ions. The cross section is exponentially small for and grows extremely fast with the energy; therefore, one usually defines the astrophysical factor, whose energy dependence is weaker
| (3) |
The two factors in the integrand in Eq. (2) that carry most of the energy dependence are the Maxwellian distribution , which is exponentially suppressed for , and the penetration factor , which is exponentially suppressed for . Contributions to the rate come only from an intermediate region (Gamow peak) around the temperature-dependent energy
| (4) |
which is called the most effective energy, since most of the reacting particles have energies close to .
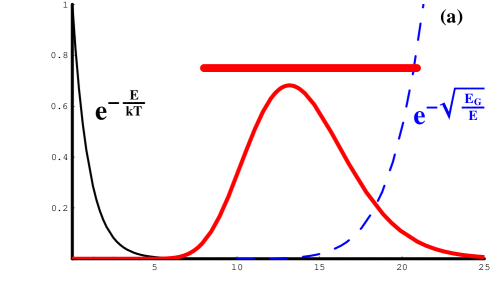
Figure 1 gives a pictorial demonstration of how the Gamow peak originates and how different reactions select different parts of the distribution tail and can be used to probe it.
In the upper panel (a) the exponentially decreasing function (thin black curve) is the Maxwellian factor; the rapidly growing function (dash blue curve) is the penetration factor (for graphical reason multiplied by ) of one of the most important reactions in the Sun, 3He + 3He 4He + 2 ( MeV), which corresponds to a most effective energy kT for keV ∘K; the product of the two functions (Gamow peak) is the thick red curve. Note that the Gamow peak, and therefore the rate, is very small (it has been multiplied by an additional factor to make it visible on the same scale of the other curves), since at the most effective energy both the cross section and the number of particles are exponentially small. At this point is important to remark that the area under the Maxwellian curve for energies within the Gamow peak (the energy window indicated by the red band) is of the order of 0.1% of the total area: only a few particles in the tail of the distributions contribute to the fusion rate.
The fact that the penetration factor effectively selects particles in the tail of the distribution is the more dramatic the larger the charge of the reacting ions: for the N 15O + (the leading reaction of the CNO cycle, which dominates the energy production in main-sequence stars larger or older than the Sun) the contributing particles are few in a million.
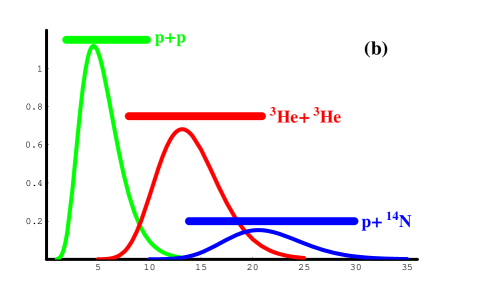
The effect on the Gamow peak when increasing the charges of the reacting nuclei is shown in the lower panel (b) of Figure 1. The green, red, and blue curves show the Gamow peak multiplied by , , and , respectively, for three fundamental reactions in main-sequence stars: ( keV), 3He + 3He 4He + 2 ( MeV), and N 15O + ( MeV)). It is immediately evident that the larger the charges of the ions the higher is the energy of the particles that contribute to the rate, the (much) lower is the peak and, therefore, the (much) smaller is the rate. In fact the maximum of the Gamow peak and its hight is proportional to .
A convenient parametrization of deviations from the Maxwell distribution is the deformed -exponential:
| (5) |
which naturally appears in Tsallis’ formulation of statistical mechanics [4]. This particular deformation of the exponential has the advantage of describing both longer tails (for ) and cut-off tails (for ), while reproducing the exponential in the limit .
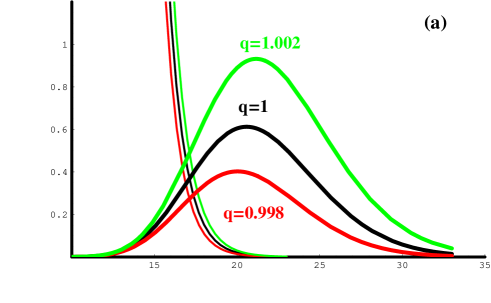
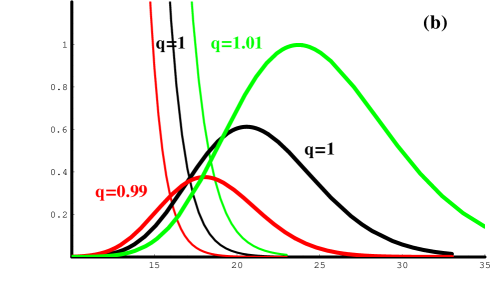
Figure 2 shows the effect of substituting to the Maxwellian distribution the distribution , where is the normalization factor that conserves the total number of particles. We show the effect for the N reaction and the values (a) and (b) . This reaction determines the rate of energy production from the CNO cycle, dominant at older stages and, therefore, also determines the time of the exit from the main sequence. Black curves refer to the exponential (), red curves refer to the cut-off () exponential, and green curves refer to the longer-tail () exponential.
Note that all exponentials have been multiplied times a huge factor for emphasizing their tiny differences: these values of produce functions that are almost indistinguishable from the exponential unless one looks very far in the tail.
One can make several remarks:
-
•
Gamow peaks are shifted towards higher energies, when the distribution has a tail longer than the exponential (green curves, ); they are shifted towards lower energies for cut-off exponentials (red curves, );
-
•
the effect is larger the larger the deviation from the exponential (the larger );
-
•
the peaks (and the rates) become correspondingly higher for and smaller for ;
-
•
the effect on the rate is already large for , it becomes huge (more than a factor of 10) for ; note that the green (red) peak in lower panel (b) of figure 2 () has been divided (multiplied) by five to make them fit on the same scale!
These deviations should be carefully estimated, since reliable calculations of nuclear reaction rates in stellar interiors is fundamental for a quantitative understanding of the structure and evolution of stars. In fact, while the overall stellar structure is rather robust, changes of some of the rates even by few percent can produce detectable discrepancies, when precise measurements are possible, e.g., in the case of the solar photon and neutrino luminosity, and mechanical eigenfrequencies [2]. In quasi-stellar objects like Jupiter deviations could be even larger and explain their excess energy [5].
As already shown in the recent past, very small deviations from Maxwellian momentum distribution do not modify the properties of stellar core and are in agreement with the helioseismology constraints [6], but may affect the evaluation of the nuclear fusion rates that may be enhanced or depleted, depending on superdiffusion or subdiffusion property of the particles [7].
Deviations from Maxwellian distribution
Normal stellar matter, such as the one in the Sun, is non-degenerate, i.e., quantum effects are small (in fact, they are small for electrons and completely negligible for ions), it is non-relativistic, and it is in good thermodynamical equilibrium. On this ground, the particle velocity distribution is almost universally taken to be a Maxwell-Boltzmann (MB) distribution.
Concerning the thermodynamical equilibrium, main sequence stars are more precisely in a stationary state where the luminosity equals the heat production rate. This metastable state has a long life-time, of the order of the star life-time, and it ends when the nuclear fuel is burned out. In addition, the quasi-equilibrium is only local, since the temperature decreases from core to surface. However, nuclear reactions are often, but not always, sufficiently slow on the scale of thermal and mechanical exchanges and take place on such a small scale that spatial and temporal deviations from equilibrium can be neglected to a very good first approximation.
At least in one limit the MB distribution can be rigorously derived: systems that are dilute in the appropriate variables, whose residual interaction is small compared to the one-body energies. In spite of the fact that the effects of the residual interaction cannot be neglected (the electron screening factor is a well-known example of correction due to the astrophysical plasma environment) at zero order the many-body correlations can be neglected and the stellar interior can be studied in this dilute limit. In this limit the velocity distribution is the Maxwellian one.
However, one should keep in mind that derivations of the ubiquitous Maxwell-Boltzmann distribution are based on several assumptions [7]. In a kinetic approach, one assumes (1) that the collision time be much smaller than the mean time between collisions, (2) that the interaction be sufficiently local, (3) that the velocities of two particles at the same point are not correlated (Boltzmann’s Stosszahlansatz), and (4) that energy is locally conserved when using only the degrees of freedom of the colliding particles (no significant amount of energy is transferred to collective variables and fields). In the equilibrium statistical mechanics approach, one uses the assumption that the velocity probabilities of different particles are independent, corresponding to (3), and that the total energy of the system could be expressed as the sum of a term quadratic in the momentum of the particle and independent of the other variables, and a term independent of momentum, but if (1) and (2) are not valid the resulting effective two-body interaction is non-local and depends on the momentum and energy of the particles. Finally, even when the one-particle energy distribution is Maxwellian, additional assumptions about correlations between particles are necessary to deduce that the relative-velocity distribution, which is the relevant quantity for rate calculations, is also Maxwellian.
In the following we give arguments and mechanisms that lead to distribution functions that are different from the MB one in a stationary state.
Correlations between particles, so that the probability distribution of the system is not described by the product of independent probabilities of the components, are in general responsible for such more general distributions. The specific microscopic mechanisms that generate these correlations depend on the particular system and there exist many approaches to derive the relevant distributions.
In an approach that uses the Fokker-Planck equation, which takes into account the average effects of the environment through the drift and diffusion coefficients, stationary solutions different from the Maxwell distribution (e.g. Druyvenstein or Tsallis like distributions) can be obtained, when and include powers of higher than the lowest order [8]. The presence of higher powers of , i.e., higher derivative terms, can be interpreted as a signal of non-locality in the Fokker-Planck equation. We stress that these distributions are stationary (stable or metastable) and what counts to decide the distribution is the type of collisions between ions and the dependence on momentum of the elastic collisional cross sections (Coulomb, screened Coulomb, enforced Coulomb, among others), or the presence of ion-ion correlations [9].
The presence of random fields (e.g., distributions of random electric micro-fields or, in general, of random forces) introduces in the kinetic equations factors whose effect is to enhance or to deplete the high-momentum tail of the distribution function [7].
Because of the many-body nature of the effective forces, which makes the collisions not independent, the distributions of the relevant degrees of freedom observed, e.g., the ones selected by a fusion reaction, can be different from the distributions of the quasi-particles that describe the plasma. In addition the plasma makes effective interactions time dependent (memory effects) and non-local. These effects depend strongly on the energy of the selected particles and on the collisional frequency.
One important and clear example of this last point is given by the fact that many processes, such as nuclear fusion itself, depend on momentum rather than on energy. This distinction is important because, due to plasma many-body effects, an uncertainty relation holds between momentum and energy [10]. Even when the energy distribution maintains its Maxwellian expression, the momentum distribution can be different in the high energy tail. In fact, this quantum uncertainty effect (not Heisenberg uncertainty) between energy and momentum , caused by the many-body collisions and described by the Kadanoff-Baym equation, implies an energy-momentum distribution of the form
| (6) |
with
| (7) |
where is the mass operator of the one-particle Green function. After integrating in the product of and the Maxwellian energy distribution, we obtain a momentum distribution with an enhanced high-momentum tail. Although this approach produces a deviation from MB distribution, the state represented by is an equilibrium state [11, 12]. The Maxwellian distribution is recovered in the limit when becomes a function with a sharp correspondence between momentum and energy.
Distributions different from the Maxwellian one can also be obtained axiomatically from non-standard, but mathematically consistent, versions of statistical mechanics that use entropies different from the Boltzmann-Gibbs one [4, 13].
We have argued that it is not sufficient to know that the Maxwellian distribution is a very good approximation to the particle distribution. We must be sure that there are no corrections to a very high accuracy, when studying reactions that are highly sensitive to the tail of the distribution, such as fusion reactions between charged ions. Several mechanisms have been outlined (others need to be studied) that can produce small, but important deviations in the tail of the distribution.
References
- [1] R. d.Escourt Atkinson and F. G. Houtermans, Z. Physik 54 (1929) 656.
- [2] V. Castellani et al, Phys. Rept. 281 (1997) 309 [arXiv:astro-ph/9606180].
- [3] D. Clayton, Principles of Stellar Evolution and Nucleosynthesis (New York: McGraw-Hill Book Company, 1968).
- [4] C. Tsallis, J. Statist. Phys. 52 (1988) 479.
- [5] M. Coraddu et al, PhysicaA 305 (2002) 282 [arXiv:physics/0112018].
- [6] S. Degl’Innocenti et al, Phys. Lett. B 441 (1998) 291 [arXiv:astro-ph/9807078].
- [7] M. Coraddu et al, Braz. J. Phys. 29 (1999) 153 [arXiv:nucl-th/9811081].
- [8] G. Kaniadakis and P. Quarati, PhysicaA 192 (1993) 677; ibid. 237 (1997) 229.
- [9] F. Ferro and P. Quarati, Phys. Rev. E 71 (2005) 026408 [arXiv:cond-mat/0407665].
- [10] V. M. Galitskii and V. V. Yakimets, JEPT 24 (1967) 637.
- [11] A. N. Starostin, V. I. Savchenko, and N. J. Fisch, Phys. Lett. A 274 (2000) 64.
- [12] M. Coraddu et al, PhysicaA 340 (2004) 490 [arXiv:nucl-th/0401043].
- [13] G. Kaniadakis et al, Phys. Rev. E 71 (2005) 046128 [arXiv:cond-mat/0409683].