Revisiting the Infrared Spectra of Active Galactic Nuclei with a New Torus Emission Model
Abstract
We describe improved modelling of the emission by dust in a toroidal–like structure heated by a central illuminating source within Active Galactic Nuclei (AGN). We chose a simple but realistic torus geometry, a flared disc, and a dust grain distribution function including a full range of grain sizes. The optical depth within the torus is computed in detail taking into account the different sublimation temperatures of the silicate and graphite grains, which solves previously reported inconsistencies in the silicate emission feature in type-1 AGN. We exploit this model to study the spectral energy distributions (SEDs) of extragalactic (both type-1 and type-2) sources using archival optical and infrared (IR) data. We find that both AGN and starburst contributions are often required to reproduce the observed SEDs, although in a few cases they are very well fitted by a pure AGN component. The AGN contribution to the far-IR luminosity is found to be higher in type-1 sources, with all the type-2 requiring a substantial contribution from a circum-nuclear starburst. Our results appear in agreement with the AGN Unified Scheme, since the distributions of key parameters of the torus models turn out to be compatible for type-1 and type-2 AGN. Further support to the unification concept comes from comparison with medium-resolution IR spectra of type-1 AGN by the Spitzer observatory, showing evidence for a moderate silicate emission around µm which our code reproduces. From our analysis we infer accretion flows in the inner nucleus of local AGN characterized by high equatorial optical depths (), moderate sizes () and very high covering factors ( per cent) on average.
keywords:
radiative transfer – galaxies: active – galaxies: individual: Circinus – galaxies: individual: NGC 1068 – galaxies: individual: Mrk 231 – galaxies: starburst – infrared: general1 INTRODUCTION
The idea that the quasar infrared (IR) spectral energy distribution (SED) could be dominated by thermal emission from dust was already proposed by Neugebauer et al. (1979), who noted an excess at µm with respect to the power–law emission that was known to dominate the ultraviolet (UV) and optical spectrum. Barvainis (1987) was the first to demonstrate that it was possible to describe this emission by means of thermal radiation from dust heated by the primary optical/UV continuum known to dominate type-1 AGN SED. He considered an optically thick, either smooth or a clumpy dust distribution within a non-spherical geometry. Such a model could naturally account for the observed µm bump, which was attributed to graphite grains with temperatures close to their sublimation limit. The broadness of the IR SED, that could not be reproduced by means of a single-temperature black body, was explained in terms of multiple temperature components of dust.
More quantitative models have been developed since then, accounting for different features and using different computational approaches for solving the radiative transfer equation. Pier & Krolik (1992) suggested an emission model from an annular ring of dust. Assuming a common extinction curve for all of the grains, a distribution function of grain composition and sizes as given in Mathis et al. (1977) and not accounting for light scattering, they solved the radiative transfer problem with the Böhm-Vitense method described in Mihalas (1978). Based on this model, they explored the main properties of IR emission in AGN, such as the width of the SED and the wavelength of peak emission, IR colours and the presence and/or absence of the µm silicate feature.
Granato & Danese (1994) solved the radiative transfer equation by means of the –iteration method (see 2.6 for more details), adopting the Rowan-Robinson (1992) model for interstellar dust, based on both graphite and silicate grains, and taking into account radiation scattering. Their adopted geometry was the so–called flared disc, with dust grain density that was allowed to vary both along the radial and the vertical coordinates.
Stenholm (1994) studied a configuration given by an optically thick silicate disc, finding no need for silicate grains depletion or non-standard dust composition in order to weaken the strength of the µm feature, which turned out to be weak in most of his models with optical depth larger than . Furthermore he found that, in contrast with Pier & Krolik (1992), scattering is not negligible and does affect the shape of the near IR emission in those models where optical depth is high.
Efstathiou & Rowan-Robinson (1995) analysed three different geometrical configurations for the torus, a flared and a tapered disc and an anisotropic sphere, and found that a tapered disc (i.e. a disc whose height increases along with distance from the center but flattens at a constant height in the outer parts) with an opening angle of was the most succesful representation of what was observed. They followed a ray–tracing numerical method, with the same dust mixture as in Rowan-Robinson (1992). The sublimation temperature was assumed to be K for all grains, while the distances from the central source where this temperature is reached were assumed to be dependent on the grain size. In the same line, Manske et al. (1998) modelled the dusty torus as a flared disc in which both graphite and silicate where taken to sublimate at a temperature of K. In their analysis they concluded that flared tori, dust composed of silicate and graphite grains and a power-law density distribution failed to explain the observed featureless AGN spectra.
In parallel, Nenkova et al. (2002) developed a torus model in which dust was distributed in clumps. They solved the radiative transfer for each clump by means of the radiative code dusty (Nenkova et al., 1999) and then computed the final emission as the sum of clumps’ emission calculated using a ray–tracing approach.
At variance with Efstathiou & Rowan-Robinson (1995), van Bemmel & Dullemond (2003) claim that the obscuring torus could not be flat (tapered, for example), and should rather be conical or flaring. Their more reliable models predicted constant density over the whole torus and a quite large value for the inner radius ( pc), which they found necessary in order to fit observed colours. They also tried to modify the power-law distribution function for grain sizes with respect to that given by Mathis et al. (1977), in order to attenuate the strength of the µm silicate feature and recently concluded that there was no need for a clumpy dust distribution (Dullemond & van Bemmel, 2005).
In the present paper we try to combine most of the successful features of the previous works to built an improved model explaining IR emission in AGN. The paper is organised as follows. Section 2 presents the physical and computational details of the model. Section 3 discusses the contribution of each of the model parameters in the produced SEDs. In Section 4 we explain the observed SEDs of a series of objects taken from the literature using various realisations of the torus model in combination with starburst templates. Finally in Section 5 we discuss our results and conclusions.
2 Model Description
2.1 Torus Geometry and Grain Sublimation
We use a simple but realistic geometry for the spatial distribution of dust: the flared disc (Efstathiou & Rowan-Robinson 1995, Manske et al. 1998 and van Bemmel & Dullemond 2003), that can be represented as two concentric spheres, delimiting respectively the inner and the outer torus radius, having the polar cones removed.
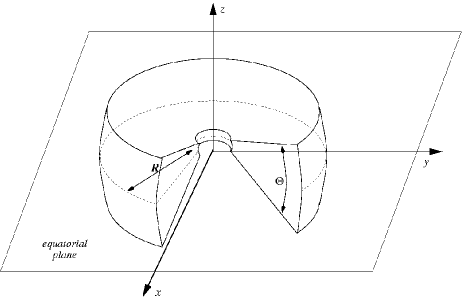
The size of the torus is defined by the outer radius – the inner radius being defined by the sublimation temperature of dust grains under the influence of the strong nuclear radiation field – and by the angular opening angle of the torus itself (see Fig. 1). Considering a typical graphite grain with radius µm and using the thermal equilibrium equation (see Eq. 7), Barvainis (1987) derives the following formula to compute the distance at which this grain reaches the sublimation temperature:
| (1) |
where is the bolometric ultraviolet/optical luminosity emitted by the central source, expressed in units of erg s-1 and is the sublimation temperature of the dust grain given in units of K. Note that this relations depends on both the grain dimension and species but we here assume as a common minimum radius the average one. We account for the different sublimation temperature of silicate grains, however, yielding a minimum radius that can be up to three times larger than the one for graphite. Furthermore, the presence of the dust layer composed by graphite grains, that attenuates the X-ray and UV emission, is taken into account when computing the silicate minimum radius.
2.2 Definition of the geometrical grid
We define a geometrical grid with reference to a polar coordinates system , as shown in Fig. 2, by dividing the torus in volume elements. We then compute all the quantities of interest within a given volume element as if all dust properties were those of the center. Since the temperature gradient is higher in the inner parts, we used a logarithmic–spaced division for the radial coordinate, in order to better sample the properties of the emission in the innermost regions.
The grid has a constant number of subdivisions in the azimuthal coordinate () that is fixed to , while the equatorial distance coordinate is divided in , and parts for models with respectively , and of torus amplitude. The radial coordinate is divided in , and parts for , and respectively. The wavelentgh values at which the spectrum is computed consist in a grid equally-spaced in logarithm with points in the range from to µm.

Neither the computation of the emitted radiation from each grain species in each volume elements within the torus, nor the computation of the optical depth between all torus cells are particularly CPU time consuming. However, for a typical element grid (see Sect. 3.1 below) this computation must be repeated times, if we want to evaluate the contribution to the radiation field in each element from all other in the torus. It is therefore essential to exploit all the symmetries of the adopted geometry, identifying groups of volume elements whose properties are identical all over the torus grid. For instance, all volume elements at any given have exactly the same dust density, temperature and emission conditions. It is sufficient to compute these quantities just for these elements, which we will refer to as sample elements.
Furthermore, when computing the incoming radiation on a given sample element, the problem is symmetric with respect to the plane, so it is possible to compute incoming radiation from just one side of the torus.
2.3 Dust properties
The main dust components are silicate and graphite grains, in almost equal percentages. The former are responsible for the observed absorption feature at µm in type-2 objects, while the latter are responsible for the rapid decline of the emission at wavelength shortwards of a few µm, corresponding to a black body emission of about K, the sublimation temperature for these particular grains.
Most models in the literature make use of a small number of grain categories at different sizes (e.g. Granato & Danese 1994; Efstathiou & Rowan-Robinson 1995). Following an approach similar to that of van Bemmel & Dullemond (2003), we decided to adopt a more complete distribution using, for each of the two species, scattering and absorption coefficients given by Laor & Draine (1993) for different grains sizes from to µm and from to µm for graphite and silicate respectively.
As for the distribution function for the grains sizes we adopted the MRN distribution (see Mathis et al. 1977):
| (2) |
where is the number of grains with radius between and normalized to the number of hydrogen atoms. As for the exponent , the value of the standard galactic extinction curve (Mathis et al. 1977, ) has been adopted, so that the extinction curve that characterizes our model is similar to the galactic one. The constant gives the normalization with respect to hydrogen abundance, and it is taken to be for graphite and for silicates (Draine & Lee, 1984).
2.4 The density law throughout the torus
We adopted a law for the gas density within the torus allowing for a density gradient along the radial and the polar distance () coordinates:
| (3) |
The normalization constant here is a linear function of the equatorial optical depth (see Section 2.7). The latter will be used in the following instead of the parameter.
2.5 Spectral intensity of the central power source
We assume that the torus is illuminated by a central point-like energy source with isotropic emission. We define its spectrum in the wavelength range µm µm (corresponding to the frequency range Hz) and described it as a composition of power laws with variable indices. The values that we adopted are the same as in Granato & Danese (1994) or Nenkova et al. (2002), namely:
| (4) |
where sets the bolometric luminosity normalization constant.
2.6 Solution of the radiative transfer equation
The radiation emitted by the above described physical configuration is given by the sum of the primary source located in the torus center and a secondary contribution given by thermal and scattering dust emission. Therefore dust plays a double role, first absorbing the radiant energy emitted by the primary source, partially or totally obscuring it, then re-emitting it at longer wavelengths, typically in the spectral range µm. A complication arises from the fact that dust can be optically thick to its own radiation. This requires the solution of the radiative transfer equation [Eq. (5) below]. In particular the presence of a dust scattering component makes this equation not solvable analytically: the source function is not known a priori, depending on the solution itself.
The thermal and scattered components of dust radiation are described by the absorption () and the scattering () coefficients respectively, so that the radiative transfer equation will be written as:
| (5) |
in which is the source function, that can also be written as (see Rybicki & Lightman 1979):
| (6) |
i.e. a weighted average of the two separate source functions.
We solved the transfer equation numerically adopting the –iteration method: A lower limit for the incident radiation is estimated assuming that the only source of radiation (and hence of dust–heating) is the central, non-thermal, source. The equilibrium temperature (and hence thermal emission) of the grains of each species in each sample element is found by solving the thermal equilibrium equation:
| (7) |
where the equation is written for a given species of grain and is the black body emission. is the temperature of a given grain within the -th sample element, represents the incoming specific intensity on the volume element, written, for the first iteration, as follows:
| (8) |
Here is the optical depth between the central source and the -th sample element and its distance.
At the second iteration the new incoming radiant flux on each grain of a given geometrical element that will enter in the Eq. 7 of the thermal equilibrium will be:
| (9) | |||||
where indicates the generic volume element and is their total number. is the total specific intensity hitting the –element and coming from both the AGN and the dust from the rest of the torus (scattering plus thermal) as computed from the previous step.
These calculations are iteratively repeated until the difference in the temperature value between two steps falls below one Kelvin for each grain species in each volume element. If such small variations do not have big influence on the final result when dealing with relatively low–density environments, it is important to achieve a good convergence when dealing with high optical depth tori, to avoid losses of energy due to the numerical method adopted.
 |
 |
The conservation of energy is always verified within 1 per cent for typical solutions and up to per cent for solutions with very high optical depth and non-constant dust density. These discrepancies are due to some approximations in the maximum temperature of the grains, but do not affect any of our conclusions.
In models with high dust densities where thermal emission strongly contributes to the self heating of the dust, the smaller grains can reach and even slightly exceed the sublimation temperature. In order to avoid further re-calculation of the optical depth and density profiles – that would result in a strong increasing of the computation time – temperatures which are too high are set equal to the sublimation value. If this also happens for the µm grains, then the inner radius is moved further out with respect to the value computed by means of Eq. 1.
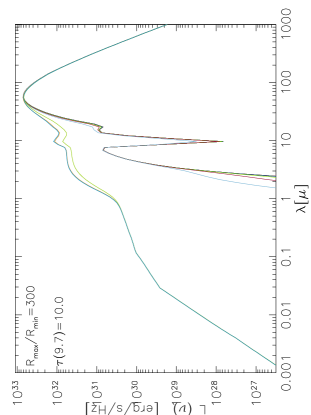
Various model solutions are reported in Fig. 3, where dust emission from elements at different distances from the central source are shown. The model solution on the left is built with a total opening angle of the torus of , a ratio and a constant density profile with equatorial optical depth . The minimum radius turns out to be pc for graphite and pc for silicate grains. The contribution to emission from the silicate grains, which is easily recognizable from the feature in emission at µm, only appears after the element number . The scattering component of radiation is clearly visible shortwards of µm.
The model shown on the right side of the panel has the same opening angle for the torus, an outer-to-inner ratio of , constant density profile and . In this case the minimum radius is the same ( pc) for graphite, but it is lower for silicate grains ( pc) whose emission appears after the element number over a total of radial subdivisions.
2.7 Details on the computation of dust density and optical depth
The model needs as a starting point the value of the equatorial optical depth at a given reference wavelength. Starting from this input condition we calculate the gas and dust densities and the number of the different dust grains within each sample element. With reference to Eq. 3, providing the spatial variation of density through the and parameters, the problem is to find the value yielding an equatorial optical depth . The expression for the latter is:
| (10) | |||||
where is the numeric density of the -th grain, normalized to that of hydrogen. Taking this into account and the difference in the sublimation temperatures of graphite and silicate and the discontinuity in the chemical composition of dust along the radial coordinate, the density is a step function that can be written as:
| (11) |
where the indices refer only to the silicate component. An analogous condition applies to the graphite grain distribution and their corresponding indices. Substituting the from Eq. 3 in Eq. 10 and solving for we obtain the correct value of density and number of dust grains at each point of the grid.
The most general expression for the optical depth between any two points and , located within the torus is:
| (12) | |||||
The optical depth is calculated as the path–integral of the density function along the straight line between the two points. Considering the conditions 11 in 12 automatically accounts for the fact that there are inner regions free of silicates due to their lower sublimation temperature and regions completely dust–free.
2.8 Calculation of the emitted spectrum
Adding the emission from all torus elements to that of the central source, attenuated by the correct value of optical depth when needed, yields the total emitted spectrum. Here it is computed for different inclination values of line-of-sight, spanning from to with respect to the equatorial plane.
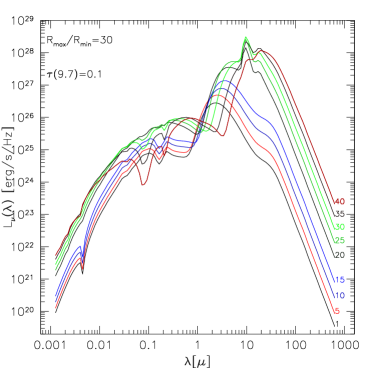
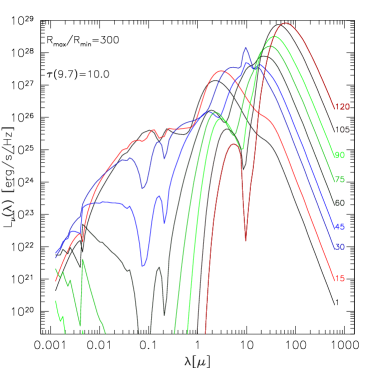
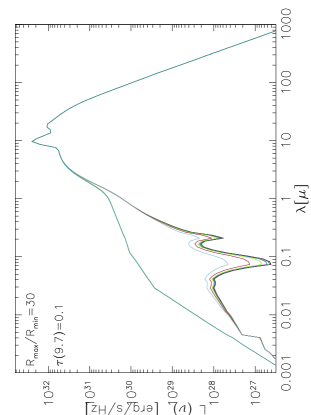
In Figs. 4 and 5 we show two emission models with different lines-of-sight and different physical and geometrical parameters. The first model is meant to represent a geometry in which the amplitude of the torus is , the ratio between external and internal radii is , the density is constant and the optical depth is . Such a configuration is obtained with a hydrogen column density of cm2 and corresponds to an optical extinction of . Note that the shape of the SED remains quite constant with varying angle, as long as the central source is seen directly. A similar behaviour is found when both the optical depth and the torus size increase. The emission pattern of Fig. 5 has a radial ratio of and the equatorial optical is .
3 MODEL REALISATIONS
We have computed a grid of models by varying the different parameters. Some of their main features and a rough comparison with other models in literature are presented here.
3.1 The grid of model solutions
We obtained a set of models spanning the widest range of physical and geometrical characteristics of dusty tori discussed in the literature. The models have varying radial ratios , corresponding to radial sizes from about to about pc (for an accretion luminosity of erg s-1), while the torus full opening angles were taken to be , and , corresponding to sizes of the torus between a minimum of to a maximum of pc. The equatorial optical depth was always measured at µm and the models have been computed at values of , , , , , , and , translating into values of absorption in the band from few to few hundreds magnitudes, depending also on the ratio. The parameters used to define the law for the spatial behaviour of density were and and and (see Eq. 3 for the definitions). In order to have a full exploration of the parameter space, we also considered models with density increasing towards the outer parts of the torus, obtained by setting . In Table 1 we summarize the main features of the model grid.
| Parameter | Adopted values | |
|---|---|---|
| RMax/Rmin | , , | |
| , , , , , , , | ||
| , , , | ||
| , | ||
| , , |
3.2 Main features of the models
3.2.1 The distribution of grains temperatures
One of the most evident features of the AGN IR emission is the presence of multiple temperature components. Especially when viewed face-on, the whole range of temperatures can be seen, from the innermost part – where grains are close to the sublimation limit – to the outer shells where the dust is colder, only heated by reprocessed IR radiation.
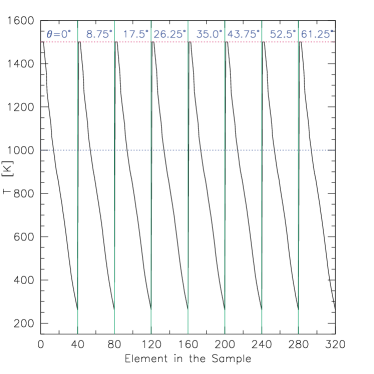
For models in which the spatial profile of density is kept constant with respect to the altitude angle , the temperature is assumed to vary only along the radial coordinate. Models with non-constant density profile can show a temperature gradient also with respect to the altitude coordinate. In Fig. 6 we show the trend of the dust equilibrium temperature as a function of the coordinates of the sample element. Two extreme cases are shown: a model with , and a constant density, and a model with the same parameters but a density profile varying like (in both cases a graphite grain with radius of µm is considered).
 |
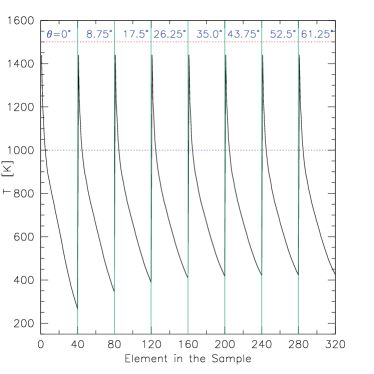 |
In the case of a constant dust density distribution, the temperature profiles drop roughly linearly with the distance from the central source. A non-constant density profile, in our case peaking in the inner part of the torus (close to the central source and to the equatorial plane), brings some differences. First of all, the decrease of dust density with increasing altitude on the equatorial plane results in lower values of the optical depth of the elements at lower coordinate. The temperature in the most distant volume elements will then increase with increasing altitude with respect to the equatorial plane. Furthermore, since the dust density peaks in the innermost regions, the temperature gradient will be higher for those volume elements that are closer to the inner edge of the torus. Moreover the high density (hence high optical depth) values that are found close to the inner radius are responsible for not always reaching the sublimation temperature: in such configurations the central source undergoes a high attenuation in the first layers of dust.
3.2.2 Dependence on the viewing angle
As expected for a geometry with no spherical symmetry, the emission is highly anisotropic especially when the lines of sight that cross the torus and those that see the AGN directly are considered (see Figs. 4 and 5). This feature is further highlighted if one considers a pattern in which the density is not constant along the altitude angle .
Figs. 4 and 5 show that the SED remain quite constant even with varying line-of-sight angle, until the latter intersects the dust-free zone, i.e. at . The only part of the emission that changes is the one shortwards of µm for low optical depth models, where the emission of the non-thermal central source is directly seen in the type-1 scheme configuration. In high optical depth systems this behaviour is maintained, but the drastic difference between type-2 and type-1 concerns the emission shortwards of µm.
If a non-constant density pattern is assumed the change is smoother since the emission from the central source becomes more visible as the torus is seen at decreasing polar angles, where the density is assumed to be lower with respect to the equatorial plane. Notice that with such density profiles and in those models with low optical depth values the direct view of the central source is achieved even when since the optical depth at higher altitudes becomes small enough. Then a substantial contribution of the accretion disc emission can be seen even through the dust cone. Configurations with decreasing number of dust grains with increasing altitude on the equatorial plane can be considered to mimic the tapered torus geometry analysed by Efstathiou & Rowan-Robinson (1995) since, at least for low values of the equatorial optical depth [i.e. ], the bulk of emission comes from those volume elements that are closer to the equatorial plane. The other elements of the geometrical grid will in fact provide a smaller contribution to the total emission, as they will contain a smaller number of grains.
3.2.3 The width of IR spectrum
One of the most important features of a dusty torus model is the capability of reproducing the observed width of the IR spectrum due to multi-temperature emission. Both Pier & Krolik (1992) and Granato & Danese (1994) use for its measure the logarithmic wavelength interval in which the power emitted in the IR is more than one third of the peak value (). When measured on a black body this parameter has a value of while, for example, in the observed spectra used by Granato & Danese (1994) its value is always larger than . In Fig. 7 we report the trend of the bump width as a function of optical depth for different torus sizes, as viewed along the torus equatorial plane. This parameter depends both on the optical depth value and on the torus size: increasing the values of the optical depth will tend to generally shrink the bump since the inner, hotter, parts will become less visible. At rising values of the radii ratio the bump will tend to broaden, since larger radii imply higher amounts of colder dust.
 |
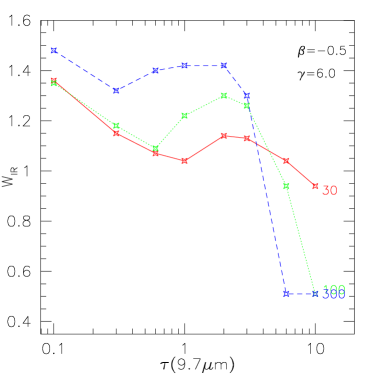 |
There are a few considerations to be made on the interpretation of the trend in Fig. 7. The maximum of emission for low values of optical depth falls right on top of the silicate feature which in these cases can display a very intense emission. This will in turn give a low value for the bump width as defined by Pier & Krolik (1992). Furthermore, very high values of optical depth will cause the silicate feature to appear in strong absorption especially at equatorial optical depth higher than , resulting, again, in a low width for the IR bump.
A density profile peaking towards the innermost regions of the torus is less affected by this behaviour. This is mainly due to the fact that in the latter case the silicate feature is less prominent both in emission and in absorption, compared to a constant dust distribution configuration.
3.2.4 The peak of the IR emission
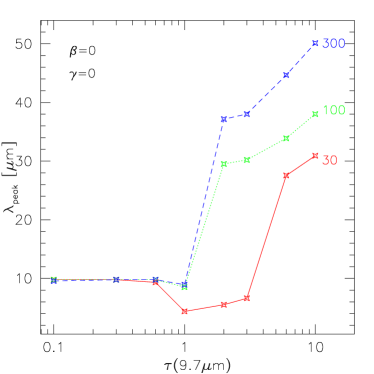
Another important parameter that can be used to characterize a model solution is , the wavelength at which the IR emission – expressed as – peaks. In Fig. 8 this parameter is shown against the optical depth and for the three torus sizes for which the model has been computed. Only type-2 (equatorial view) emission is shown here. The peak wavelength ranges from µm, corresponding to the presence of a strong silicate emission in models with low optical depth, to about µm obtained in the models with the largest outer radii and optical depth values.
 |
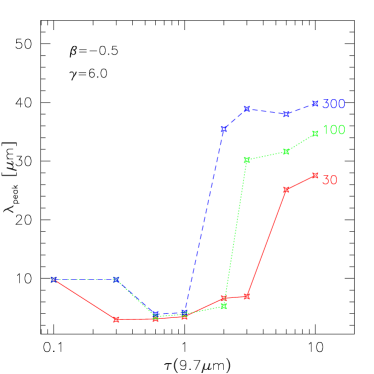 |
A non-constant dust density profile results in a hotter emission, with the emission peaking at smaller wavelengths. This occurs because lower densities – and hence lower optical depths – on the outer regions of the torus make the inner, hotter, regions more visible to the observer, increasing this way the average observed temperature.
3.2.5 The µm silicate feature
The presence of the absorption feature at µm in the spectra of Seyfert 2 galaxies has been used in the literature as a proof for the presence of silicate grains. At the same time, IR observations often showed rather featureless spectra for Seyfert 1 galaxies, which brought into question the reliability of the Unified Model: the characteristics of the silicate emission at this wavelength has become a crucial test of the validity of models. Nenkova et al. (2002) suggested that a clumpy distribution of dust may provide an explanation for the lack of the silicate feature in type-1 sources, while Dullemond & van Bemmel (2005) claim that the same result can be achieved in smooth tori. The depth of the same feature in type-2 sources, however, is shallower in clumpy tori.
 |
 |
 |
 |
Only very recently Siebenmorgen et al. (2005) and Hao et al. (2005) have found clear observational evidences for the presence of the µm silicate emission feature in type-1 quasars from spectral observations by the Spitzer Space Telescope.
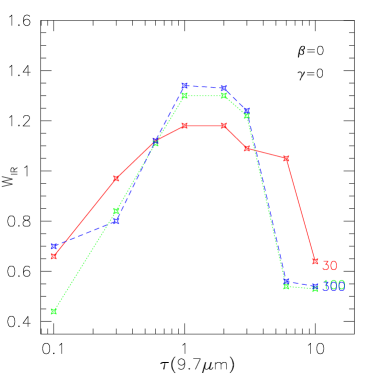
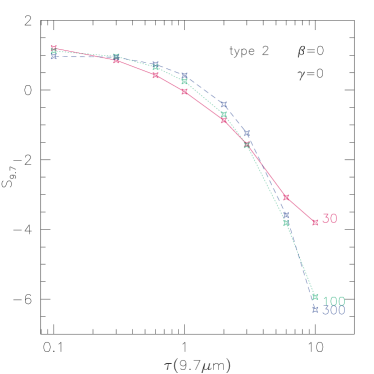
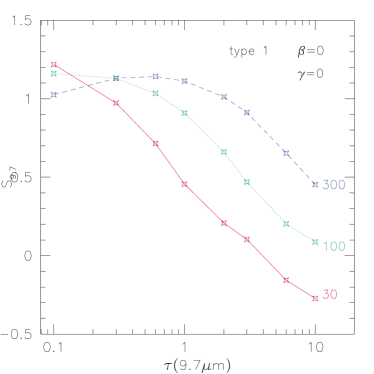
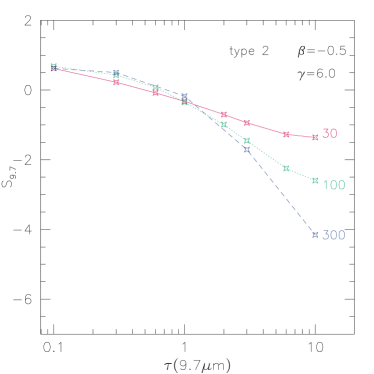
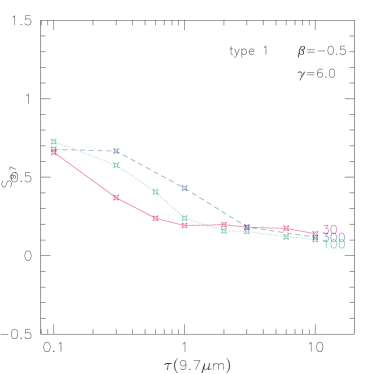
Following Pier & Krolik (1992) and Granato & Danese (1994), we measured the amplitude of this feature by means of the dimensionless parameter , defined as the natural logarithm of the ratio between the actual flux emitted at µm and the flux value at the same wavelength interpolated between and µm:
| (13) |
In Fig. 9 we report the variation of the parameter as a function of the external to internal radial ratios and of the optical depth for a type-2 (left panel) and type-1 lines-of-sight (right panel). A homogeneous distribution of dust is assumed for models in the upper panels while in the lower panels the behaviour of non-constant density models is shown.
The strongest dependence of the silicate emission for type-2 viewing angles is on the optical depth, while the torus size plays a secondary role that becomes more important when a type-1 viewpoint is assumed. In the latter case the variations are much smoother and smaller torus sizes appear to be more sensitive to changes in optical depth. Hence, assuming a density profile that decreases towards the outer zones makes the interval of values more narrow with respect to a constant density profile, both in the type-2 and in the type-1 solutions. This is likely due to the fact that the silicate features in such models is more nested in high optical depth zones, and its presence is attenuated.
Models in which the silicate feature is absent or even measured in absorption for a polar (type-1) view are obtained with high values of the equatorial optical depth [ around ], smaller outer-to-inner radius ratio and . The amount of absorption increases as the exponent decreases, while positive values yield an almost featureless spectrum. Models with decreasing density at increasing angular distance from the equatorial plane always display the silicate feature in emission, as the hotter innermost regions where the silicate feature is stronger are less extinguished when the torus is seen face on. The intensity of the Silicate emission feature predicted by our model – thanks to the detailed description of the inner torus boundary where the feature is mainly produced – is moderate, and almost absent for (see Fig. 9 bottom-right panel).
3.3 Scaling properties of dust emission
Some considerations must be made in order to enable the derivation of various physical quantities for each source from the comparison of the model expectation with the observational data.
All models are computed assuming a luminosity of the primary power source of erg s-1. Both the intensity of dust emission and the torus sizes are strongly related to this value, as clearly indicated by Eq. 1 about the relationship between the mininum radius and the AGN luminosity. The problem is that of finding how the solutions of the radiative transfer equation depend on the primary power source luminosity and on the size of the emitting region, and how we can scale the spectral solutions from the assumed erg s-1 to the value required by the target source.
Rowan-Robinson (1980) notes that the radiative transfer problem has scaling properties that allow a reduction of the number of independent input parameters. These properties were first derived for spherical-shell geometries, but Ivezić & Elitzur (1997) showed that they are a general property of dust emission in any arbitrary geometry. They showed in particular that main pivotal parameter in the dust emission modelling is the overall optical depth. So, as long as the optical depth remains the same, the size of the system can be scaled up or down arbitrarily, without affecting the radiative transfer solution. Obviously, the scale size of the torus distribution determines the value of the dust mass.
Then, assuming a given value for the equatorial optical depth, if we change the source luminosity and size, we have the following scaling relations:
| (14) |
where is the torus radius and is the total dust mass. On the other hand, the torus luminosity is proportional to the grain number density and the grain emissivity , that is , where is the average grain mass. Altogether, total dust mass and torus luminosity scale in the same way, like the square of the linear size.
The mass of dust for a geometrical configuration of the torus is simply calculated as the sum of the mass of all the grains contained in each volume element, summed over all the elements of the grid. The mass of a dust grain is calculated from the typical density of the corresponding grain specie, by means of:
| (15) |
where the index is meant to represent grains with given size and is the mass density of the specie, which was assumed to be and gr/cm3 for graphite and silicate respectively (see e.g. Weingartner & Draine 2001).
To summarize, the parameters of the torus model include the torus opening angle , the ratio of the outer-to-inner radii, the coefficients and that enter the density function, and the equatorial optical depth measured at µm. Other parameters, like for example those describing the distribution function for the sizes of dust grains or their maximum and minimum values, were kept constant in order to avoid further complicating the problem.
A final quantity to consider is the torus viewing angle : apart from specific cases, we will henceforth assume that it is either for a polar view needed to represent type-1 AGN, or for an equatorial view needed for type-2 AGN.
4 Modeling the SED of Active Galactic Nuclei
In the present Section we exploit our AGN IR model to study the observed broad band SEDs of a variety of mostly nearby objects, known to host active nuclei, selected from the NASA/IPAC Extragalactic Database (NED). We confine the study to sources with numerous (at least ten independent) available photometric datapoints in order to ensure a good sampling of their SEDs.
A particularly interesting class of active galaxies are the Ultra-Luminous and Hyper-Luminous InfraRed Galaxies (ULIRGs and HyLIRGs, respectively). The studies of ULIRGs by IRAS and later by ISO often revealed the simultaneous presence of starburst and significant AGN dust components, whose respective contributions range from a small fraction up to the totality of the IR SED (e.g. Genzel et al. 1998; Verma et al. 2002; Berta et al. 2003; Prouton et al. 2004). The IR emission of a starburst typically peaks at wavelengths in the range between and µm (see e.g. Rowan-Robinson et al. 1984; Soifer et al. 1984), while the peak of AGN emission occurs at shorter wavelengths, somewhere between and µm. Hence, given the fact that AGN and starburst phenomena often happen concomitantly, and that in nearby AGN the host galaxy component can make an important contribution to the optical and near-IR spectrum, all three components have been included in our spectral modeling. For the cold dust component, the major contributor to the emission at wavelengths longer than µm, we chose to use starburst templates (see e.g. Farrah et al. 2003). More precisely, M82 represents a typical starburst IR emission while Arp 220 is adopted as representative of a very extinguished starburst. Additionally, NGC 1482, NGC 4102, NGC 5253 and NGC 7714, are used in order to widen the choice of spectral shapes. The main differences between these templates are the intensity of the PAH features (between and µm), the depth of the silicate feature at µm and the width, intensity and peak wavelength of the IR bump.
A more exhaustive approach would require to provide also a physical description of the starburst component (e.g. Efstathiou & Siebenmorgen 2005), which however is far beyond the scope of this work. Our simplified approach of using instead observational templates of local starbursts is in line with the current work aimed at modelling the AGN dusty tori and deriving values for the best-fit parameters from comparison with the data: as explained below, starburst templates are added only when a torus model fails to provide an acceptable description of the observational SED. Concerning the starburst contribution, it is mainly determined by the far-IR datapoints, predominantly from IRAS 60 and 100 µm measurements, which are prone to considerable uncertainities. For this component we limit our analysis to just an inference of the bolometric IR luminosity. Finally, the stellar component, when needed, is modelled using optical model spectra of ULIRGs in the wavelength range from to µm , as discussed by Berta et al. 2003 and Fritz et al. (in preparation). Note that we left free the relative normalization of this optical/near-IR component and the far-IR spectrum of the host galaxy, given the extremely complex physical relation of the two.
4.1 “Prototypical” sources
In order to demonstrate the accuracy and reliability of our spectral modelling, we have studied in some detail the observed SEDs and IR spectra of three well known nearby objects. One of the three objects, Mrk 231, was chosen because it represents a type-1 AGN-dominated ULIRG, while NGC 1068 was chosen as a prototype type-2 AGN-dominated source. The Circinus galaxy was finally considered as a composite object. All three are very well studied, given their proximity and brightness.
Spectroscopic data in the mid-IR from ISO (SWS) were available for the three sources, imposing strong constraints to the torus characteristics. For this reason we built other dedicated models with slightly different characteristics with respect to our reference grid (see Section 3.1), to try to fit both the observed photometry and the mid-IR spectrum.
4.1.1 The Circinus galaxy
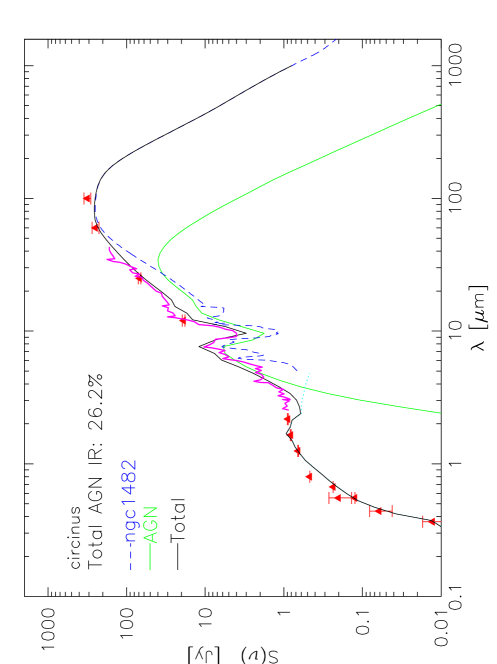
This very nearby ( Mpc) source displays characteristics typical of a Seyfert 2 object, like for example the very intense forbidden optical lines (Oliva et al., 1994) and a broad component of H emission (Oliva et al., 1998). Moreover, indications of current star formation activity close to the central region of this spiral galaxy come from near-IR observations (Maiolino et al., 1998) and from the extended morphology of the H emission (Elmouttie et al., 1998).
The photometric datapoints available for this source from the optical to the far-IR and the ISO SWS spectrum ( to µm; Moorwood et al. 1996, see Fig. 10) strongly constrain the AGN contribution. A large value for the equatorial optical depth [, corresponding to magnitudes] is required in order to depress dust emission between and µm to match the observed spectrum, and a small values for the torus size (internal and external boundaries of and pc, with an aperture angle of ) is indicated to reproduce the longer wavelength part of the spectrum. The estimated mass of torus dust is M⊙, a low value ensuing our small best-fit torus size.
Our torus model component has a flared disc geometry and its main features are quite similar to those suggested by Ruiz et al. (2001): small torus size (the parameter , where is the vertical size, is for this model) and a high visual extinction. The torus sizes of our solution are fairly consistent with their results. The most important difference concerns the relative staburst-AGN IR contribution: Ruiz et al. (2001) find this ratio to be close to unity, while Moorwood et al. (1996) estimate the per cent of the total IR luminosity to be ascribed to the AGN component. Our best-fit value for the AGN contribution is per cent, much closer to that proposed by Rowan-Robinson & Crawford (1989). Differences in the results might be due to aperture correction effects, since the AGN emission is concentrated in the inner galaxy bulge, while the starburst component is more extendend (Maiolino et al., 1998).
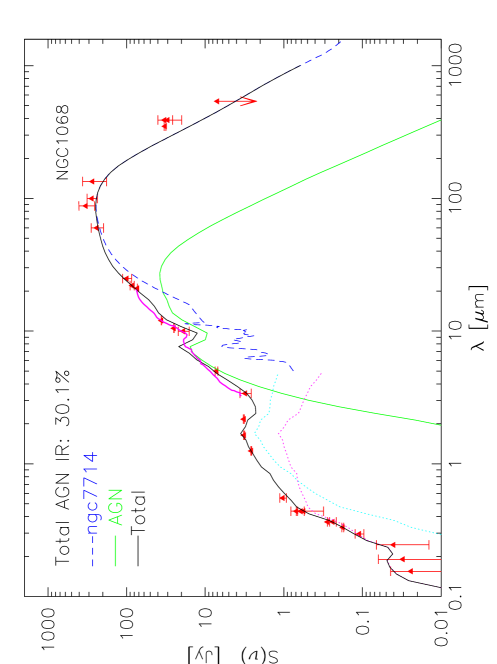
4.1.2 NGC 1068
NGC 1068 is a very well studied prototype Seyfert 2 galaxy and the first one against which the Unified AGN Model was tested (see e.g. Antonucci 1984 and Antonucci & Miller 1985). Among others, studies of the putative dusty torus in this source included the IR polarized imaging by Young et al. (1996), the modeling by Efstathiou et al. (1995), and recent mid-IR interferometric observations by (Jaffe et al., 2004) spatially resolving the dusty torus surrounding the active nucleus.
The torus model that better fits the data (see Fig. 11) is one with an outer-to-inner radial ratio of which, rescaled to fit the observed datapoints, gives a value of about pc for the external radius for a luminosity of erg s-1 of the central source. An optical depth of along the equatorial plane, together with a non-constant density profile ( and parameters for the densty law are and respectively), yield a silicate feature which is only slightly in absorption, as seen both in the observed SED and in the ISO spectrum. The derived optical extinction for such a configuration of the torus is , corresponding to a hydrogen column density of cm-2 and a total mass of dust of M⊙.
The colder component of dust emission is well reproduced by adding the contribution of the IR template of the starburst galaxy NGC 1482, contributing some per cent of the total IR luminosity. Our results on the AGN torus characteristics are in overall good agreement with previous studies, but indicate a larger torus than that inferred by the interferometric studies of Jaffe et al. (2004), who reveals the presence of dust at K in a structure of pc in diameter. Anyway, in the model adopted to reproduce NGC 1068 emission in the mid-infrared, the dust reaches such a temperature within a radius of pc. Considering that the density law in this particular case takes the form:
| (16) |
we can easily see that the dust density drops in such a way that at pc it is times lower than that at pc (radius reported by Jaffe et al. 2004). Our findings are, therefore, in marginal agreement with the obsevations.
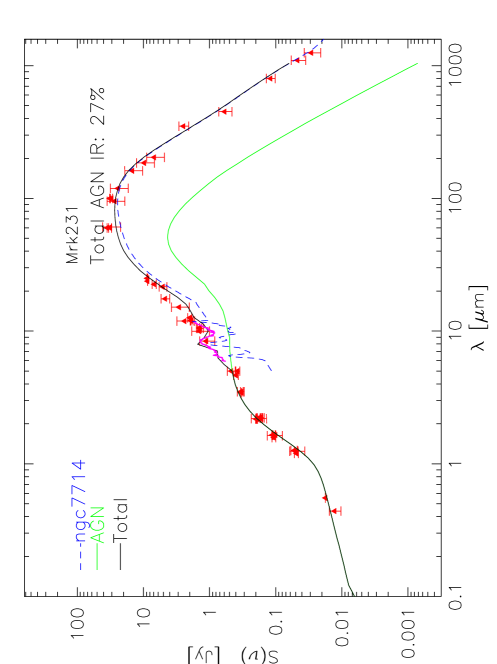
4.1.3 Mrk 231
This object is one of the most luminous ULIRGs in the local universe (Soifer et al., 1984), and also one of the most studied at all wavelength. Both ROSAT and ASCA observations found clear evidence of a starburst activity combined to that of the AGN (Imanishi & Ueno 1999; Turner 1999). The analysis based on Beppo-SAX and XMM-Newton performed by Braito et al. (2004) indicates the presence of a very thick screen with an hydrogen column density of cm-2 covering the primary X-ray emission.
The torus model is very strictly constrained by the observational data in the to µm interval. To reproduce the observed optical-to-IR SED (shown in Fig. 12) we need a direct view of the central power source. The observed SED requires an additional contribution by colder dust at µm, which we reproduce using the NGC 5253 IR SED.
The torus model has (corresponding to ) and a mass of dust confined in the molecular torus of about M⊙, and the torus aperture angle . Such a high value for the optical depth implies a hydrogen column density of cm-2, along the equatorial plane of the torus. The model AGN bolometric luminosity is erg s-1, corresponding to an outer radius of pc.
Our fit (whose parameters are summarized in Table 2) implies an AGN contribution to the IR flux of about per cent, two thirds of the emission being attributed to the host galaxy. This is consistent with the results by Braito et al. (2004), that found the starburst luminosity to be significantly higher than that of the AGN from a comparison of the X-ray and the bolometric flux and assuming a standard type-1 AGN emission.
4.2 Further Applications
In this Section we study the observed broad band SEDs of a sample of 40 type-1 Seyfert galaxies and quasars and 15 type-2 Seyferts, following the same procedure as in the previous Section but making use of our standard grid of models (see Section 3.1). The aim is to obtain information about physical properties of the circum-nuclear dust distributions in a sample of local AGNs, as well as on the relative contribution of the host galaxy.
In this exercise, we have taken particular care in selecting photometic measurements within homogeneous apertures, as much as possible. An example is given by our fit of the type-1 AGN NGC 7469 (Fig. 14), for which photometric data with an aperture including only the very central regions are used to constrain the intensity of the AGN component, while the total intensity fluxes include also the host galaxy contribution.
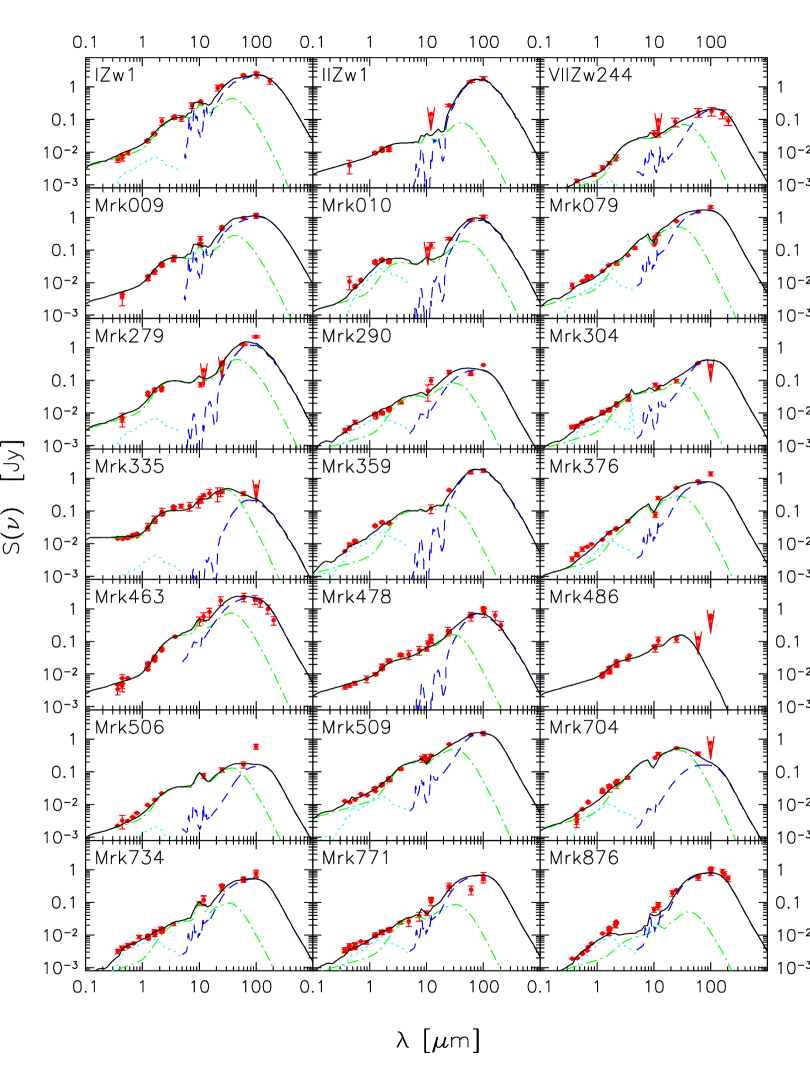
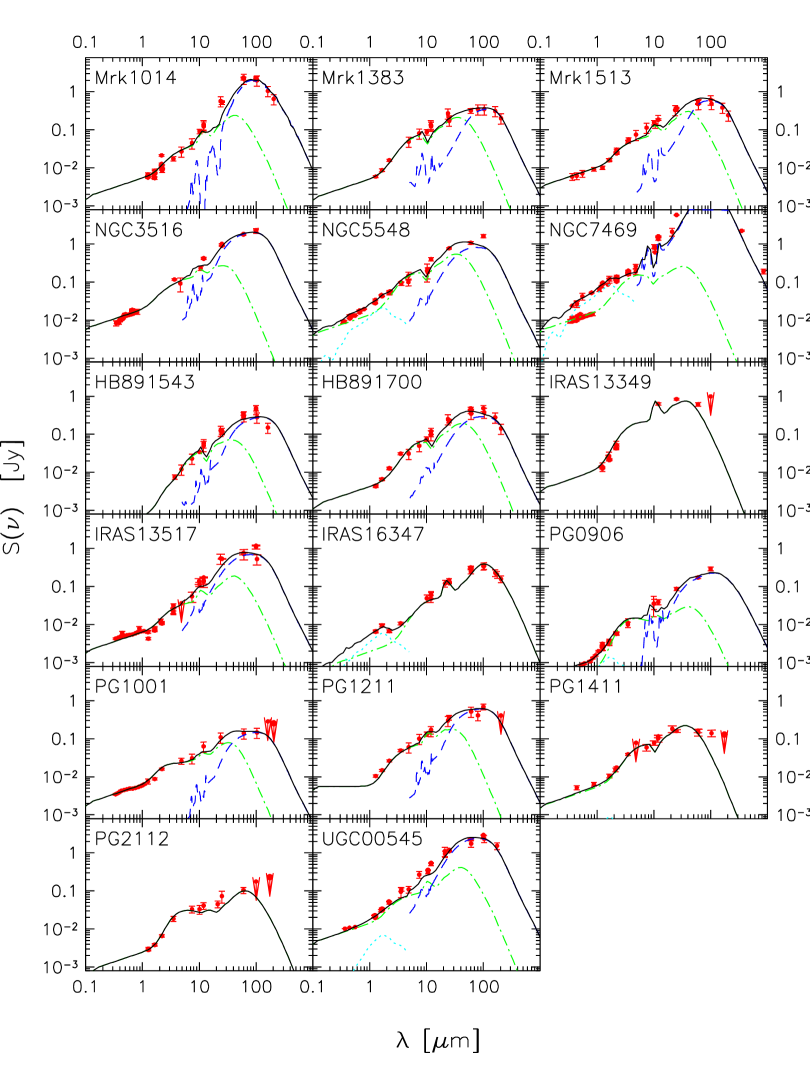
4.2.1 Type-1 AGN
A total of type-1 AGN and quasars, with a good coverage of photometric datapoints, have been fitted with a combination of stellar, IR starburst and AGN emissions. The objects were chosen from various AGN samples with the only requirement to have a sufficient number of observational datapoints. Our first attempt was to reproduce the whole optical-IR observed SEDs with a pure AGN emission, trying all models in the grid and assessing their merit with the test. For those objects with unacceptably large and obvious far-IR excess we added starburst and normal galaxy components in the far-IR and optical, respectively.
In all cases the combination of the three emission components reproduced well all the observed SEDs. Figs. 13 and 14 show the observed (red triangles) and model (black solid line) SEDs. The figures also report the various components of the model: the IR starburst and AGN contributions on blue dashed and green solid lines, respectively, while the stellar emission is shown as dotted lines.
| Obj | z | LAGN | Rmin | RMax | AV | NH | Mdust | AGN | |||||
|---|---|---|---|---|---|---|---|---|---|---|---|---|---|
| [erg s-1] | [pc] | [pc] | ∘ | [mag] | M⊙ | [%] | ∘ | ||||||
| 3C249.1 | 0.31120 | 100 | -1.0 | 6.0 | 72.2 | 0 | |||||||
| IRAS 13349 | 0.10764 | 140 | 0 | 0 | 100 | 0 | |||||||
| IRAS 13517 | 0.08820 | 100 | -1.0 | 6.0 | 29.6 | 20 | |||||||
| IRAS 16347 | 1.33400 | 140 | 0 | 0 | 100 | 20 | |||||||
| HB891543+489 | 0.40000 | 140 | -1 | 0 | 55.3 | 0 | |||||||
| HB891700+518 | 0.29200 | 140 | -1 | 0 | 68.1 | 0 | |||||||
| IZw1 | 0.06114 | 100 | 0 | 0 | 35.0 | 0 | |||||||
| IIZw1 | 0.05434 | 100 | -0.5 | 6.0 | 14.3 | 0 | |||||||
| VIIZw244 | 0.13100 | 140 | 0 | 0 | 76.2 | 0 | |||||||
| Mrk 009 | 0.03987 | 100 | -0.5 | 0 | 47.6 | 0 | |||||||
| Mrk 010 | 0.02925 | 100 | -0.5 | 0 | 53.3 | 0 | |||||||
| Mrk 079 | 0.02219 | 140 | -1 | 0 | 46.5 | 0 | |||||||
| Mrk 231 | 0.04217 | 140 | -0.5 | 0 | 27.5 | 0 | |||||||
| Mrk 279 | 0.03045 | 100 | -0.5 | 0 | 49.1 | 0 | |||||||
| Mrk 290 | 0.02958 | 140 | -0.5 | 0 | 53.8 | 0 | |||||||
| Mrk 304 | 0.06576 | 100 | -1.0 | 6.0 | 64.5 | 20 | |||||||
| Mrk 335 | 0.02578 | 100 | -0.5 | 6.0 | 88.3 | 0 | |||||||
| Mrk 359 | 0.01738 | 140 | 0 | 0 | 59.8 | 0 | |||||||
| Mrk 376 | 0.05598 | 140 | -1 | 0 | 57.6 | 0 | |||||||
| Mrk 463 | 0.05035 | 140 | 0 | 0 | 71.0 | 0 | |||||||
| Mrk 478 | 0.07905 | 100 | -1 | 6.0 | 50.8 | 0 | |||||||
| Mrk 486 | 0.03893 | 140 | -0.5 | 6.0 | 100 | 0 | |||||||
| Mrk 506 | 0.04303 | 100 | 0.0 | 0 | 86.4 | 0 | |||||||
| Mrk 509 | 0.03440 | 140 | -0.5 | 0 | 65.5 | 0 | |||||||
| Mrk 704 | 0.02923 | 140 | -1 | 0 | 90.0 | 0 | |||||||
| Mrk 734 | 0.02923 | 140 | 0 | 0 | 51.5 | 0 | |||||||
| Mrk 771 | 0.06301 | 140 | -0.5 | 0 | 41.9 | 0 | |||||||
| Mrk 876 | 0.12900 | 100 | -1 | 6.0 | 23.5 | 0 | |||||||
| Mrk 1014 | 0.16301 | 140 | -1 | 6.0 | 33.2 | 0 | |||||||
| Mrk 1383 | 0.08647 | 140 | -0.5 | 0 | 79.7 | 0 | |||||||
| Mrk 1513 | 0.06298 | 100 | -1 | 6.0 | 70.7 | 0 | |||||||
| NGC 3516 | 0.00884 | 100 | -1 | 6.0 | 32.8 | 0 | |||||||
| NGC 5548 | 0.01717 | 140 | -0.5 | 0 | 67.5 | 0 | |||||||
| NGC 7469 | 0.01632 | 100 | -1 | 0 | 8.8 | 0 | |||||||
| PG0804+761 | 0.09990 | 100 | -1.0 | 6.0 | 92.1 | 0 | |||||||
| PG0906+484 | 0.11800 | 100 | 0.0 | 0 | 28.7 | 0 | |||||||
| PG1001+054 | 0.16100 | 100 | -0.5 | 6.0 | 72.5 | 0 | |||||||
| PG1211+143 | 0.08090 | 100 | -1 | 6.0 | 63.8 | 0 | |||||||
| PG1411+442 | 0.08960 | 140 | -0.5 | 0 | 100 | 0 | |||||||
| PG2112+059 | 0.46600 | 100 | -0.5 | 0 | 100 | 0 | |||||||
| UGC00545 | 0.06114 | 100 | -1 | 6.0 | 29.5 | 0 |
Table 2 summarizes the physical parameters derived for the 41 type-1 AGN under investigation (including Mrk 231). In the order, the columns report the object name, redshift , the luminosity of the central power source, the inner and outer torus radii, the full-opening angle of the torus, the radial and angular dust density dependences (parameters and , respectively), the optical depth at µm, the extinction AV, the hydrogen column density NH, the mass of dust and the percentage contribution of the AGN to the IR bolometric emission. Note that , and are measured between the inner and the outer radius in the torus equatorial plane.
For the majority of the objects ( out of ), the contribution of the AGN torus to the total IR emission is larger than per cent. The SEDs of five objects in particular, Mrk 486, IRAS13349, IRAS16347, PG1411+442 and PG2112+059 can be entirely reproduced using a pure AGN model, fitting of their observed SED does not require significant cold dust emission.
As for the short-wavelength optical-UV part of the spectrum, there is a remarkable complementarity of the spectral shapes for the AGN and host galaxy: the local minima of one component correspond to the maxima of the other, including the µm emission/absorption. This coincidental fact allows us to assess with some precision the contribution by the host galaxies to optical spectrum. Quite often in these moderate luminosity Seyfert-1 galaxies the latter appears to be important (20 cases out of 40).
| Obj | z | LAGN | Rmin | RMax | AV | NH | Mdust | AGN | |||||
|---|---|---|---|---|---|---|---|---|---|---|---|---|---|
| [erg s-1] | [pc] | [pc] | ∘ | [mag] | M⊙ | [%] | ∘ | ||||||
| 05189-2524 | 0.04256 | 100 | -0.5 | 6.0 | 50.3 | 80 | |||||||
| BGC5506 | 0.00618 | 140 | 0 | 0 | 37.2 | 90 | |||||||
| Circinus | 0.00145 | 140 | -1 | 6.0 | 26.2 | 90 | |||||||
| Mrk 003 | 0.01351 | 140 | 0 | 0 | 70.5 | 30 | |||||||
| Mrk 078 | 0.03715 | 140 | -0.5 | 0 | 32.7 | 30 | |||||||
| Mrk 1066 | 0.01202 | 140 | -0.5 | 0 | 25.5 | 40 | |||||||
| Mrk 273 | 0.03778 | 140 | -1 | 6.0 | 5.8 | 90 | |||||||
| NGC 0262 | 0.01503 | 100 | -1 | 6.0 | 50.2 | 90 | |||||||
| NGC 1068 | 0.00379 | 160 | -1 | 6.0 | 30.1 | 70 | |||||||
| NGC 1365 | 0.00546 | 140 | 0 | 0 | 43.3 | 30 | |||||||
| NGC 1386 | 0.00289 | 140 | 0 | 0 | 39.2 | 90 | |||||||
| NGC 1614 | 0.01594 | 100 | -1 | 6.0 | 28.6 | 90 | |||||||
| NGC 2110 | 0.00779 | 100 | 0 | 0 | 32.9 | 90 | |||||||
| NGC 4507 | 0.01180 | 140 | 0 | 0 | 45.9 | 90 | |||||||
| NGC 5506 | 0.00618 | 100 | -1 | 6.0 | 36.9 | 80 | |||||||
| NGC 6240 | 0.02448 | 100 | -1 | 6.0 | 14.8 | 90 | |||||||
| NGC 7582 | 0.00525 | 100 | -1 | 6.0 | 50.3 | 90 |
Our model solutions for the type-1 objects in this sample tends to favour dust tori in which the density has a radial gradient: 32 of the 40 sample sources require a power-law density profile decreasing with radius (i.e. or ), and 6 of them also favour an angular dependence ().
Typical torus sizes are . Only for objects an outer radius barely above pc is indicated, with the exception of the highest redshift one, IRAS 16347+7037, that has a very luminous central source ( erg s-1) and whose external radius is found to be around kpc. As for the torus geometry, it is remarkable that the majority of our sample sources are well fitted by an high total aperture angle (), implying an high dust covering factor.
For the large majority of cases, the values of the mass of dust range from few tens to few tens of thousands solar masses, orders of magnitudes lower than the typical masses of supermassive black hole. Striking exception is again the mass of dust computed for IRAS 16347+7037 found to reach M⊙.
Most important, the best-fit values of the optical depth at µm were found to be larger than for almost all the objects, corresponding to visual extinction values larger than magnitudes and hydrogen column densities in the torus that must exceed cm-2.
4.2.2 Type-2 AGN
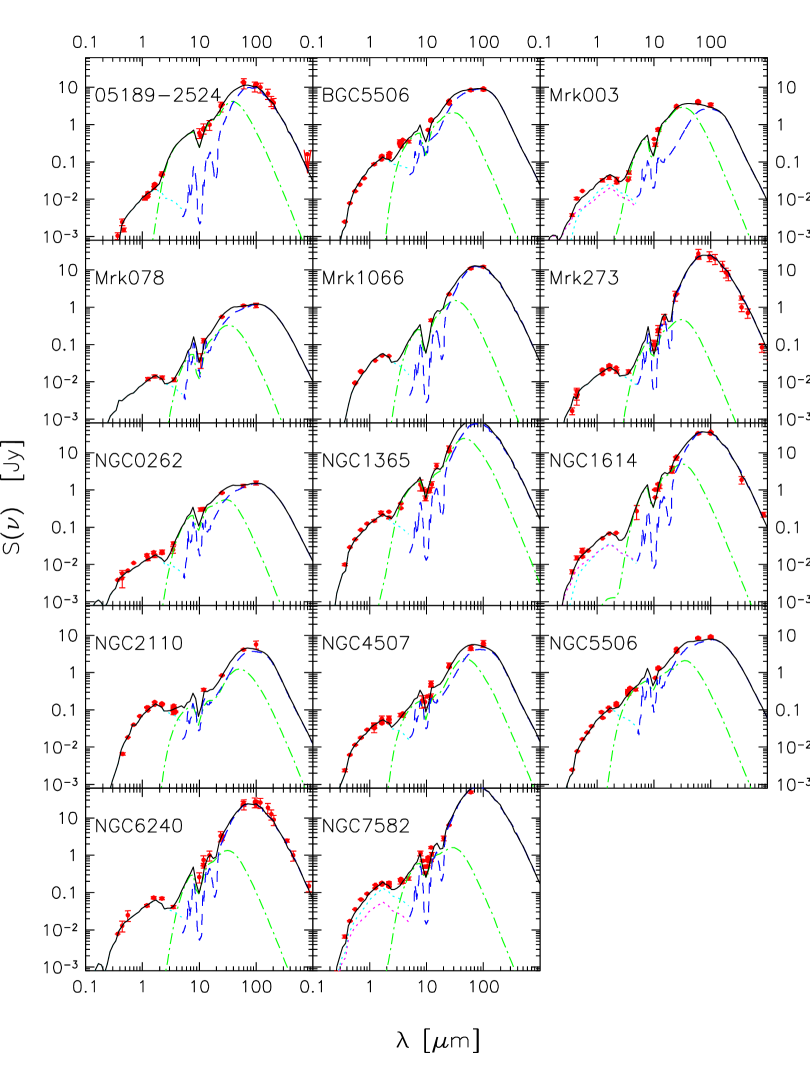
The same fitting procedure has been used to analyse the observed broad band SEDs of a small sample of 15 type-2 AGN. Table 3 summarizes the main best-fit parameters (including those for Circinus and NGC 1068). The results of our SED modelling (shown in Fig. 15) differ in some aspects from those for type-1 objects.
Again, all observed SEDs can be very well reproduced by combining stellar, starburst and AGN emission. Note that, in this case, the optical and near-IR emission is entirely due to the host galaxy’s stellar contribution, since the AGN emission is totally suppressed at wavelengths shorter than µm. None of the type-2 objects can be reproduced with torus emission alone: they all require a substantial starburst component. An Arp 220 starburst template better reproduced the far-IR data in eight out of cases.
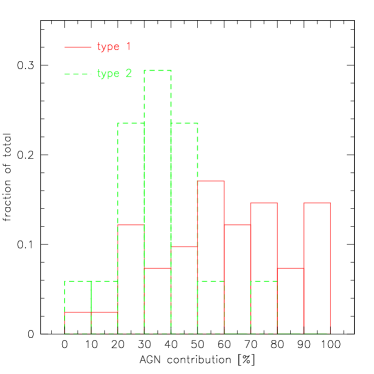
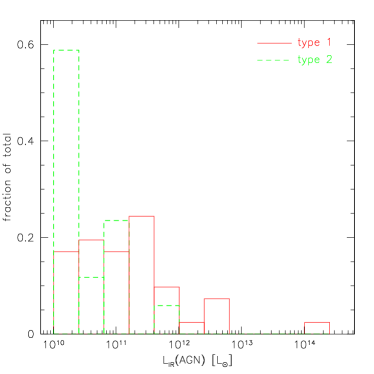
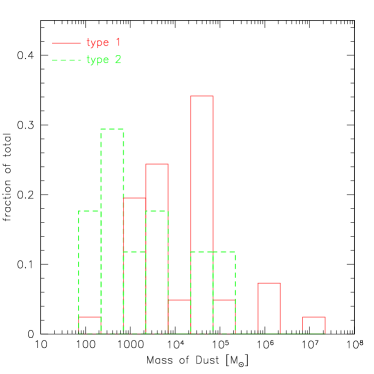
As shown in the left panel of Fig. 16, summarizing a comparison of our best-fit parameters for the two AGN populations, the average AGN contribution to the bolometric IR luminosity is lower than that estimated for the type-1 objects. We should caution, however, that the two subsamples are distributed quite differently in distance: the redshifts for the type-1 objects (appearing in the same Fig. 16) are typically higher than for the type-2, due to their easier spectroscopic identification. This bias obviously affects the bolometric AGN luminosity and dust torus mass (Fig. 17), while it is unclear at this stage how much it might influence the estimate of the AGN fractional contribution.
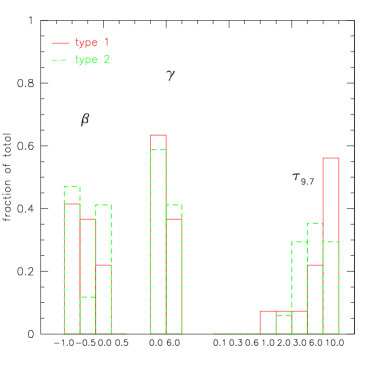
It is remarkable that, in spite of this bias, the distributions of the main physical and geometrical parameters for the two classes of AGN are fairly consistent, in particular the optical depth, with a median value of of for the type-2, while it is for the type-1 sample. In any case, the results should be seen with caution due to the in-homogeneity, incompleteness and random character of our sample.
 |
 |
 |
 |
5 DISCUSSION AND CONCLUSIONS
This work describes an improved model for the emission of dusty tori around AGN, including features already occasionally discussed in the literature and paying particular attention to an accurate computation of the radiative transfer solution. The chosen torus geometry is simple but realistic, a flared torus defined by its inner and outer radii and the total opening angle. We adopt the dust grain distribution of Mathis et al. (1977), with the density depending on the torus radial coordinate and polar angle. The optical depth is computed in great detail, taking into account the different sublimation temperatures for silicate and graphite grains.
The fact that grains with different sizes can have different sublimation temperatures may imply a significant complication, especially in the inner parts of the torus where the temperature of some dust grains can reach and exceed the sublimation limit. While this model accounts for the differences between graphite and silicate grains, we assume the sublimation temperature to be independent of the grain size. This follows Efstathiou & Rowan-Robinson (1994), who have shown that this effect is not of much importance especially for high densities and optical depths.
Our model is able to reproduce with remarkable accuracy the observed broad-band SEDs of a variety of AGN, for which large numbers of photometric measurements were available in the literature. For three well-known nearby active galaxies (Circinus, NGC 1068 and Mrk 231), the ISO mid-IR spectrum was also available, in which cases both the torus model and the starburst contributions were strongly constrained.
5.1 Spectral fitting of type-1 AGNs
A starburst component is usually required in order to fit the observed SED longward of µm, as in most cases a pure AGN component is unable to reproduce the observed width of the IR bump. From the objects of our sample, only four type-1 sources can be fitted by a pure AGN emission in the far-IR. The torus emission is in general predominant for such objects, while the starburst prevails in type-2 (see Fig. 16, left panel).
In this work we pay particular attention to the behaviour of the µm silicate feature, which in many previous publications was found to challenge the Unified Model (especially for type-1 objects). The problem was the prominence of the feature in absorption for type-2 AGN and its absence in type-1 objects, as viewed pole-on. This feature arises from dust situated in the innermost regions of the torus, as seen in Fig. 3, were the temperature is close to the sublimation limit. Moving far away from the center the feature becomes gradually fainter untill it eventually turns into absorption if the optical depth is high enough. Our current results show that a combination of high optical depth, moderate torus radius, an either constant density profile or one radially increasing toward the center, and a proper consideration of the lower sublimation temperature of silicate grains, reduces the silicate emission or even turns it into slight absorption. Under these assumptions, a standard composition of the mixture of dust turns out to be entirely compatible with low or no silicate emission in our model. The addition of a significant starburst contribution with the silicate feature in absorption tends to further decrease the prominence of the µm feature in type-1 AGN.
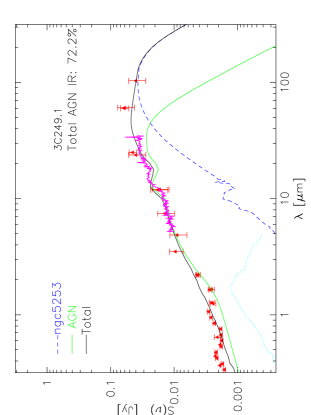
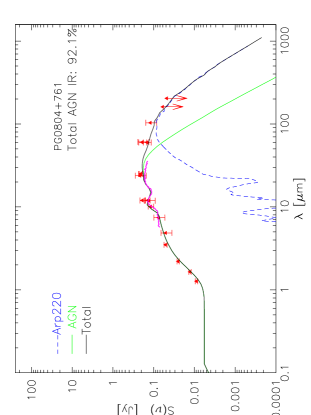
Recent observations with the Spitzer IR space telescope have revealed, for the first time, evidence for the silicate feature in moderate emission in a few type-1 AGN (Siebenmorgen et al. 2005; Hao et al. 2005), with values of the parameter close to unity. Indeed, the latter can be achieved with several combinations of our torus parameters (see Fig. 9). We present in Figs. 18 and 19 a detailed comparison of IR Spitzer spectra, together with SED data in the optical and far-IR, of two quasars-1 (3C249.1 and PG0804+761) with evidence for the µm feature in emission. We see that our model provides an excellent fit of the spectral shape and broad-band data for the latter source. As for the former, the spectrum is also well reproduced, except for a slight shift in wavelength probably due to a locally different grain mixture (Siebenmorgen et al., 2005). In conclusion, we find no need for particular geometries, like a tapered disc, or for modified distributions of the silicate grains (clumpy tori) in order to suppress the silicate feature in type-1 sources.
5.2 Torus geometry and the Unified Model
We now discuss results related to the Unified Scheme. Fig. 16 (right panel) illustrates the best-fit values of the parameters reproducing the observed SED of type-1 and type-2 AGN. Non-constant dust density profiles, in particular a density decreasing with the distance from the center, are clearly favored. Furthermore, high values for the equatorial optical depths are required in almost all the sources, particularly to suppress the µm emission. Interestingly, in agreement with the predictions of the Unified Scheme and despite the different average distances for the type-1 and type-2 samples, the distributions of the geometrical and physical torus parameters do not show significant variation between the two populations.
Also the distribution of values for the mass of dust in the torus and the luminosity of the primary power source presented in Fig. 17 do not show dramatic differences between type-1 and type-2. The slight tendency of type-1 objects to host more luminous AGN and more massive tori may be explained with the Malmquist bias introduced by the different average distances. More problematic is, instead, the interpretation of the higher fraction of the AGN contribution in type-1 sources, seen in Fig. 16 (left panel). It is unclear whether this is still due to a distance-induced bias, or if it is reflecting an intrinsic differentiation of the two populations.
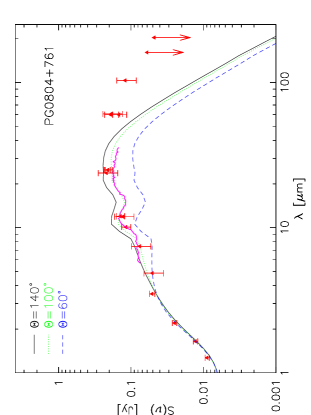
Obviously, not only the silicate feature, but more in general the observed mid-IR spectral shape can effectively constrain the intrinsic properties of the circum-nuclear dust distribution. An illustration of this is given in Fig. 20, showing how the spectrum changes by reducing the torus full-opening angle from to and : the reduced amount of cold dust close to for the 60∘ case makes the spectrum very flat in flux density units from 3 to µm, whereas a much steeper one is produced by our more standard value of .
A further important implication of our work is that, even accounting for important starburst contributions to the longer-wavelength far-IR part, our code was essentially unable to obtain good spectral fits to both AGN classes by assuming relatively flat tori with low values of the opening angle . Instead roughly half of the type-1 AGN and per cent of the type-2 require almost cylindrical tori with . For these, the corresponding covering factor is per cent, while the remaining sources are better fit with models, corresponding to percent covering factor.
Altogether the average covering factor for our local sample is close to percent: 4 to 5 obscured AGNs are then to be expected on average for each type-1 unobscured object (we predict very thick circum-nuclear material []). Since local and high-z AGN samples – including those selected in the IR (e.g. Rush et al. 1993; La Franca et al. 2004) or in radio (Lawrence 1991, but see also Maiolino 1995) – do not typically reveal such a high incidence of obscured objects, it remains that a large number of completely obscured AGN are to be expected, undistinguishable from normal galaxies if observed in the optical/near-IR or soft X-rays. This appears consistent with the results of Franceschini et al. (2005) from a deep combined Spitzer/Chandra survey. As discussed there (see also Maiolino et al. 2003; Gandhi et al. 2004; Fabian 2003), an important fraction of the obscured quasars and AGN may escape identification, even with a good coverage of the mid- and far-IR spectrum, as given by the Spitzer data, or deep hard X-ray data.
5.3 Model degeneracies
Inevitably, our solutions for the circum-nuclear dust structures in AGNs suffer some degree of degeneracy in the parameter space. In our case, the largest source of uncertainty is the limited spectral coverage, especially in the mid-IR. As already shown for the three proto-type objects analysed in Sects. 4.1.1, 4.1.2 and 4.1.3, the mid-IR spectrum turns out to be foundamental constraining the model parameters of AGN dust tori. The shape of the mid-IR ( µm) continuum is ruled by the optical depth and the characteristics of the density law, while the shape of the far-IR SED ( µm) is mainly determined by the torus size and the amount of cold dust.
In order to study the degree of degeneracy of our fits, a detailed case-study of the following three objects was performed: PG1411+442, as representative of type-1 objects with no evident starburst contribution, Mrk 1513 as a type-1 source with significant contribution from starburst emission in the IR, and NGC 1614 as a representative of the type-2 sources.
We have compared the observed SEDs for the three sources with all model spectra corresponding to the whole parameter set in Table 1, and then considered the solutions with a reduced below . The accretion luminosity turned out to be the best constrained quantity, especially in the type-1 sources where the primary continuum emission is observable. The scatter was found to be somewhat larger for the type-2 NGC 1614, in which case it varied between and erg/s, the higher values corresponding to model solutions with smaller torus opening angles.
The values of the outer radius were fairly constant for the best fit models in NGC 1614, but differed by up to a factor of 3 in the case of PG1411+442 (both and gave acceptable fits).
Similar results were obtained for the mass of dust. The most extreme case was again PG1411+442, with a variation by up to a factor of 4, as a consequence of the variation. On the other hand, the parameters of the dust density law (equatorial optical depth and the coefficients and of the density law) were found to only slightly vary among the best fits. The starburst template that better fitted the objects was Arp 220 and was kept fixed as no acceptable fits could be obtained with other templates.
In conclusion, the available data are not so detailed to allow resolution of all degeneracies in the torus parameters, which we may understand if we consider the complexity of the objects under scrutiny and the fact that the torus and starburst emissions overlap smoothly in the far-IR. However, our analysis has shown that significant constraints can be achieved about the characteristics of the circum-nuclear dust distributions in AGNs.
ACKNOWLEDGEMENTS
We want to thank Ralph Siebenmorgen for providing us with the Spitzer Spectrum of 3C249.1.
This research makes use of the NASA/IPAC Extragalactic Database (NED) which is operated by the Jet Propulsion Laboratory, California Institute of Technology, under contract with the National Aeronautics and Space Administration.
This work was supported in part by the Spanish Ministerio de Ciencia y Tecnologia (Grants Nr. PB1998-0409-C02-01 and ESP2002-03716) and by the EC network ”POE” (Grant Nr. HPRN-CT-2000-00138).
References
- Antonucci (1984) Antonucci R.R.J. 1984, ApJ, 278, 499
- Antonucci & Miller (1985) Antonucci R.R.J., & Miller J.S. 1985, ApJ, 297, 621
- Barvainis (1987) Barvainis R. 1987, ApJ, 320, 537
- Berta et al. (2003) Berta S., Fritz J., Franceschini A., Bressan A., & Pernechele C. 2003, A&A, 403, 119
- Braito et al. (2004) Braito V., et al. 2004, A&A, 420, 79
- Draine & Lee (1984) Draine B.T., & Lee H. M. 1984, ApJ, 285, 89
- Dullemond & van Bemmel (2005) Dullemond C.P., & van Bemmel I.M. 2005, A&A, 436, 47
- Efstathiou & Rowan-Robinson (1994) Efstathiou A., & Rowan-Robinson M. 1994, MNRAS, 266, 212
- Efstathiou & Rowan-Robinson (1995) Efstathiou A., & Rowan-Robinson M. 1995, MNRAS, 273, 649
- Efstathiou et al. (1995) Efstathiou A., Hough J.H., & Young S. 1995, MNRAS, 277, 1134
- Efstathiou & Siebenmorgen (2005) Efstathiou A., & Siebenmorgen R. 2005, A&A, 439, 85
- Elmouttie et al. (1998) Elmouttie M., Koribalski B., Gordon S., Taylor K., Houghton S., Lavezzi T., Haynes R., & Jones K. 1998, MNRAS, 297, 49
- Fabian (2003) Fabian A.C., 2003, in ”Coevolution of Black Holes and Galaxies”, Carnegie Observatories Astrophysics Series, Vol. 1, ed. L. C. Ho (Cambridge: Cambridge Univ. Press)
- Farrah et al. (2003) Farrah D., Afonso J., Efstathiou A., Rowan-Robinson M., Fox M., & Clements D. 2003, MNRAS, 343, 585
- Franceschini et al. (2005) Franceschini A., et al. 2005, AJ, 129, 2074
- Gandhi et al. (2004) Gandhi P., Crawford C.S., Fabian A.C., Johnstone R.M., 2004, MNRAS348, 529
- Genzel et al. (1998) Genzel R., et al. 1998, ApJ, 498, 579
- Granato & Danese (1994) Granato G.L., & Danese L. 1994, MNRAS, 268, 235
- Imanishi & Ueno (1999) Imanishi M., & Ueno S. 1999, ApJ, 527, 709
- Ivezić & Elitzur (1997) Ivezić Ž., & Elitzur M. 1997, MNRAS, 287, 799
- Jaffe et al. (2004) Jaffe W., et al., 2004, Nature, 429, L47
- Hao et al. (2005) Hao L., et al. 2005, ApJL, 625, L75
- La Franca et al. (2004) La Franca F., et al. 2004, AJ, 127, 3075
- Laor & Draine (1993) Laor A., & Draine B.T. 1993, ApJ, 402, 441
- Lawrence (1991) Lawrence A. 1991, MNRAS, 252, 586
- Maiolino (1995) Maiolino R., & Rieke G., 1995, ApJ454, 95
- Maiolino et al. (1998) Maiolino R., Krabbe A., Thatte N., & Genzel R. 1998, ApJ, 493, 650
- Maiolino et al. (2003) Maiolino R., et al., 2003, MNRAS344, L59
- Manske et al. (1998) Manske V., Henning T., & Men’shchikov A.B. 1998, A&A, 331, 52
- Mathis et al. (1977) Mathis J.S., Rumpl W., & Nordsieck K.H. 1977, ApJ, 217, 425
- Mihalas (1978) Mihalas D. 1978, San Francisco, W.H. Freeman and Co., 1978, p. 650
- Moorwood et al. (1996) Moorwood A.F.M., Lutz D., Oliva E., Marconi A., Netzer H., Genzel R., Sturm E., & de Graauw T. 1996, A&A, 315, L109
- Nenkova et al. (2002) Nenkova M., Ivezić Ž., & Elitzur M. 2002, ApJL, 570, L9
- Nenkova et al. (1999) Nenkova M., Ivezić Ž., & Elitzur M. 1999, LPI Contribution No. 969, 20
- Neugebauer et al. (1979) Neugebauer G., Oke J.B., Becklin E.E., & Matthews K. 1979, ApJ, 230, 79
- Oliva et al. (1994) Oliva E., Salvati M., Moorwood A.F.M., & Marconi A. 1994, A&A, 288, 457
- Oliva et al. (1998) Oliva E., Marconi A., Cimatti A., & Alighieri S. D. 1998, A&A, 329, L21
- Pier & Krolik (1992) Pier E.A., & Krolik J.H. 1992, ApJ, 401, 99
- Rybicki & Lightman (1979) Rybicki G.B., & Lightman A.P. 1979, New York, Wiley-Interscience, p. 393
- Prouton et al. (2004) Prouton O.R., Bressan A., Clemens M., Franceschini A., Granato G.L., & Silva L. 2004, A&A, 421, 115
- Rowan-Robinson (1980) Rowan-Robinson M. 1980, ApJS, 44, 403
- Rowan-Robinson et al. (1984) Rowan-Robinson M., et al. 1984, ApJ, 278, L7
- Rowan-Robinson & Crawford (1989) Rowan-Robinson M., & Crawford J. 1989, MNRAS, 238, 523
- Rowan-Robinson (1992) Rowan-Robinson M. 1992, MNRAS, 258, 787
- Ruiz et al. (2001) Ruiz M., Efstathiou A., Alexander D. M., & Hough J. 2001, MNRAS, 325, 995
- Rush et al. (1993) Rush B., Malkan M.A., Spinoglio L., 1993, ApJS, 89, 1
- Siebenmorgen et al. (2005) Siebenmorgen R., Haas M., Krügel E., & Schulz B., 2005, A&A, 436, L5
- Soifer et al. (1984) Soifer B.T., et al. 1984, ApJL, 278, L71
- Stenholm (1994) Stenholm L. 1994, A&A, 290, 393
- Turner (1999) Turner T.J. 1999, ApJ, 511, 142
- van Bemmel & Dullemond (2003) van Bemmel I.M., & Dullemond C.P. 2003, A&A, 404, 1
- Verma et al. (2002) Verma A., et al. 2002, MNRAS, 335, 574
- Weingartner & Draine (2001) Weingartner J.C., & Draine B.T. 2001, ApJ, 548, 296
- Young et al. (1996) Young S., Packham C., Hough J. H., & Efstathiou A. 1996, MNRAS, 283, L1