Status of the XMM-Newton cross-calibration with SASv6.5.0
Abstract
Further achievements of the XMM-Newton cross-calibration — XMM internal as well as with other X-ray missions — are presented. We explain the major changes in the new version SASv6.5 of the XMM-Newton science analysis system. The current status of the cross-calibration of the three EPIC cameras is shown. Using a large sample of blazars, the pn energy redistribution at low energy could be further calibrated, correcting the overestimation of fluxes in the lowest energy regime. In the central CCDs of the MOSs, patches were identified at the bore-sight positions, leading to an underestimation of the low energy fluxes. The further improvement in the understanding of the cameras resulted in a good agreement of the EPIC instruments down to lowest energies. The latest release of the SAS software package already includes corrections for both effects as shown in several examples of different types of sources. Finally the XMM internal cross-calibration is completed by the presentation of the current cross-calibration status between EPIC and RGS instruments. Major efforts have been made in cross-calibrations with other X-ray missions, most importantly with Chandra, of course, but also with currently observing satellites like Swift.
keywords:
XMM-Newton, SASv6.5, calibration1 Major changes from SASv6.1 to SASv6.5
1.1 MOS responses now time and spatial dependent
The major change from SASv6.1 to SASv6.5 is the new response generation in rmfgen for the EPIC MOS instruments. Using SASv6.1 it has been found that, starting at about rev. 380 and increasing mission duration, pn and MOS measurements diverge at low energies for most observations. Using supernova remnants, a spatial dependency of this low energy discrepancy was discovered. Further investigations reveal a change in the MOS distribution behaviour at and close to the nominal bore-sight positions (Fig. 1), whereas the redistribution outside these regions does not show any change. These spatial dependency indicate that X-ray and/or focused particle radiation changed the physical performance of the CCDs.
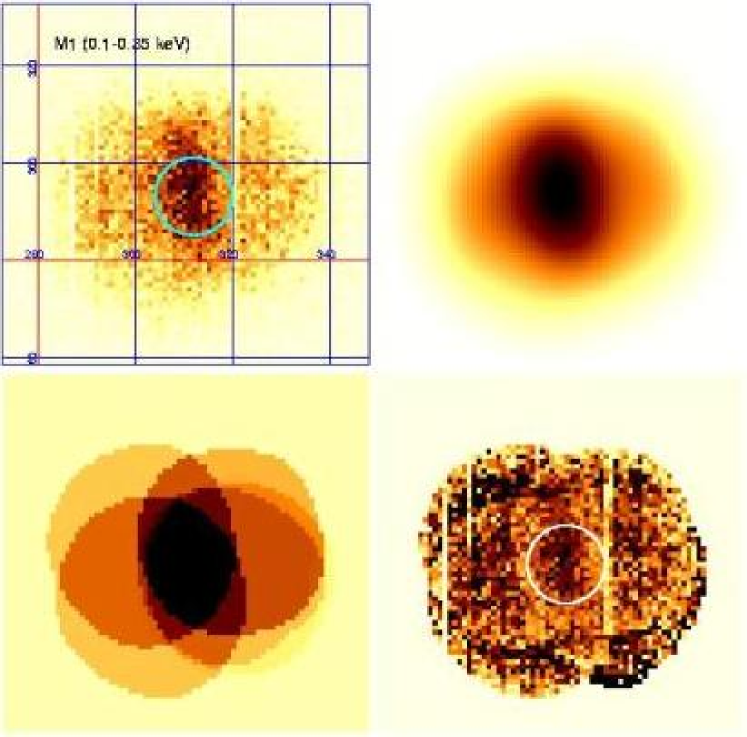
The new MOS response generation takes into account three time dependent regions and calculates the response according to the selected source region. Using SASv6.5 the previously found low energy discrepancy, evolving with time, is corrected. Examples are provided in sect. 3. A more detailed description is provided in the conference contribution of A.M. Read et al.: ’Patching’ EPIC-MOS: Temporal and Spatial Dependency of the Detector Response.
Together with the SASv6.5 and its new MOS response generation, a new set of 18 CCF-files has been published, for nine time epochs now modelling the spatial dependency by three regions for the central CCDs. Warning: Using SASv6.1 together with the new set of CCF-files, rmfgen could create responses with strange features.
1.2 Improvement of arfgen
Since revolution 961 a new hot column has appeared on MOS1 CCD1 due to an impact of a micrometeorite dust particle on MOS1 CCD1. This new defect is leaking into the whole column. As a consequence, the offset of this column is raised by about 20 ADUs, therefore generating a lot of noise events at low energy above the low energy threshold, and the whole column is identified as bad by embadpixfind and masked out in the calibrated event list. As this column passes a few pixels from the nominal target position on CCD1, a significant fraction of the on-axis source PSF is affected. If the selection #XMMEA_EM to the MOS event list is applied to generate spectra of on-axis sources, only the bad column is marked bad but not the adjacent columns. This missing column is taken into account by arfgen in the computation of the effective area.
If the more conservative selection flag FLAG==0 is used for the analysis, also the two adjacent columns are masked, therefore 3 columns are removed, causing the loss of up to 10-15% of the flux of an on-axis source. The SASv6.1 did not take into account these adjacent missing columns in the computation of the effective area. Therefore the absolute flux/normalisation of a source was too low. The new arfgen version of SASv6.5 now takes into account these adjacent missing columns.
1.3 Improvement of embadpixfind
In SASv6.1, the two MOS pipeline tasks emproc and emchain used different routines to search for bad pixels. The first used the general task badpixfind, whereas the latter used the more advanced, to the MOS data reduction adapted task embadpixfind. Thus, the resulting MOS eventlists of both pipelines could differ distinctly. In SASv6.5, both pipeline tasks are using the embadpixfind routine to detect bad pixels and the resulting event lists of both pipeline tasks are completely equivalent now.
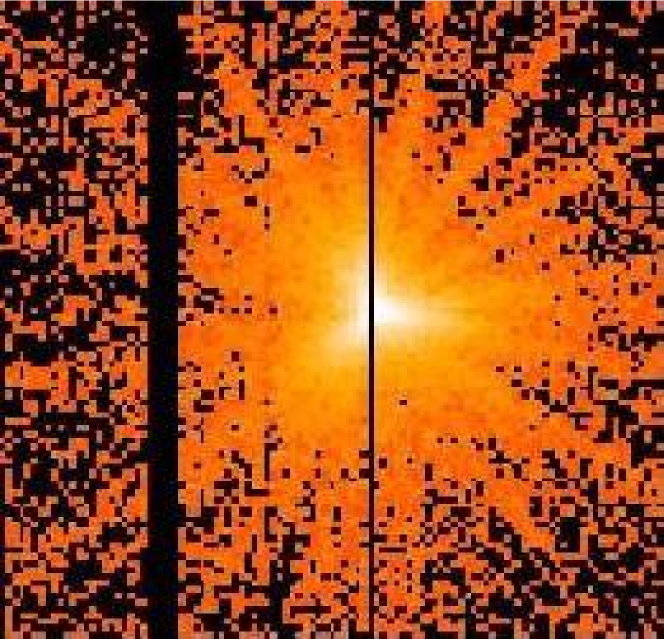
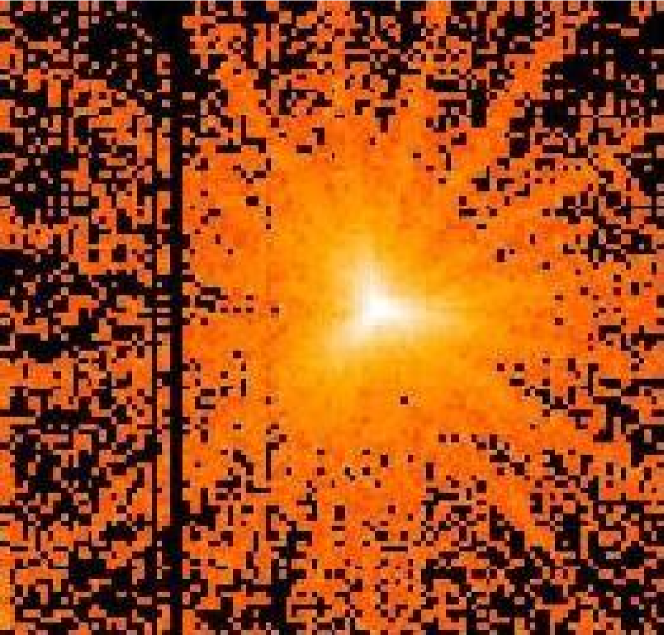
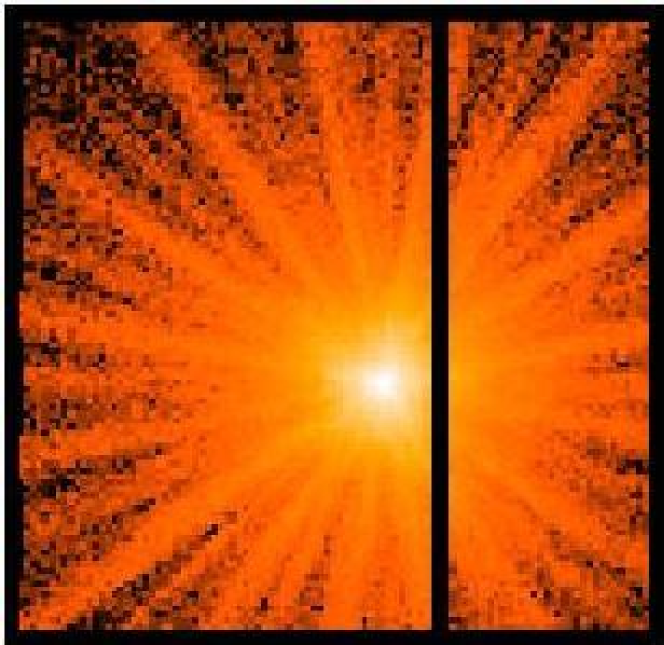
Due to offset variations from column to column, the previous version of embadpixfind, in rare cases, could remove single columns by flagging them bad erroneously (Fig. 3, top). In specific observations, the central pixel of the PSF could be marked as a bad pixel and removed from the event list. A new rejection algorithm prevents erroneous identifications of bad columns and pixels (Fig. 3, bottom).
2 Effect of new pn redistribution: Low energy improvement
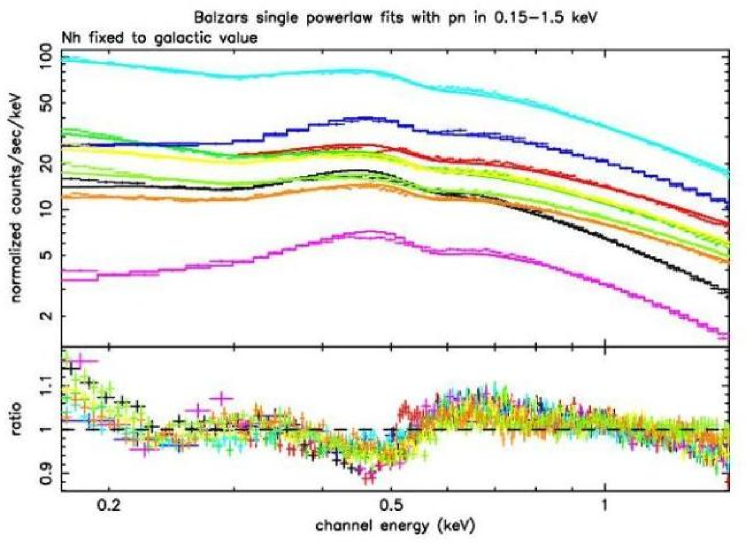
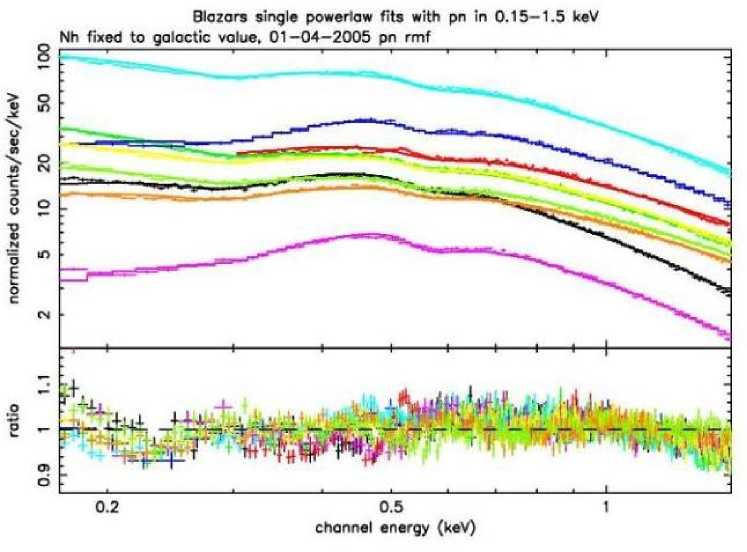
X-ray spectra of blazars are expected to show a featureless continuum. Spectral fits of a set of blazars show common systematic s-shape pn residuals at the low energy end of the pn best fits (Fig. 4). Using this set of blazars, the pn redistribution has been optimised and already published via a CCF-file in 2005 May.
3 Examples for different epochs
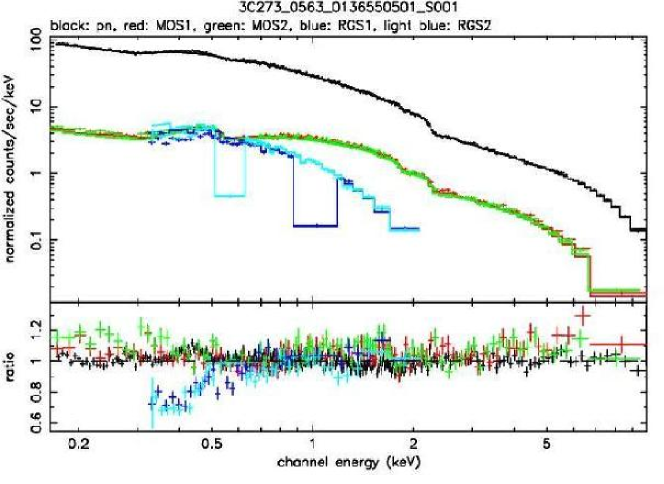
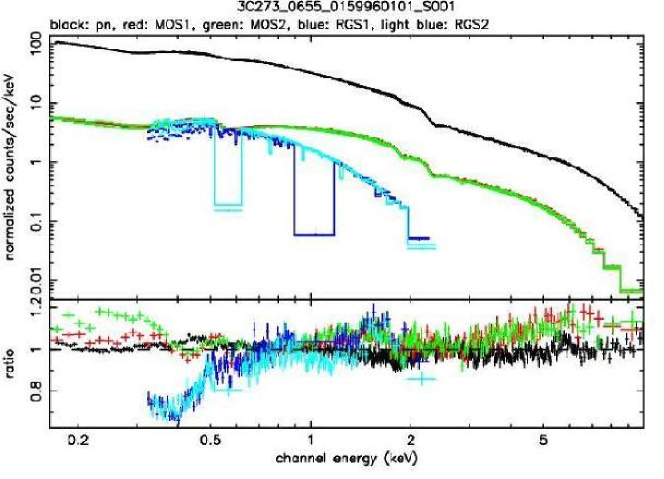
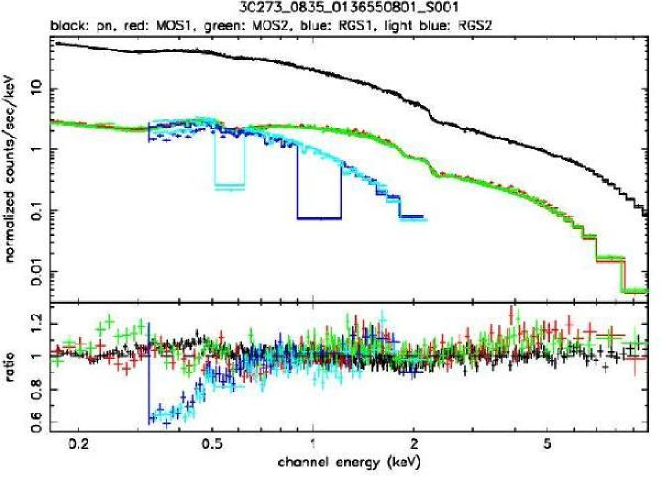
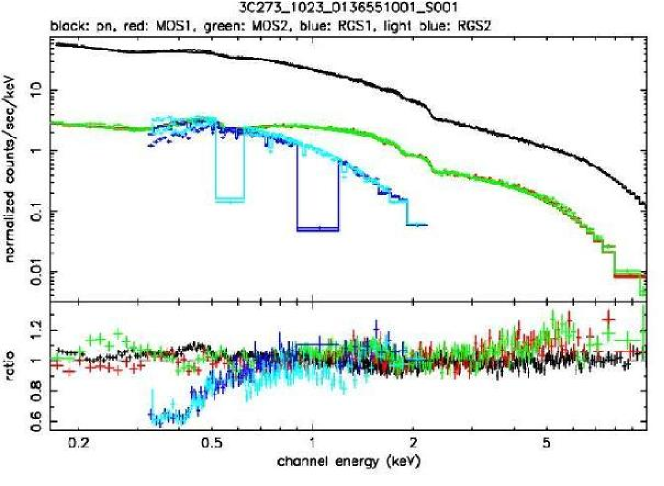
The effect of the new MOS response generation with its time and now spatial dependency is presented using two sources, the quasar 3C 273 as a continuum source example, and 1ES0102-7219 as a coronal source example.
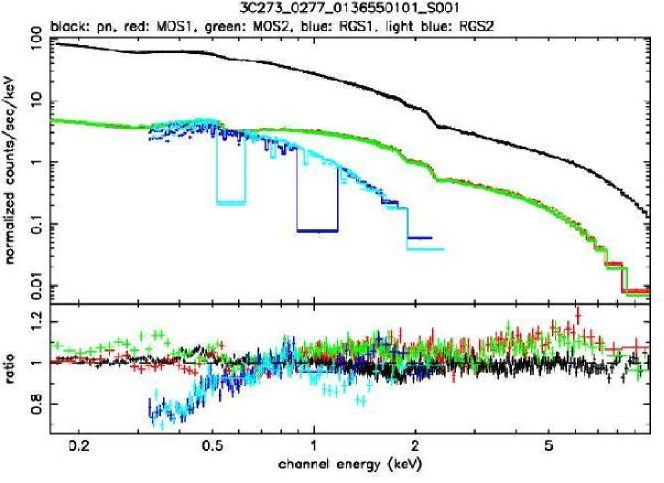
All 3C 273 observations presented in Fig. 6 were performed in the EPIC small window modes and the medium filters. As fit model, a double power law model with galactic absorption is used. The 3C 273 series show a good agreement of all EPIC instruments at all epochs. The time dependent low energy discrepancy, increasing with time, is solved by the new MOS responses. At low energies below 0.8 keV, the RGS and EPIC still disagree. The spectral summary of the 3C 273 series is:
-
•
pn bump up to 10% between 0.4-0.5 keV
-
•
MOS2 bump up to 20% at 0.2-0.4 keV
-
•
Above about 5 keV, pn is lower than MOS by 10%
-
•
RGS decrease by 10-20% at lowest energies during the mission.
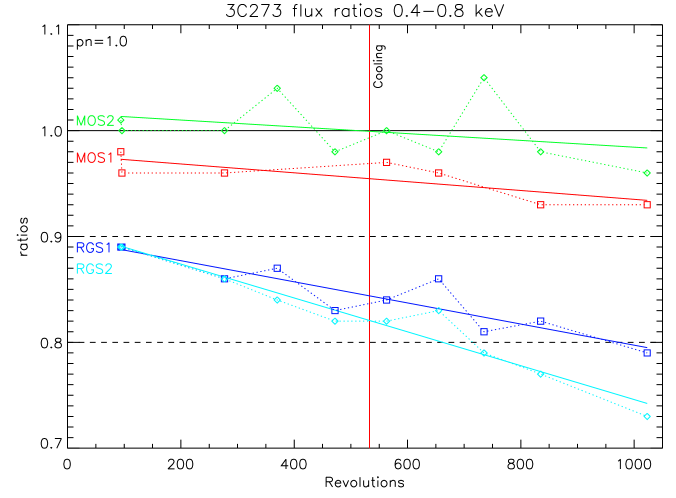
The low energy (0.4-0.8 keV) flux stability using 3C 273 is presented in Fig. 5 with pn flux refered to one. The MOS to pn ratios decrease by less than 5% over the mission, the RGS ratios decrease by 10-20%.
All observations of 1ES0102-7219 presented in Fig. 7 were performed in small window mode for pn and the large window modes for MOS. In rev. 375, 521 and 981 the thin filters were used, in rev. 888 the thick filter was used for all EPICs. For pn small window mode, the background correction is difficult due to the small size of the CCD window, whereas for the MOS the background could be taken from the outer CCDs. The fit model includes 40 lines plus absorbed bremsstrahlung. The line energies were fixed to laboratory values and the widths are determined by RGS.
The 1ES0102-7219 series show that the pn response underestimates redistribution, most evident the O-lines. Above about 0.6 keV, the agreement between RGS and EPICs is good. For later epochs, the decrease of the RGS low energy flux become evident again, hence the combined fits are unreliable at low energies. In rev. 888, the thick filter measurement, large pn-MOS discrepancies are present below 0.5 keV.
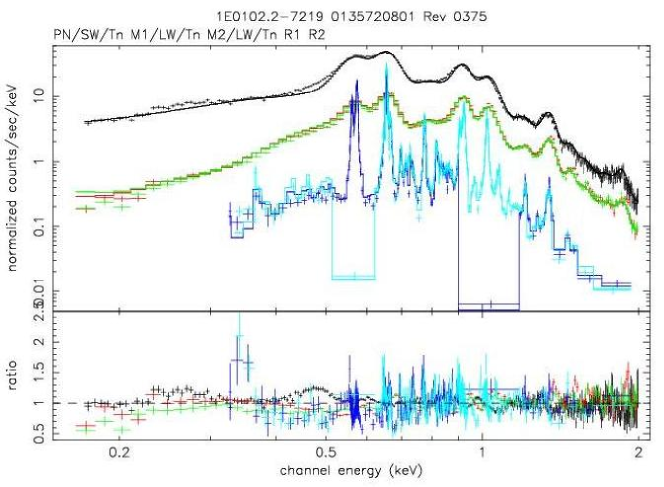
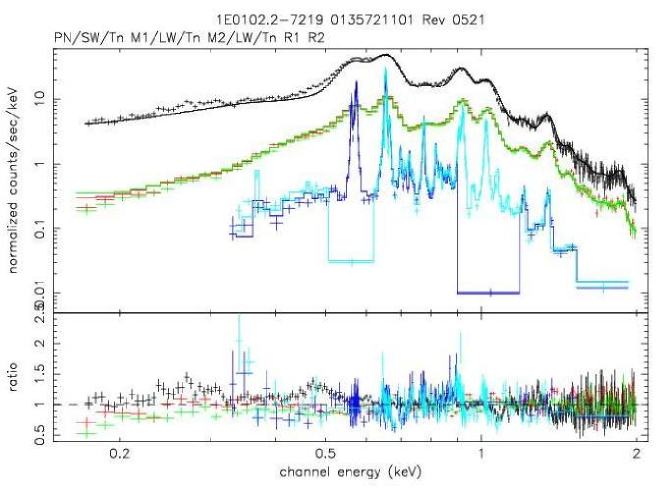
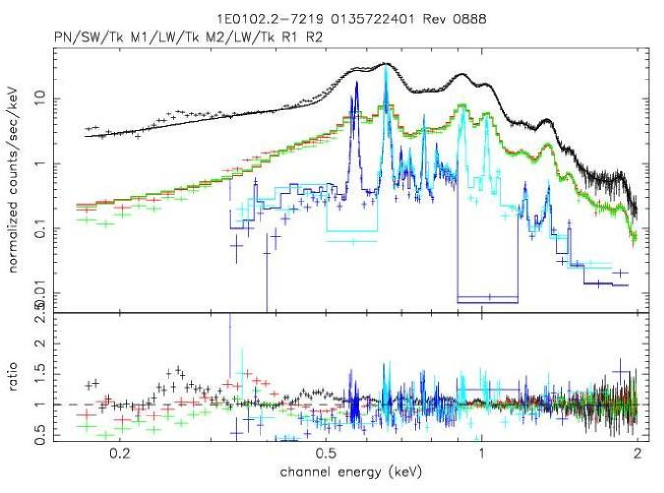
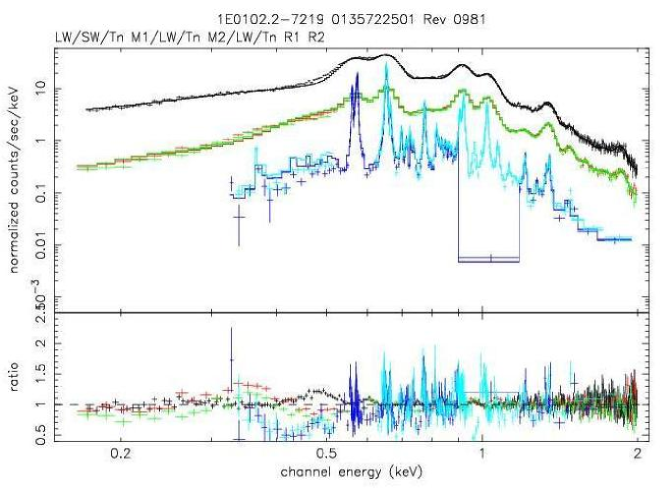
The problem is thought to be not related to the filter model but to the redistrubution at small count statistics.
4 Examples of other sources
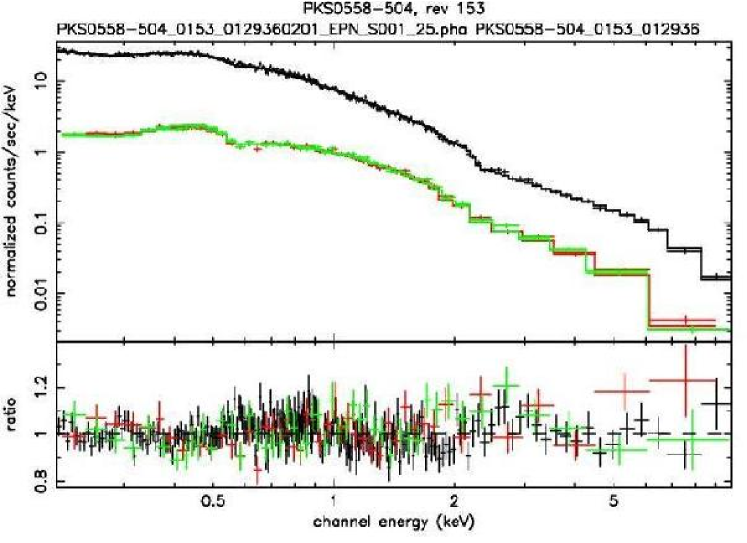
In this section we present examples of different sources at different epochs. PKS0558-504 (Fig. 8) was observed in rev. 153, an epoch before the MOS patch was present. The pn was in small window mode, MOS in large window mode. All EPICs used the thin filter. This observation is an example of a perfect agreement between all EPIC instruments.
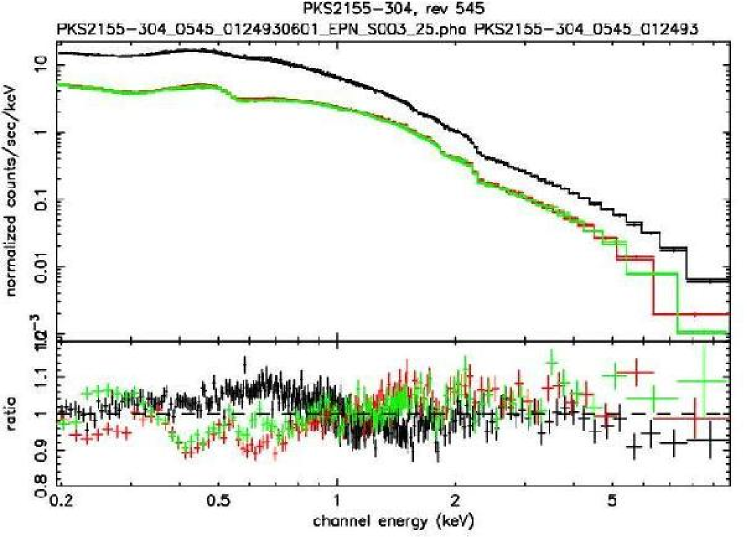
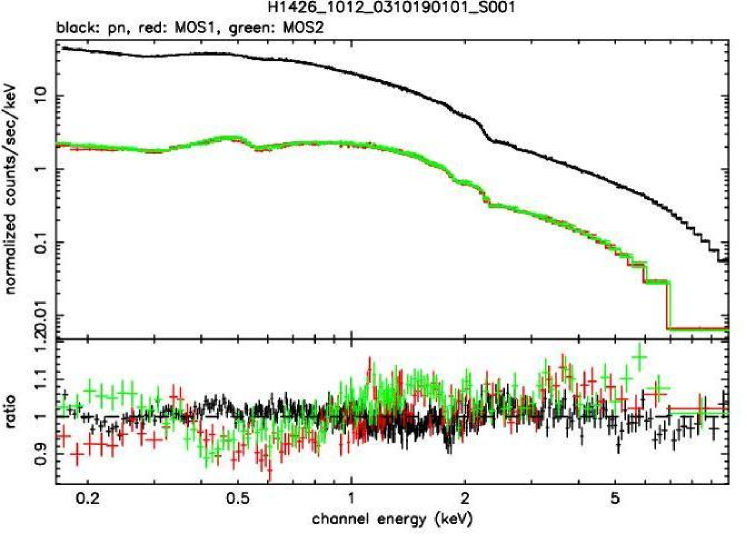
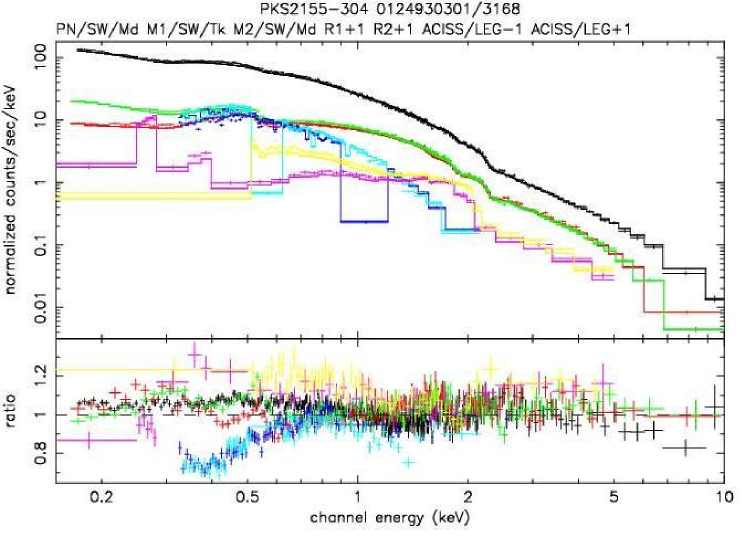
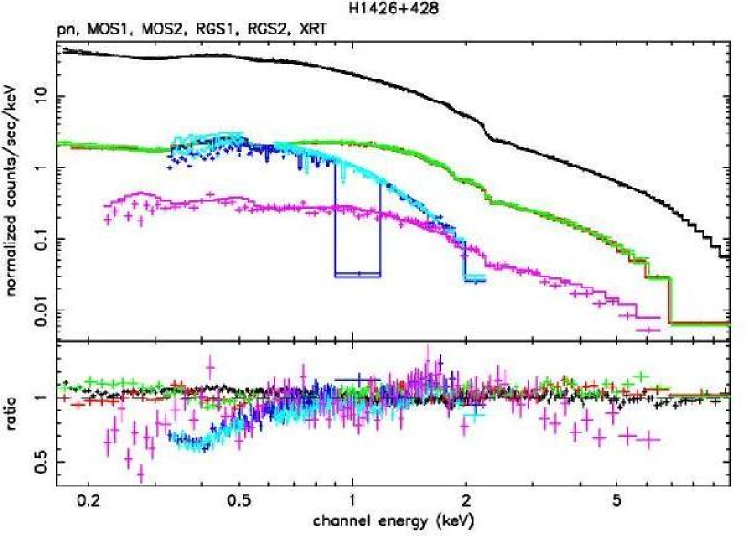
At the PKS2155-304 observation in rev. 545 (Fig. 9) and for H1426+428 in rev. 1012 (Fig. 10), the MOS patch was present. Both observations used the EPIC small window modes with the medium filter. The spectra show a good general agreement for the total energy range. The largest discrepancies are present between 0.4-0.8 keV, where the MOS are lower than pn by 10-15%. Above 5 kev, the pn is lower than the MOS by up to 10%.
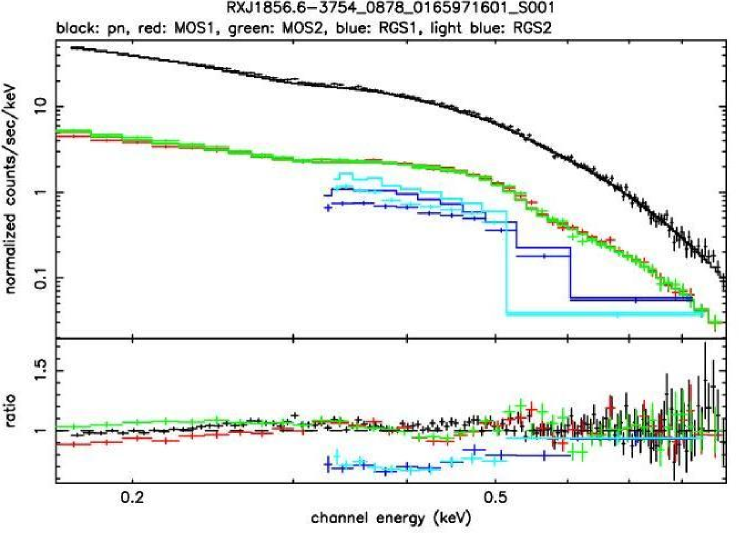
The isolated neutron star RXJ1856-3754 has been observed in rev. 427, 878 and 968 using pn small window mode and the thin filter. The flux variations were less than 1%, proving the low energy stability of the EPIC pn. With SASv6.1, the absorption column was fitted to zero for pn. Using the new CCFs published 2005 May, the NH is not disappearing any more, even if the fitted value is lower than the value obtained from the deep Chandra observation. Fig. 11 presents the rev. 878 observation with all EPICs in small window mode and thin filters. MOS and pn agree within 10% down to lowest energies.
5 XMM-Newton versus Chandra
The first example presents a simultaneous observation of PKS2155-304 observation in rev. 362 (Fig. 12). The general spectral shape measured by XMM-Newton EPIC and Chandra ACIS/LETG above about 1 keV agrees well, with Chandra normalisations being higher than the EPIC ones. Below 1 keV and compared to EPIC, the ACIS/LETG residuals increase to lower energies whereas the RGS residuals decrease by about the same level.
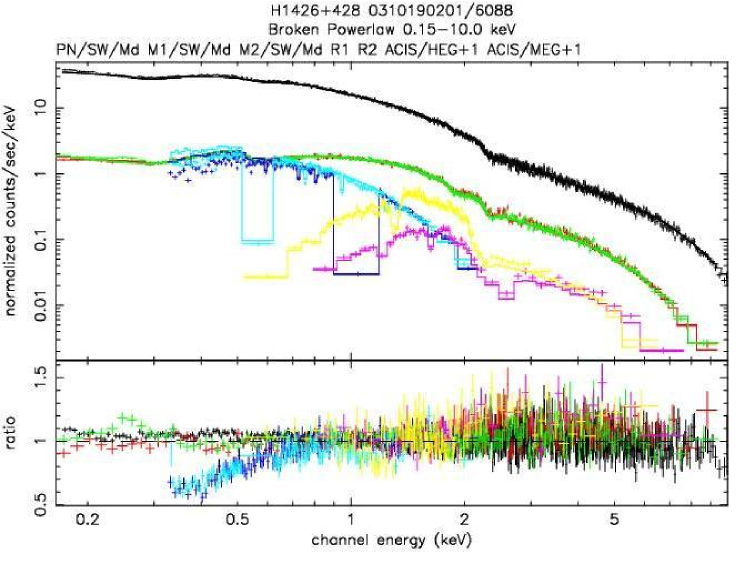
An example for a simultaneous observation of XMM-Newton with Chandra ACIS/HEG and ACIS/MEG is presented in Fig. 13. H1426+428 was observed in rev. 1015. Again, the general spectral shape agrees very well between XMM-Newton and Chandra. Especially between 0.8-2.0 keV all instruments agree within 15% in normalisation. Above 2 keV, the ACIS/HEG shows a slightly flatter slope than EPIC. At high energies, MOS are closer to ACIS/MEG than pn.
6 XMM-Newton versus Swift
A simultaneous observation of XMM-Newton and Swift was performed on H1426+428 in rev. 1012 and the result is presented in Fig. 14. The residuals show a good agreement of all instruments between 0.6-3.0 keV. The Swift XRT measures a steeper slope at high energies than the EPICs. Below 0.6 keV, large discrepancies are present.
7 Conclusions
With the new mechanisms for time- and spatial dependent MOS redistributions in SASv6.5, together with the published corresponding new set of EPIC MOS-CCFs, the EPIC low energy issue is about to be solved. The new pn CCFs are already available since 2005 May. RGS show a low energy flux difference of about 10% at launch. The sensitivity at longest wavelengths has decreased by 10-20% over the mission. The status using SASv6.5 is that EPIC and RGS are not yet consistent below 0.7 keV.
The next big step in cross-calibration will be the implementation of the best knowledge of RGS into SAS (J. Kaastra et al.: Absolute Effective Area Calibration of the XMM-Newton Reflection Grating Spectrometers).
References
- Kaastra et al., (2005) Kaastra, J., den Herder, J.W., De Vries, C., Vink, J., de Plaa, J., Pollock, A.M.T. 2005, ESA-SP 604, proceedings of ”The X-ray Universe 2005”, San Lorenzo de El Escorial (Spain), 26-30 September 2005.
- Read et al., (2005) Read, A.M., Sembay, S.F., Abbey, A.F., Turner, M.J.L. 2005, ESA-SP 604, proceedings of ”The X-ray Universe 2005”, San Lorenzo de El Escorial (Spain), 26-30 September 2005.