Dodson et al.Spectral Properties and Jet Motions in M87 \Received2005/07/08\Accepted2005/11/11
galaxies: active — radio continuum: galaxies — galaxies: individual (M87)
Milli-arcsecond–scale Spectral Properties and Jet Motions in M87
Abstract
We have combined high resolution VLBI Space Observatory Programme (VSOP) data at 1.6 and 4.8 GHz with Very Long Baseline Array (VLBA) data at higher frequencies and with similar resolutions to study the spectral properties of the core of M87 with milliarcsecond resolution. The VSOP data allow a more accurate measurement of the turn-over frequency, and hence more reliable determination of associated physical parameters of the source. Comparison of the images with previously published images yields no evidence for significant motion of components in the parsec-scale jet. In addition, the brightness temperatures obtained from model-fits to the core are well below the inverse Compton limit, suggesting the radio emission we are observing is not strongly Doppler boosted.
1 Introduction
The identification of the radio source Virgo A with the giant elliptical galaxy M87 was one of the first such associations to be made and demonstrated the gains in angular resolution obtainable from interferometric observations (Bolton et al., 1949). M87 (NGC4486, 3C 274, J1230+1223) lies near the center of the Virgo Cluster and was already well known due to its “curious straight ray” (Curtis (1918)). This jet extends over 20′′ at optical (e.g., Sparks et al. (1996)) and X-ray (e.g., Marshall et al. (2002)) energies and has been well studied at radio wavelengths (e.g., Owen et al. (1989)). VLA observations at 90 cm have revealed the jet extends considerably further, appearing to flow into two large bubbles in the intergalactic medium (Owen et al. (2000)).
Hubble Space Telescope (HST) spectroscopic observations indicate the presence of supermassive black hole in the core of the galaxy, with M⊙ contained within the central 3 pc (Harms et al. (1994)) and the process of accretion of material towards the core is believed to power the jet. At a distance of only 16.75 Mpc (Whitmore et al. (1995)), high angular resolution studies correspond to the highest linear resolutions obtainable for AGN, with 1 mas corresponding to 0.08 pc. The inner parsec-scale jet has been studied at increasingly higher radio frequencies, revealing that jet collimation begins within several tens of Schwarzschild radii of the core but is not complete until several thousand Schwarzschild radii (Junor et al. (1999); Ly et al. (2004a); Krichbaum et al. (2004, 2005)). A comparison of Chandra and HST data indicates that the X-ray flux dominates closer to the core but decreases relative to the optical flux with increasing core distance (Marshall et al. (2002)). A detection of M87 has also been reported at TeV energies from a region which includes the core and inner jet, although systematic pointing errors prevented the identification of the gamma-ray production site with any feature at other wavelengths (Aharonian et al. (2003)). The TeV detection has, however, yet to be confirmed (Le Bohec et al. (2004)).
The study of motions of features in the jet has yielded a number of surprises. Early VLBI observations revealed that apparently superluminal motions (i.e., ) were common in radio-loud active galactic nuclei (AGN), however the first multi-epoch 1.6 GHz VLBI observations of M87 suggested that the parsec-scale jet displayed sub-luminal (i.e., ), with an apparent speed of 1.10.3 mas yr-1, corresponding to 0.280.08 (Reid et al. (1989)). Observations with the VLA at 15 GHz at six epochs spanning 9 years resulted in the detection of apparent motions between 0.5 and for the bright knots over 1 kpc from the core, but apparent speeds of for two features pc from the core (Biretta et al. (1995)). Further VLBI observations at 22 GHz yielded only upper limits, with apparent speeds of for components within 4 mas of the core (Junor & Biretta (1995)) and the analysis of further 1.6 GHz VLBI images suggested features out to 160 mas were stationary (, Biretta & Junor (1995)).
In contrast, a series of five HST images resulted in the measurement of apparent speeds of 2.6 –6 for components between 0.87′′ and 6′′ of the core (Biretta et al. (1999)). An apparent speed of 0.630.27 was measured for the innermost resolvable component, 160 mas from the core (Biretta et al. (1999)). More recently, Kellermann et al. (2004) have reported an apparent speed of 0.140.07 mas yr-1, or 0.040.02 for a component 6 mas from the core, based on 9 epochs of 15 GHz observations over the six years from 1995 to 2001. A component detected between 1 and 2 mas from the core showed no net motion over the same time range. Finally, at 43 GHz Ly et al. (2004b) have reported lower limits on the apparent speed of 0.25 to 0.40 for the jet, and 0.17 for the counter-jet.
We report here on contemporaneous observations of M87 made as part of the VLBI Space Observatory Programme (VSOP; Hirabayashi et al. (1998, 2000)) and the Very Long Baseline Array (VLBA). The multi-frequency data allows the evolution of the spectral index with core distance to be studied, and comparison with previously published images enables component motions to be examined.
2 The Observations
A series of VSOP observations of M87 have been made at 1.6 GHz and 4.8 GHz over the lifetime of the mission (see, e.g., Junor et al. (2000); Biretta et al. (2002)). We have selected from the VSOP data archive 1.6 and 4.8 GHz observations made over a three day period in March 2000, and combined them with VLBA data from observations made three weeks later, to minimize the effects of source variability. Details of the observations presented here are given in table 1.
| Observation code | Frequency | Date | Ground Telescopes∗*∗*footnotemark: |
| [GHz] | |||
| w022a7 | 1.646 | 2000 Mar 22 | HALCA, VLBA, Ti, Ro |
| w040a5 | 4.812 | 2000 Mar 20 | HALCA, VLBA |
| bj031a | 15.365 | 2000 Apr 07 | VLBA |
| bj031a | 22.233 | 2000 Apr 07 | VLBA |
| bj031b | 43.217 | 2000 Apr 09 | VLA, VLBA-Hn |
|
∗*∗*footnotemark:
Ground telescopes:
Hn = Hancock 25 m;
Ti = Tidbinbilla 70 m;
Ro = Robledo 70 m;
VLA = phased VLA; VLBA = full VLBA. |
|||
| Resolution | Residual | Residual noise | Core Brightness | |
|---|---|---|---|---|
| Frequency | (beam size) | noise level | for 1.230.96 beam | Temperature |
| [GHz] | [mas] | [mJy/beam] | [mJy/beam] | [K/] |
| 1.646 | 1.1 | 1.1 | 2.8 | |
| 4.812 | 0.2 | 0.3 | 3.2 | |
| 15.365 | 2.0 | 2 | 1.8 | |
| 22.233 | 1.5 | 3 | 1.4 | |
| 43.217 | 1.5 | 5 | 5.7 |
The VSOP observations were made in the standard VSOP observing mode, with two 16 MHz bandwidth channels of two-bit sampled, left circular polarization (LCP) data recorded at all stations (Hirabayashi et al. (2000)). HALCA data were received and recorded at the Tidbinbilla, Goldstone, Robledo and Green Bank tracking stations. The ten telescopes of the Very Long Baseline Array (VLBA) co-observed at both 1.6 and 4.8 GHz, and in addition the Tidbinbilla and Robledo 70 m telescopes participated in the 1.6 GHz observation.
The VLBA observations on 2000 April 7 recorded 8 IFs (both polarisations) of 8 MHz bandwidth alternating between 15 and 22 GHz approximately every twenty minutes. North Liberty was found to have poor signal to noise and was excluded. The 43 GHz observation on 2000 April 9 was made with 8 IFs of 8 MHz bandwidth, and included the phased VLA, but not Hancock.
3 Data Reduction
The data were reduced in AIPS111Astronomical Image Processing Software developed and maintained by the National Radio Astronomy Observatory. using the standard VSOP and VLBA methods, and the VLBA pipeline scripts where possible. The VLBA antenna system temperatures are recorded within the data files. The nominal system temperatures for the respective observing frequencies were used for HALCA (Hirabayashi et al. (2000)) and also DSN telescopes, and the VLA antenna temperatures were scaled to 3C286 (also observed in the experiment). All of these were applied to the data via the task antab. After this initial amplitude calibration, delay and phase calibration was undertaken with fring, before exporting the data for deconvolution and imaging in Difmap (Shepherd (1997)). For further image analysis we used MIRIAD (Sault et al. (1995)) for alignment, smoothing and spectral index calculation. Finally we used Octave (Eaton, 2002) to calculate the turn-over frequency using the minimisation routines therein.
4 Images
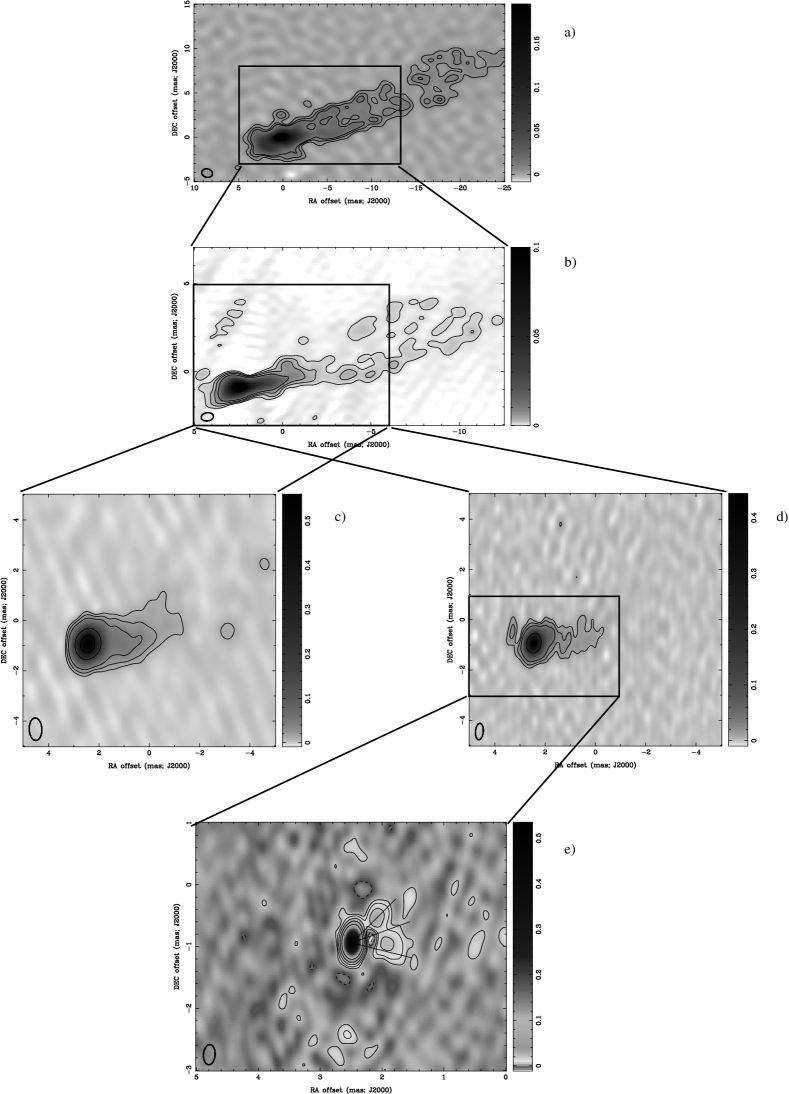
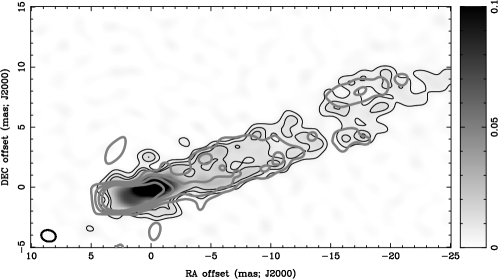
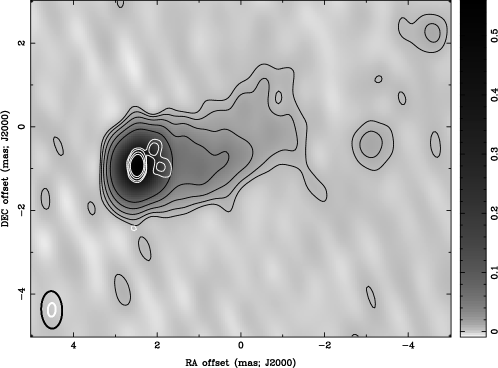
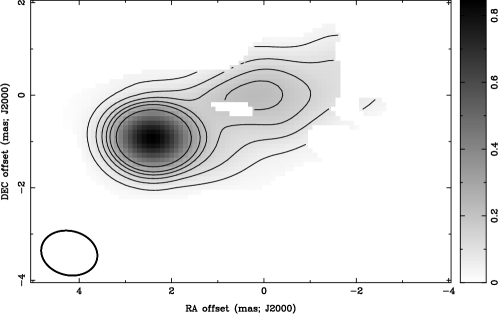
We present images of M87 at 1.6, 4.8, 15, 22 and 43 GHz at their maximum resolutions in figure 1. The full-resolution VSOP image at 1.6 GHz has a resolution of 1.230.96 mas at a position angle (PA) of 77∘. It was made with uniform weight binning and no amplitude error weighting to achieve maximum resolution at the expense of signal to noise. The peak brightness is 0.20 Jy/beam and the RMS is 1.1 mJy/beam. The low-level emission surrounding the core perpendicular to the jet axis in the 1.6 GHz image has not been reported previously. It is not seen in higher frequency images, consistent with this weak extended emission having a steep spectral index. This emission would not have been visible in lower resolution images such as those in Reid et al. (1989) and Reid (1998).
The 4.8 GHz VSOP image has a resolution of mas at a PA of . It was made with uniform weighting and an amplitude error weighting of . The peak brightness is 0.14 Jy/beam with an RMS of 0.2 mJy/beam. The image is similar to the VSOP images in Junor et al. (2000) and Biretta et al. (2002). For analysis of spectral variations it is necessary to convolve all images with the same beam-size: At 4.8 GHz the smoothed image has a resolution which matches the 1.6 GHz image, a peak of 0.14 Jy/beam and an RMS of 0.3 mJy/beam.
The 15 GHz VLBA image has a resolution of mas at a PA of . It was made with uniform weighting and an amplitude error weighting of 1. The peak brightness is 0.56 Jy/beam with an RMS of 2 mJy/beam. The smoothed image has a resolution which matches the 1.6 GHz image, a peak of 0.83 Jy/beam and a RMS of 2 mJy/beam. The image is similar to those made as part of the VLBA 2 cm survey (Kellermann et al., 2004).
The 22 GHz VLBA image has a resolution of mas at a PA of 1∘. It was made with uniform weighting and an amplitude error weighting of 1. The peak brightness is 0.44 Jy/beam with an RMS of 1.5 mJy/beam. The smoothed image has a resolution which matches the 1.6 GHz image, a peak of 0.86 Jy/beam and a RMS of 3 mJy/beam. This can be compared with the 22 GHz image of Junor & Biretta (1995). The weak feature about 1 mas to the North-East of the core could belong to the counter-jet and matches the direction (but not distance) of a similar component seen at 86 GHz (Krichbaum et al. (2004)).
Our 43 GHz image has a resolution of mas at a PA of 4∘. It was made with uniform weighting and an amplitude error weighting of 1. The peak brightness is 0.53 Jy/beam with an RMS of 1.5 mJy/beam. The smoothed image has a resolution which matches the 1.6 GHz image, a peak of 0.63 Jy/beam and a RMS of 5 mJy/beam. The peak brightness is significantly higher than that reported by Junor et al. (1999) for March 1999 but less than that in Ly et al. (2004a) observed in October 2001. The structure is consistent with those of Junor et al. (1999); Biretta et al. (2002); Ly et al. (2004a), although with a lower signal to noise. Overlaid on our image (figure 1e) are the opening angles identified by Junor et al. (1999).
For each of these high resolution images we have calculated the core brightness temperature in the source rest frame from the core integrated flux and deconvolved size and these are reported in table 2. We have taken the Eastern-most component as the core, which is also the brightest for all but the 1.6 GHz image. In the 1.6 GHz image the brightness temperature of the peak component is K. These values are all well below the inverse Compton limit and therefore do not require Doppler boosting.
5 Jet Component Motions
As mentioned previously, M87 has been well studied using the VLBI technique and there are many published images with which we can compare those presented here.
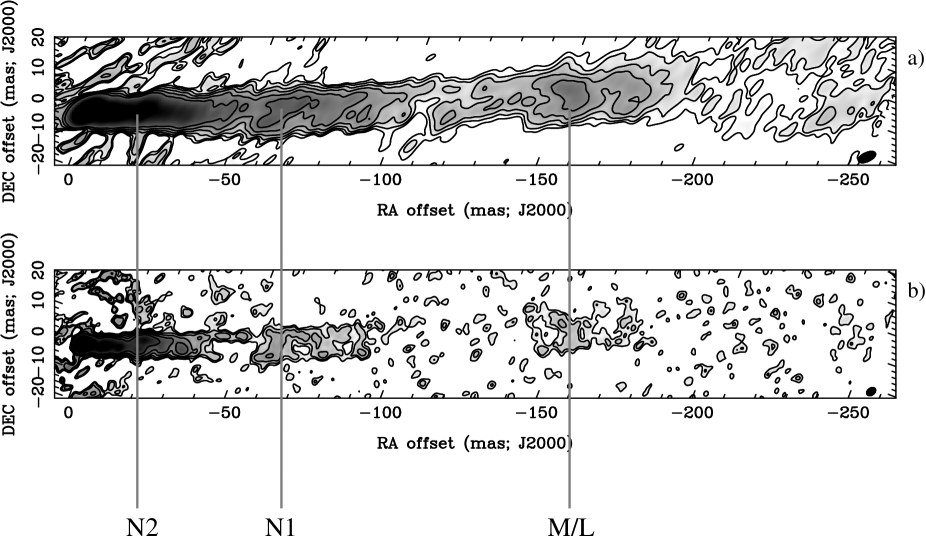
First, we have re-imaged the 1.6 GHz data with only the VLBA telescopes, using a Gaussian (u, v) taper falling to 0.5 at 50 M. The resulting image, shown in figure 2a, can be directly compared with the 1.6 GHz image of Reid et al. (1989) from epoch 1984.26, and also with those of Biretta & Junor (1995) at epochs 1988.41 and 1992.47. The similarities between the images are startling. Three jet features were identified by Reid et al. (1989): N2, at a core distance of 20 mas, N1 at 65 mas, and M at 170 mas. Component M was subsequently labeled L in Biretta & Junor (1995) and Biretta et al. (1999). All three components are visible in figure 2, and appear to have remained stationary over the 15.96 years spanned by these observations (with N1 and N2 having been first identified in lower sensitivity observations several years earlier). We place the positions of knots N2 and N1 at 19.4 and 64.7 mas along the jet in the images from Reid et al. (1989) (epoch 1984.26), to better than 2 mas. From our observations we place N2 and N1 at 18.4 and 62.9 mas in epoch 2000.22. We can therefore confirm the upper limits of and for N2 and N1 respectively.
Biretta et al. (1999) reported a motion for knot L of 2.481.06 mas yr-1 based on HST observations. This would suggest motion of at least 22.7 mas over the 15.96 years, however the peak of the radio emission in knot L shows no evidence of having moved at all. In addition, the “gap” or minimum in the jet emission 110 mas from the core does not appear to have moved.
Closer to the core, we can compare our VSOP 4.8 GHz image with the VSOP image at epoch 1997.97 (Junor et al. (2000); Biretta et al. (2002)). In addition to N2, enhancements in the jet emission can be clearly seen at 13 mas and 6 mas, the latter corresponding to component B of Kellermann et al. (2004). These have displayed no discernible motion over the intervening 2.25 years, although the speed reported for component B by Kellermann et al. (2004) of 0.140.07 mas yr-1 cannot be ruled out.
These observations strongly support the theory that these components in the radio jet mark the sites of standing shocks. Filamentary features, limb-brightening, and side-to-side oscillations have been reported on a number of occasions (e.g., Owen et al. (1989); Reid et al. (1989); Biretta et al. (2002)) which, as these authors have pointed out, is consistent with a fast underlying flow. The visible radio emission arises from a less strongly beamed interaction between the inner jet and the surrounding sheath. The emission from the sheath must still be Doppler boosted to some extent as otherwise the counter-jet would be expected to be easily detectable (e.g., Junor & Biretta (1995)). It is possible to estimate the required Doppler factor from the ratio of the jet brightness to the noise level. Following the analysis of Jones et al. (1996) we use the following expression for smooth continuous jet sheath flow:
where R is the flux ratio between the jet and counter-jet (the upper limit in this case), is the speed of the jet sheath in terms of the speed of light and is the jet angle to the line of sight. The spectral index, , has the opposite sign in this paper than in the reference, as discussed in section 6.1. At the peak of the 1.6 GHz emission the brightness is 0.2 Jy/beam, is and the image noise is 1.1 mJy/beam. For we use the value of of Biretta et al. (1999). We find R 60, therefore the sheath has .
The doppler factor,
implied by these values is therefore .
The discrepancy between HST-based speed for knot L with the stationary radio features may perhaps be related to the phenomena observed in the HST observations for the component HST-1 East, 870 mas from the core. This knot, which has a speed of 0.84 , appears to launch new optical features which move at speeds of up to (Biretta et al., 1999). Possibly the stationary radio feature 170 mas from the core is the site from which optical components like knot L are launched (with, in this case, sub-luminal speeds). We note that there are no published images of M87 at 1.6 GHz from the period of the HST observations (1994.59 to 1998.55) to determine whether the HST feature has a radio counterpart.
Biretta et al. (1999) suggest that the motions reflect the underlying speed of the jet. It is clear that features in the radio jet between 7 and 160 mas appear stationary, in contrast to the lower limits of 1 to 1.6 motions recently reported from observations at 43 GHz (Ly et al. (2004b)). It will be interesting to see whether the actual speeds close to core are comparable to the underlying jet speed inferred from the HST observations.
Finally, as described in more detail in the next section, we detect a component 2 mas from the core in the 1.6, 4.8, 15 and 22 GHz images. Precise measurement of the core distance is complicated by frequency dependent opacity effects and, potentially, by the time intervals between observations, if the lower limits to motions derived by Ly et al. (2004b) still apply at these core distances. We note that this core distance is similar to that of the component C of Kellermann et al. (2004). As noted earlier, component C was detected between 1 and 2 mas from the core by Kellermann et al., but showed no net motion over the six years. It has been suggested that “stationary” components may be standing recollimation shocks, which could appear to move back and forth to some degree as other jet components move through them (see, e.g., Jorstad et al. (2001) and references therein): it would be interesting to monitor the movements of this feature to determine whether there is any relationship with the motions of the moving jet components observed closer to the core at 43 GHz.
6 Image Alignment
Self-calibrating VLBI data loses the absolute position information, and produces images centred on the strongest emission, so re-alignment is required when comparing images at different frequencies. There are various approaches to re-aligning observations: we chose the simplest, which also produces essentially identical answers to more complex methods.
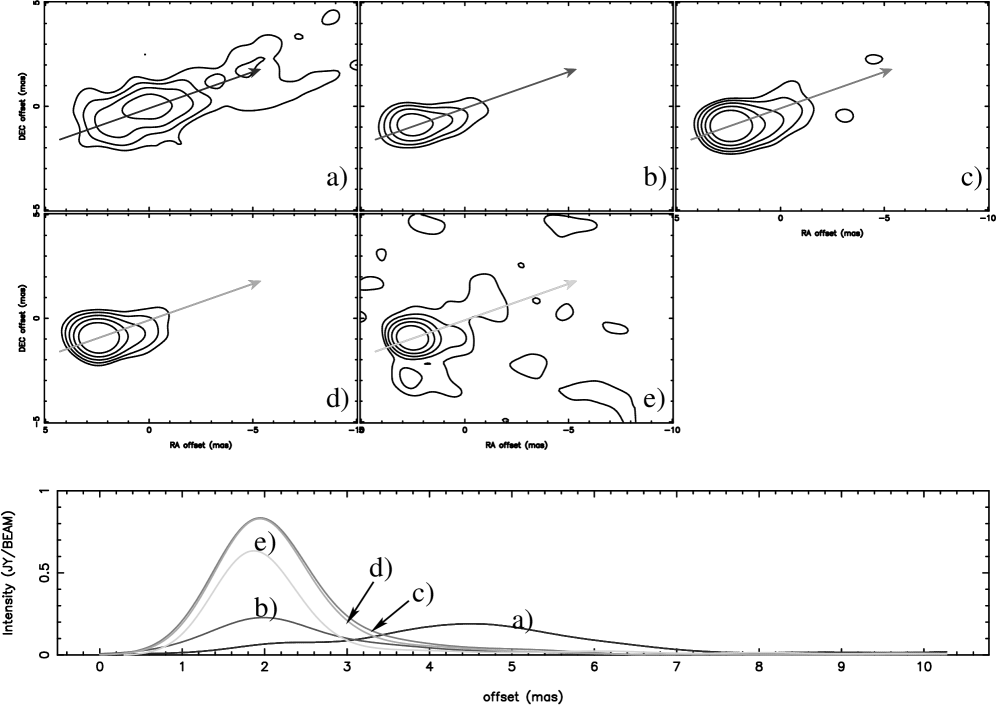
The jet in M87 is straight, so does not allow the alignment on a frequency-independent feature such as a bend. The region closest to the core could be approximately decomposed into two components between 1.6 and 22-GHz, however, so it was possible to identify and align on the core and innermost jet component. The latter, which is 2 mas from the core, is the brightest feature at 1.6 GHz, with the core being brighter at 4.8 GHz and above. Because of the poor representation, and therefore positional accuracy, of the Gaussian components (particularly for the 1.6 GHz image) we abandoned unconstrained image alignment. We finalised on identifying 1-D Gaussian components along the jet axis. This allowed us to produce images aligned on the maximum of the core, i.e., the Eastern-most image component, along the jet axis. Slices through the core and along the inner jet of the aligned images are plotted in figure 3 and overlays of the four lowest frequencies are overlaid in figure 4.
Core shifts are ignored in this approach, but these are expected to be small (Lobanov (1998a)). Lobanov (2005, personal communication) predicts a core shift of 0.015 mas between 5 and 22 GHz for M87 assuming nominal jet parameters. The offset between 1.6 GHz and 43 GHz is 0.1 mas, in line with our errors. In support of our approach, we note the good alignment between the edges of the jet in the first 10 mas in the 1.6 and 4.8 GHz images. There is a broad component 6 mas from the 1.6 GHz core (described in the previous section) which aligns between the 1.6 to 22 GHz images, but it cannot be identified in the 43 GHz image. The 15, 22 and 43 GHz images are very similar and have only a small relative shift.
It is worth noting that shifting the core site away from the peak of the 1.6 GHz emission does not alter the calculations of the opening angle, such as those described in Reid et al. (1989). An opening angle of 6.9 degrees was derived by Reid et al. from the increase of the jet width along the jet axis, and a core shift such as that described here therefore results in a change in the fitted core diameter at the origin from 1.7 mas to 1.2 mas. This core size matches closely the predicted size resulting from interstellar and interplanetary scattering of 1 mas (Cohen & Cronyn, 1974).
6.1 The spectral index
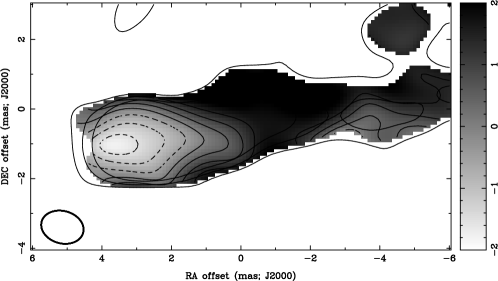
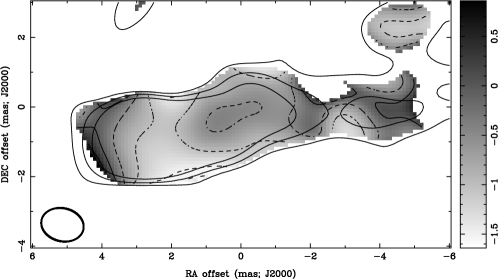
The spectral index, , between 1.6 and 4.8 GHz and 4.8 to 15 GHz, after smoothing to a common resolution are presented in figure 5, defined in the sense . The extended emission around the 1.6 GHz image, mentioned in Section 4, and not visible at higher frequencies, implies a spectral index of greater than 2 to the North and South of the region mapped. Between the higher frequencies we have a negative spectral index across most of the source (), as would expected given that M87 is brighter at 15 GHz than 4.8 GHz (see figure 3). Between 1.6 and 4.8 GHz the spectral index is more complex, with a inverted component () closest to the core and a steep component () near the peak of the low frequency emission. This emphasizes the differences in character of these two emission regions, and the analytical importance of the lower frequency, high resolution VSOP observations.
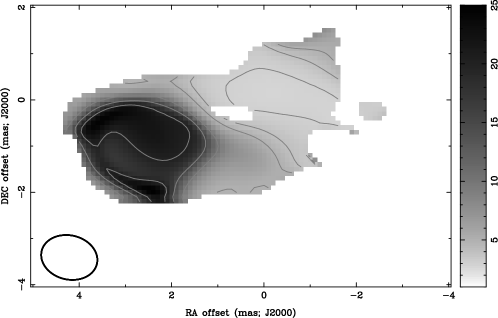
For the spectral fitting we used our pentachromatic dataset across the AGN core, and limits for the cutoff frequencies. Because there are great difficulties is measuring these cutoffs we have fitted them with very large errors, but forcing the spectral fits to have positive curvature. We have followed the methods of Lobanov (1998b) to calculate the turnover frequencies as the jet develops along the axis. We fitted second order polynomials to the log() log() data, with assumed spectral cutoffs of 0.1 and 1000 GHz, as shown in figure 6, which shows the derived maximum frequency, and the flux at that frequency, . A range of cutoff frequencies were trialled before settling on these values. Significantly higher values for the upper, or smaller values for lower, cutoff distorted the spectrum sufficiently to discount them as possibilities. The two centres of emission clearly indicated in 6b, and suggested by the two-component image fits, place the low frequency peak within the collimation zone described by Junor et al.(1999). We have estimated the systematic effects of the errors in image alignment by performing multiple fits with introduced random shifts of mas in the alignment and comparing these to the plotted fits. We find the errors are the order of 20% for both and .
Following the shocked emission approach outlined in Cawthorne (1991) and Lobanov (1998b) (equations 17 and 18), we can relate the turn-over flux density and frequency, together with the distance down the jet, to the magnetic field strength:
where is a constant of proportionally, the turn-over frequency, the flux at this maximum, the distance down the jet and the power of the background ambient magnetic field. We use the values for the core together with the lower limit to the average magnetic field strength for the core of 22 mG derived by Biretta et al. (1991) to determine . We averaged the and across the jet and plot these in figure 7. The figure also plots the derived magnetic from these two values assuming that the ambient background magnetic field is proportional to , where, following Lobanov (1998b) we consider cases with both and . The uncertainties in and , and the high sensitivity of to these, lead us to be cautious about the derived quantities. However, as a qualitative guide to the field required to generate the observed emission, the results are robust and repeatable even in our randomised datasets. Two peaks in the magnetic field are seen, whether ambient field varies as the square or linearly. The first peak occurs just before the high frequency peak of emission and the second occurs just before the low frequency peak. The magnetic field between these two peaks is 10 mG. This leads us to the speculation that core is delimited by magnetic field compression at the boundaries, that the field is roughly uniform within the core, and that the low frequency peak is outside this core, and in the collimation zone. We note that Lobanov (1998b) derived a similar behaviour for the magnetic field of 3C345.
7 Summary and Discussion
We have presented images of M87 at 1.6 and 4.8 GHz from VSOP observations, and at 15, 22 and 43 GHz from VLBA observations three weeks later. The combination of lower frequency and high resolution provided by the space baselines allowed us to directly measure the turn-over frequency, rather than extrapolate it. The spectral index maps show distinct differences between the core and the component 2 mas from the core. We have used the five frequencies to fit the spectrum of the source, pixel by pixel. From this we derive the frequency of maximum emission and the flux at that frequency. We have combine these values to calculate the variation of the magnetic field strength across the core and into the jet. Taking a reasonable set of assumptions, the magnetic field peaks at the outer edges of the core, and is flat across it.
Applying a () taper to the 1.6 GHz data and restoring with a larger beam resulted in the detection of jet components up to 160 mas from the core, revealing that these features have appeared stationary over the last 16 years. Comparison of the 4.8 GHz image with the earliest VSOP image of M87 indicates that components closer to the core have also appeared stationary on a 2.25 year timescale.
The reported detection of TeV gamma-rays from M87 invites comparison of these jet speeds with the sub-luminal and stationary components observed in other AGN detected at TeV energies (Edwards & Piner, 2002; Piner & Edwards, 2004). The comparison is complicated by the fact that M87 is an intrinsically much weaker TeV source (Aharonian et al., 2003). Bai & Lee (2001) consider the contrasting effects of M87’s proximity but larger jet angle to the line of sight, . They note that if the bright TeV sources Mkn 421 or Mkn 501, both at distances of 150 Mpc and for which they adopt , were at the distance of M87 but viewed at , they would be weak but detectable. Biretta et al. (1999) however, derive based on the HST observations of apparent speeds of 6 , which would increase the predicted flux (keeping other assumptions constant) by a factor of 20. Given all the uncertainties, it is at least plausible that M87 is a detectable (if variable; Le Bohec et al. (2004)) TeV source.
Assuming this is the case, we can then examine the explanations proposed for the low jet motions in TeV gamma-ray sources (Edwards & Piner, 2002; Piner & Edwards, 2004) for the specific case of M87. M87 shows evidence for a significant jet opening angle (Reid et al., 1989), which Gopal-Krishna et al. (2004) have pointed out can result in apparent speeds much slower than the actual speed due to variation of boosting across the width of the jet. However, the effectively stationary jet motions observed on the mas-scale would suggest this model does not apply in this case. There would appear to be evidence for decelerating jet model of Georganopoulos & Kazanas (2003) in the recent reported jet speeds close to the core at 43 GHz, however one must then invoke reacceleration at large core distances to explain the superluminal motions detected in HST observations. The most natural explanation for M87 would appear to be, as discussed earlier, an invisible jet spine with the observed jet components being standing shocks in the sheath of surrounding material.
The apparent component motions observed at 43 GHz thus offer the promise of studying collimation region and, possibly, the transition region from significant motions to apparently stationary features in the parsec-scale jet. The planned VSOP-2 mission (Hirabayashi et al. (2004)) will enable observations at 43 GHz with even higher resolution, which will enable the acceleration and collimation of this important radio jet to be examined even more closely.
We gratefully acknowledge the VSOP Project, which is led by the Institute of Space and Astronautical Science of the Japan Aerospace Exploration Agency, in cooperation with many organizations and radio telescopes around the world. RGD acknowledges support from the Japan Society for the Promotion of Science, and the hosting by Observatorio Astronómico Nacional, España, during the preparation of this paper. The NRAO is a facility of the National Science Foundation, operated under cooperative agreement by Associated Universities, Inc.
References
- Aharonian et al. (2003) Aharonian, F., et al. 2003, A&A, 403, L1
- Bai & Lee (2001) Bai, J. M., & Lee, M. G. 2001, ApJ, 549, L173
- Biretta et al. (1991) Biretta, J. A., Stern, C. P., & Harris, D. E. 1991, AJ, 101, 1632
- Biretta et al. (1995) Biretta, J. A., Zhou, F., & Owen, F. N. 1995, ApJ, 447, 582
- Biretta & Junor (1995) Biretta, J. A., Junor, W. 1995, Proc. Natl. Acad. Sci. 92, 11364
- Biretta et al. (1999) Biretta, J. A., Sparks, W. B., & Macchetto, F. 1999, ApJ, 520, 621
- Biretta et al. (2002) Biretta, J. A., Junor, W., & Livio, M. 2002, New Astronomy Review, 46, 239
- Bolton et al. (1949) Bolton, J. G., Stanley, G. J., & Slee, O. B. 1949, Nature, 164, 101
- Cawthorne (1991) Cawthorne, T. V. 1991, Beams and Jets in Astrophysics, 187
- Cohen & Cronyn (1974) Cohen, M. H., & Cronyn, W. M. 1974, ApJ, 192, 193
- Curtis (1918) Curtis, H. D. 1918, Publications of Lick Observatory, 13, 9
- Eaton (2002) Eaton, J. 2002, “GNU Octave Manual”, Network Theory Ltd
- Edwards & Piner (2002) Edwards, P. G., & Piner, B. G. 2002, ApJ, 579, L67
- Georganopoulos & Kazanas (2003) Georganopoulos, M., & Kazanas, D. 2003, ApJ, 594, L27
- Gopal-Krishna et al. (2004) Gopal-Krishna, Dhurde, S., & Wiita, P. J. 2004, ApJ, 615, L81
- Harms et al. (1994) Harms, R. J., et al. 1994, ApJ, 435, L35
- Hirabayashi et al. (1998) Hirabayashi, H., et al. 1998, Science, 281, 1825
- Hirabayashi et al. (2000) Hirabayashi, H., et al. 2000, PASJ, 52, 955
- Hirabayashi et al. (2004) Hirabayashi, H., et al. 2004, in Optical, Infrared, and Millimeter Space Telescopes, ed. J.C. Mather Proc. SPIE vol. 5487, p. 1646
- Jones et al. (1996) Jones, D. L., et al. 1996, ApJ, 466, L63
- Jorstad et al. (2001) Jorstad, S. G., Marscher, A. P., Mattox, J. R., Wehrle, A. E., Bloom, S. D., & Yurchenko, A. V. 2001, ApJS, 134, 181
- Junor & Biretta (1995) Junor, W., & Biretta, J. A. 1995, AJ, 109, 500
- Junor et al. (1999) Junor, W., Biretta, J. A., & Livio, M. 1999, Nature, 401, 891
- Junor et al. (2000) Junor, W., Biretta, J. A., Owen, F. N., & Begelman, M. C. 2000, in Astrophysical Phenomena Revealed by Space VLBI, ed. H. Hirabayashi, P.G. Edwards, and D.W. Murphy, (ISAS, Sagamihara) p. 13
- Kellermann et al. (2004) Kellermann, K. I., et al. 2004, ApJ, 609, 539
- Krichbaum et al. (2004) Krichbaum, T. P., et al. 2004, European VLBI Network on New Developments in VLBI Science and Technology, 15
- Krichbaum et al. (2005) Krichbaum, T.P., et al. 2005, Exploring the Cosmic Frontier, eds. J.A. Zensus, A. Lobanov et al., ESO Astrophysics Symposia.
- Le Bohec et al. (2004) Le Bohec, S., et al. 2004, ApJ, 610, 156
- Lobanov (1998a) Lobanov, A. P. 1998a, A&A, 330, 79
- Lobanov (1998b) Lobanov, A. P. 1998b, A&AS, 132, 261
- Ly et al. (2004a) Ly, C., Walker, R. C., & Wrobel, J. M. 2004a, AJ, 127, 119
- Ly et al. (2004b) Ly, C., Walker, R. C., & Junor, W. 2004b, American Astronomical Society Meeting Abstracts, 205, 110.01
- Marshall et al. (2002) Marshall, H. L., Miller, B. P., Davis, D. S., Perlman, E. S., Wise, M., Canizares, C. R., & Harris, D. E. 2002, ApJ, 564, 683
- Owen et al. (1989) Owen, F. N., Hardee, P. E., & Cornwell, T. J. 1989, ApJ, 340, 698
- Owen et al. (2000) Owen, F. N., Eilek, J. A., & Kassim, N. E. 2000, ApJ, 543, 611
- Piner & Edwards (2004) Piner, B. G., & Edwards, P. G. 2004, ApJ, 600, 115
- Reid et al. (1989) Reid, M. J., Biretta, J. A., Junor, W., Muxlow, T. W. B., & Spencer, R. E. 1989, ApJ, 336, 112
- Reid (1998) Reid, M. 1998, Science, 281, 1815
- Sault et al. (1995) Sault, R. J., Teuben, P. J., & Wright, M. C. H. 1995, Astronomical Society of the Pacific Conference Series, 77, 433
- Shepherd (1997) Shepherd, M. C. 1997, Astronomical Society of the Pacific Conference Series, 125, 77
- Sparks et al. (1996) Sparks, W. B., Biretta, J. A., & Macchetto, F. 1996, ApJ, 473, 254
- Whitmore et al. (1995) Whitmore, B. C., Sparks, W. B., Lucas, R. A., Macchetto, F. D., & Biretta, J. A. 1995, ApJ, 454, L73