The Pulsar Wind Nebula of the Geminga Pulsar
Abstract
The superb spatial resolution of Chandra has allowed us to detect a -long tail behind the Geminga pulsar, with a hard spectrum (photon index ) and a luminosity ergs s-1 in the 0.5–8 keV band, for an assumed distance of 200 pc. The tail could be either a pulsar jet, confined by a toroidal magnetic field of G, or it can be associated with the shocked relativistic wind behind the supersonically moving pulsar confined by the ram pressure of the oncoming interstellar medium. We also detected an arc-like structure – ahead of the pulsar, extended perpendicular to the tail, with a factor of 3 lower luminosity. We see a enhancement in the Chandra image apparently connecting the arc with the southern outer tail that has been possibly detected with XMM-Newton. The observed structures imply that the Geminga’s pulsar wind is intrinsically anisotropic.
Subject headings:
pulsars: individual (Geminga) – stars: neutron — stars: winds, outflows1. Introduction
It has been recognized long ago that pulsars steadily lose their rotational energy via relativistic pulsar winds (PWs). The PW shocks in the ambient medium and forms a pulsar-wind nebula (PWN) which emits synchrotron radiation (Rees & Gunn 1974). An isotropic outflow from a stationary pulsar in a uniform medium forms a spherical termination shock (TS) at a radius , where is the pulsar’s spin-down power and is the ambient pressure. For a pulsar moving at a speed with respect to the medium, the TS shape is distorted by the ram pressure, . At supersonic speeds, when the ram pressure exceeds the ambient pressure, the TS of an isotropic PW acquires a bullet-like shape (Bucciantini, Amato, & Del Zanna 2005 [hereafter B05], and references therein) with a distance between the pulsar and the bullet head. The shocked PW is confined between the TS and the contact discontinuity (CD) surface which separates the shocked PW from the shocked ambient medium between the CD and the forward bow shock (FBS). The shape of the shocks and the overall appearance of the PWN depend on the interplay of , , , and . Thus, PWNe produced by fast-moving pulsars provide an important diagnostic tool for studying PWs, the ambient medium, and pulsar velocities.
X-ray PWNe have been observed around about 30 pulsars. High-resolution observations with Chandra show that the PWN structure is never a simple spherical shell. In particular, young PWNe (e.g., the Crab and Vela PWNe; Weisskopf et al. 2000; Pavlov et al. 2003) are often approximately axially symmetric, with jets along the symmetry axis (which apparently coincides with the pulsar’s spin axis) and a torus-like structure around the axis (an equatorial PW outflow). There are some X-ray PWNe whose cometary shape is clearly caused by the pulsar motion. Some of them (e.g., the Mouse PWN, powered by the young PSR J17472958; Gaensler et al. 2004) are confined within a bow-like boundary, but they do not show a shell structure, in contrast to the sharp Hα “bows” emitted by the shocked ambient gas at FBSs produced by some pulsars. Chandra observations of the pulsars B1757–24 (Kaspi et al. 2001), B1957+20 (Stappers et al. 2003), J15095859, and J18091917 (Sanwal et al. 2005) have revealed elongated structures (of lengths –0.5 pc) which look like “trails” behind moving pulsars. An exceptionally long ( pc) trail was found behind PSR B1929+10 by Wang, Li, & Begelman (1993). The origin of these trails has not been firmly established (see §4).
An intriguing PWN structure has been recently reported by Caraveo et al. (2003; hereafter C03) from an XMM-Newton observation of the middle-aged pulsar Geminga ( kyr, ergs s-1). They found two -long tails behind the pulsar, with a luminosity of ergs s-1 in the 0.3–5 keV band. They suggested that these are the tails of a bow shock generated by pulsar’s motion and predicted the head of the bow-shock to be at an angular distance of – ahead of the pulsar. In this paper, we present the results of our high-resolution Chandra observation of the Geminga PWN111 Preliminary results have been presented by Sanwal, Pavlov, & Zavlin (2004). and confront them with the results of the XMM-Newton observation and theoretical models.
2. Observations and Data Reduction
Chandra observed Geminga on 2004 February 7 for 19.9 ks (18.8 ks good exposure time). The pulsar was positioned on ACIS-S3 chip with a standard Y offset of . A 1/8 subarray mode (data taken from a region of each CCD, with a frame time of 0.7 seconds) was used to mitigate the pileup in the pulsar image. We used the Chandra Interactive Analysis of Observations (CIAO) software (ver.3.2.2; CALDB ver.3.1.0) for the analysis, starting from the level 1 event files to correct for charge transfer inefficiency. We applied the standard grade filtering and removed events with energies keV to reduce the background. Since no events with keV were telemetered from the S3 chip, we use the 0.5–8 keV band for further analysis. To account for nonuniform exposure and nonuniform CCD response near the node boundaries, we applied the exposure map correction, using the CIAO script merge_all.
We also reanalyzed the XMM-Newton EPIC data taken on 2002 April 4–5 (103 ks exposure, with EPIC-PN in Small Window mode and EPIC-MOS in Prime Full Window mode). We used SAS v.6.1 to reprocess and analyze the data. The effective exposure times, after removing the periods of high background, are about 68 ks for EPIC-PN and 82 ks for MOS1 and MOS2. A detailed analysis of the MOS data has been presented by C03. We will supplement those results with the analysis of the EPIC-PN data.
3. Observational Results
3.1. XMM-Newton EPIC-PN Results
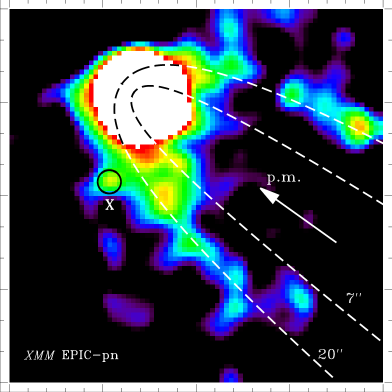
Smoothed MOS and PN images show two elongated patchy structures, stretched in the direction opposite to the pulsar’s proper motion. We will call them outer tails to distinguish from the short inner tail discovered with Chandra (Sanwal et al. 2004; see §3.2). Figure 1 (left panel) shows these structures, seen up to about from the pulsar ( pc, where is the distance222 As mentioned by Kargaltsev et al. (2005), the Geminga’s parallax reported by Caraveo et al. (1996) is incorrect, and the distance to Geminga is currently unknown; however, pc seems to be a reasonable estimate. scaled to 200 pc). To produce the image, we subtracted the intrinsic PN and particle background using a closed-filter observation in Small Window mode taken on 2002 December 30. The raw data were binned in pixels and smoothed with a Gaussian of FWHM = . Subtracting the background from a box in the lower left corner of the PN image, we found the average image brightness of the tails (extraction box of for each tail) about counts s-1 arcsec-2 in the 0.3–8 keV band. Spectral analysis of the tail emission is hindered by the strong, nonuniform background. Using the absorbed power-law spectral model with the parameters estimated by C03 from the MOS data (photon index , hydrogen column density cm-2), we obtain the surface brightness (intensity) of the outer tails ergs cm-2 s-1 arcsec-2, and the total unabsorbed flux ergs cm-2 s-1. This gives the luminosity , in agreement with the value reported by C03.
The tails in the PN image look similar to those in the MOS images, reported by C03. Their shape fits the same analytical bow-shock model by Wilkin (1996), with an inclination angle between the line of sight and pulsar velocity and a stand-off distance of about , hidden in the pulsar image broadened by the wide XMM-Newton PSF. We note, however, that although such one-zone models can describe the FBS shape close to its apex, they are not expected to be applicable to PWN tails (see, e.g., B05).
Thus, the PN data show the properties of the outer tails consistent with those derived by C03 from the MOS data. However, the patchy structure of the tails hints that there may be a substantial contribution from faint background objects (such as the point source ‘X’ resolved with Chandra; see Fig. 2). To separate such a contribution and prove that the tails are not an artifact, they should be observed with a better spatial resolution.
3.2. Chandra ACIS Results
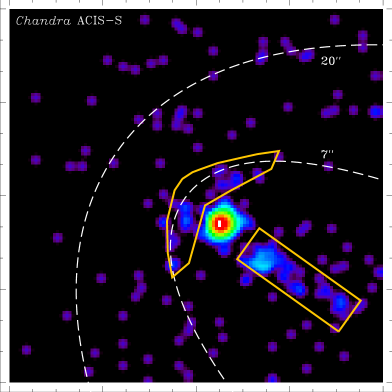
The excellent resolution of Chandra provides a close-up view in the vicinity of Geminga (right panel of Fig. 1) The image shows no emission ahead of the pulsar, predicted by C03. Instead, we see some diffuse emission at a distance of –, whose shape resembles an arc extended perpendicular to the proper motion direction. The arc and the outer tails cannot be fitted with the same Wilkin’s model. The arc-like polygon of a 116.5 arcsec2 area contains 32 counts, of which 10.1 counts are estimated to belong to the background (0.087 counts arcsec-2, as measured in a source-free rectangle north of the pulsar, shown in Fig. 2). This gives background-subtracted counts. The arc’s spectrum ( at fixed cm-2, as obtained from a power-law fit using the C-statistic) is substantially harder than the pulsar’s spectrum. A structure of such size and spectrum cannot be ascribed to PSF tails of the pulsar’s image, which does not show any significant pileup (the pulsar’s count rate is only 0.07 counts/frame). The average image brightness of counts s-1 arcsec-2 corresponds to an intensity ergs cm-2 s-1 arcsec-2, about 30 times brighter than the tails seen with EPIC. The X-ray luminosity of this structure is ergs s-1.
The most striking feature in the ACIS image is a -wide axial tail, seen up to ( cm) from the pulsar in the direction opposite to the pulsar’s proper motion. The tail is apparently detached from the pulsar by –; its brightness is maximal at , and it fades with increasing distance from the pulsar. The average image brightness in the box (see Fig. 1, right panel), which contains background-subtracted counts, is counts s-1 arcsec-2. Although the small number of counts precludes detailed spectral analysis, the tail’s spectrum can be described by a power-law model with , somewhat harder than the spectrum of the outer tails. The intensity of the tail (in the box), ergs cm-2 s-1 arcsec-2, is about 2 orders of magnitude higher than that of the tails seen with EPIC. Its luminosity, ergs s-1 (measured from background-subtracted counts in a box detached by from the pulsar), is close to the total luminosity of the putative outer tails. An inspection of the EPIC PN image shows some patchy enhancements along the tail direction, at a level of counts s-1 arcsec-2, but they are indistinguishable from background fluctuations.
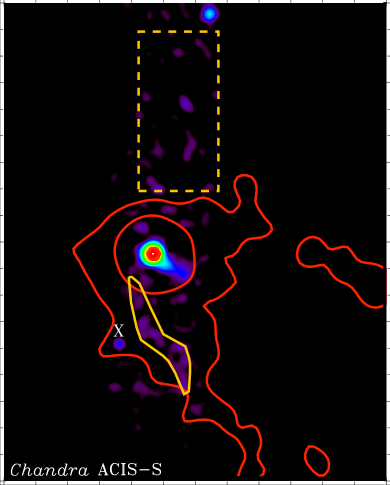
Heavily smoothed ACIS images show an enhancement south of the pulsar which apparently connects the arc with the southern outer tail (an example is shown in Fig. 2). The region of enhanced emission within the 829 arcsec2 polygon includes 105 counts. Subtracting 71.9 counts of the scaled background, we obtain excess counts, which corresponds to an intensity a factor of 6 higher than that in the EPIC tails. The slope of the excess spectrum, , is apparently similar to that of the axial tail. Thus, although the enhancement can hardly be considered as a firm detection, its position and shape support the reality of both this structure and the southern outer tail. No enhancement is seen at the site of the northern outer tail; however, the northern tail looks less significant and more patchy in the EPIC images, and only a small part of it was imaged with ACIS.
4. Discussion
If the tails in the EPIC images are real, the Geminga PWN is truly unique: a bow-shock-like structure with long outer tails and a short axial tail behind the pulsar have never been seen before in X-rays. Before discussing possible interpretations of the observed structures, we note that the proper motion of Geminga, 017 yr-1, implies a pulsar speed km s-1, where . For a reasonable distance, it exceeds a typical sound speed in the interstellar medium (ISM), km s-1, where and K are the molecular weight and temperature. Assuming that the speed of a possible ISM flow at the location of Geminga is much lower than , the ram pressure due to the pulsar motion in the ISM is ergs cm-3, where is the ISM density in atomic mass units per cm3, This gives an estimate cm for the stand-off distance of the TS head, which translates into the projected angular distance . Thus, one can expect that Geminga is accompanied by a bow-shock PWN, with a characteristic size comparable to the sizes of the structures observed with Chandra. We will discuss possible interpretations of the whole PWN, starting each from an assumption on the nature of the axial tail, the brightest feature of the PWN.
4.1. The axial tail is a shocked pulsar wind?
The axial tail could be interpreted as synchrotron emission from the shocked PW collimated by the ram pressure. According to the simulations by B05, who assumed an isotropic PW, the TS has a bullet-like shape. For large Mach numbers, , and small values of the magnetization parameter of the pre-shock PW (see Kennel & Coroniti 1984), the bullet’s cylindrical radius is , and the distance of its back surface from the pulsar is . The shocked PW outside the TS is confined inside the CD surface which has a cylindrical shape behind the TS, with a radius . The collimated PW flows with subrelativistic velocities: 0.1–0.3 in the inner channel, , and up to 0.8–0.9 in the outer channel, (see Figs. 1–3 and §3.3 in B05).
First, one can speculate that the axial tail is the CD-confined cylindrical tube behind the TS, which implies a CD radius of , , and . In this interpretation, one should expect brightest emission from the shocked PW at ahead of the pulsar, hidden within the pulsar image. The actually observed emission – ahead of the pulsar (the arc) is not explained by this model. Being well outside the CD, the two outer tails cannot be associated with a shocked PW. One might speculate that they are produced by the shocked ISM heated to X-ray temperatures, but the pulsar’s speed is too low to support this speculation, and thermal models with reasonable temperatures do not fit the tails spectrum. Overall, given the problems with explaining the observed PWN structure, this interpretation of the axial tail is hardly viable.
Second, one could assume that the axial tail is associated with the shocked PW “sheath” immediately outside the bullet-like TS, similar to the interpretations of the tail behind PSR B1757–24 by Gvaramadze (2002) and the “tongue” of the X-ray Mouse PWN by Gaensler et al. (2004). The two outer tails might be associated with emission from a shell immediately inside the CD surface, where the magnetic field is compressed (see B05) and hence the synchrotron emissivity could be enhanced333Note, however, that the simulation of intensity by B05 do not show bright shell-like structures.. In this interpretation, the outer tails should be parallel to the direction of pulsar motion, which is crudely in agreement with observations, but their distance from the PWN axis, –, implies a bullet diameter –, much larger than the observed width of the axial tail. This interpretation also implies , which is larger than the distance to the observed arc unless the inclination angle is small, . On the other hand, the width of the axial tail suggests , smaller than the distance to the arc in the Chandra image. Moreover, the arc is, on average, a factor of 4 dimmer than the tail, and its extent perpendicular to the pulsar’s proper motion is a factor of 4 larger than the tail’s width. Therefore, we are forced to assume that the TS head is unresolved from the pulsar, while the arc might be a CD head at a distance from the pulsar, larger than in the B05 simulations. The corresponding ratio is much larger than 4 in the B05 simulations. The simulations also do not explain the apparent detachment of the axial tail from the pulsar. These discrepancies could be caused by anisotropy of the pulsar outflow, neglected by B05. For instance, if the outflow is mostly equatorial (assuming the pulsar’s spin axis aligned with its space velocity), the flattened TS head should be closer to the pulsar than in the isotropic case.
We should also mention that this interpretation implies a rather large tail’s length, , where is the flow velocity and s is the synchrotron cooling time. The magnetic field just downstream of the TS back boundary can be estimated, for , as
| (1) |
(cf. Kennel & Coroniti 1984). The synchrotron photons with maximum observed energies keV are emitted by electrons with a Lorentz factor
| (2) | |||||
This gives
| (3) |
which exceeds the observed length by two orders of magnitude even at lowest in the inner channel behind the TS, as found by B05. This discrepancy could be explained assuming that the surface brightness of the tail becomes too low at large distances from the pulsar (e.g., because of a decreasing magnetic field) to be seen in these images.
Thus, the interpretation that the axial tail is the freshly shocked PW immediately outside the TS while the outer tails mark the CD surface is not quantitatively consistent with the available simulations. However, such an interpretation cannot be ruled out because those simulations do not take into account the intrinsic anisotropy of the PW.
4.2. The axial tail is a pulsar jet?
Another explanation of the axial tail, which we consider more plausible, is that it is a jet emanating from the pulsar magnetosphere along the spin axis aligned with the pulsar’s motion. The fact that only one jet is seen is not uncommon (PSR B170644 is a vivid example; Ng & Romani 2004), and it can be explained by Doppler boosting (the approaching jet is brighter than the receding one) and/or by intrinsic anisotropy of the polar outflows, or it may be caused by destruction of the forward jet by the ISM ram pressure. The Geminga’s axial tail resembles the southeast jet (“inner counterjet” in Pavlov et al. 2003) of the Vela PWN, which is about twice brighter than the northwest jet in the direction of pulsar’s motion. The Vela’s southeast jet is also somewhat detached from the pulsar (perhaps because the polar outflow becomes visible only beyond a shock). Its projected length, cm, is close to that of the Geminga’s axial tail, the spectra of both structures are very hard, and the ratios of their X-ray luminosities to the pulsar spindown powers are not very different: for the Geminga’s tail and for the Vela’s southeast jet.
If the jet is confined by its own magnetic field, a lower limit on the field can be estimated from the requirement that the electron Larmor radius is smaller than the jet radius, cm, which gives
| (4) |
where is the maximum energy of the X-ray power-law spectrum (cf. Pavlov et al. 2003). It corresponds to the energy injection rate
| (5) | |||||
where is the bulk flow velocity in the jet, and is the ratio of particle and magnetic energy densities. Even this lower limit on is a substantial fraction of the spindown power for a mildly relativistic expected (e.g., for and ), which means that the magnetic field cannot strongly exceed the above lower limit. At such magnetic fields one would expect a jet length
| (6) | |||||
much larger than the observed cm. Therefore, we have to assume that the jet is destroyed or becomes uncollimated well before it loses its internal energy to radiation.
If the axial tail is a pulsar jet, the outer tails could mark an equatorial outflow bent by the ram pressure. We are unaware of theoretical PWN models which include both the PW anisotropy and the ram pressure effects. We, however, expect that the equatorial PW component (which would produce a torus beyond a TS ring around a slowly-moving pulsar) would form a relatively thin shell between the TS and CD surface behind the pulsar, filled by a relativistic plasma with a subrelativistic bulk flow velocity. If the outer tails turn out to be an artifact, we would suggest that most of the PW flows out of the magnetosphere along the spin axis while the equatorial PW component is unusually weak in Geminga (perhaps because of a small angle between the magnetic and spin axes). The arc ahead of the pulsar could be a head of the bent equatorial outflow or remnants of a forward jet crushed be the ISM ram pressure.
To summarize, the Chandra observation has conclusively shown the presence of PWN elements around the Geminga pulsar. With the sparse statistics of the Chandra data and the low spatial resolution of the XMM-Newton images, we cannot establish the nature of the extended emission unambiguously. However, it seems certain that the observed PWN structure implies that the Geminga’s PW is intrinsically anisotropic. Much deeper Chandra observations and modeling of magnetized anisotropic winds from fast-moving pulsars are needed to clarify the nature of this intriguing PWN444 After our work was mostly completed, we became aware of the paper by De Luca et al. (astro-ph/0511185) who reported on the same Chandra data. They found virtually the same properties of the axial tail but failed to notice the arc and the enhancement connecting the arc with the southern outer tail..
References
- (1) Bucciantini, N., Amato, E., & Del Zanna, L. 2005, A&A, 434, 189 (B05)
- (2) Caraveo, P. A., Bignami, G. F., Mignani, R., & Taff, L. G. 1996, ApJ, 461, L91
- (3) Caraveo, P. A., Bignami, G. F., DeLuca, A., Mereghetti, S., Tur, A., & Becker, W. 2003, Science, 301, 1345 (C03)
- (4) Gaensler, B. M., et al. 2004, ApJ, 616, 383
- (5) Gvaramadze, V. 2004, A&A, 415, 1073
- (6) Kargaltsev, O. Y., Pavlov, G. G., Zavlin, V. E., & Romani, R. W. 2005, ApJ, 625, 327
- (7) Kaspi, V. M., Gotthelf, E. V., Gaensler, B. M., & Lyutikov, M. 2001, ApJ, 562, L163
- (8) Kennel, C. F., & Coroniti, F. V. 1984, ApJ, 283, 694
- (9) Ng, C.-Y., & Romani, R. W. 2004, ApJ, 601, 479
- (10) Pavlov, G. G., Teter, M. A., Kargaltsev, O., & Sanwal, D. 2003, ApJ, 591, 115
- (11) Rees, M. J., & Gunn, J. E. 1974, MNRAS, 164, 1
- (12) Sanwal, D., Pavlov, G. G., & Zavlin, V. E. 2004, AAS HEAD meeting 8, #11.06
- (13) Sanwal, D., Pavlov, G. G., & Garmire, G. P. 2005, AAS meeting 206, #43.02
- (14) Stappers, B. W., Gaensler, B. M., Kaspi, V. M., van der Klis, M. & Lewin, W. H. G. 2003, Science, 299, 1372
- (15) Wang, Q. D., Li, Z.-Y., & Begelman, M. C. 1993, Nature, 364, 127
- (16) Weisskopf, M. C., et al. 2000, ApJ, 536, L81
- (17) Wilkin, F. P. 1996, ApJ, 459, L31