Nino Panagia 11institutetext: Space Telescope Science Institute, 3700 San Martin
Dr., Baltimore, MD 21218, USA
11email: panagia@stsci.edu
On the Reionization of the Universe
Abstract
I present first principle model calculations for the reionization of the Universe, which provide simple diagnostics to identify the reionization sources. Within this frame, I also discuss the results derived from the Hubble Ultra-Deep Field observations, and the possible need for future observations with JWST to provide the final answer.
keywords:
cosmology: early universe — cosmology: observations — galaxies: evolution — galaxies: individual (HUDF 033238.7-274839.8)1 Introduction
After the Big Bang the gas in the Universe was fully ionized and stayed such until the recombination rate exceeded the ionization rate at , i.e. when the temperature dropped below . Afterwards, the gas quickly became completely neutral, and the Universe entered its own Dark Age (Rees 1997). We have to wait until the birth of the first stars, galaxies or condensed bodies, formed out of density fluctuations of the Universe, to have ionization sources that were able to ionize matter in the Universe again.
Thus, the reionization of the intergalactic medium (IGM) is the last global phase transition in the Universe, after which individuality prevailed over collective behaviour. Actually, since reionization greatly reduced the opacity of the Universe to ionizing radiation, it is likely to have influenced the formation and evolution of galaxies and other structures in the early Universe (see, e.g., Loeb & Barkana 2001).
The presence of strong Lyman- absorption in the spectra of distant quasars indicates that reionization was completed by (Becker et al. 2001, Fan et al. 2002), while the polarization of the cosmic microwave background (CMB) radiation suggests it may have begun much earlier, at (Spergel et al. 2003).
The ionizing radiation may be produced by fusion, i.e. by early type stars that evolve through a series of nuclear burnings, or by gravitational energy, i.e. through accretion on black holes of various sizes, such as QSOs, AGNs, or remnant BHs from massive star deaths (e.g., Barkana & Loeb 2001). In the case of fusion, since about 7 MeV are released in H-burning, in which 4 H atoms merge to form a He atom, but only 13.6 eV are required to ionize an H atom, it follows that a mass fraction of 8 undergoing fusion is all is strictly needed to re-ionize all hydrogen. However, a realistic treatment of the process must take into account the facts that only a fraction of the Lyman continuum photons may escape from any given source, and that the ionized gas may recombine, and does so at a particularly high rate if the IGM material is clumped. These effects reduce the overall efficiency of the ionization process. Another aspect to keep in mind is that reionization is a statistical process, so that, especially in the presence of strong sources, the reionization of the Universe may have been a rather inhomogeneous process, and observationally the ionization along different lines of sight may be quite different.
Bearing these points in mind, in the following sections I shall quickly review the efforts done in recent years to clarify how reionization occurs in the early Universe, and which are the means to trace this phenomenon in the cosmic evolution and to understand what is the nature of the sources responsible for reionization.
2 First principle model calculations
The theoretical efforts to understand and constrain the time evolution of cosmic reionization sources (e.g., Loeb & Barkana 2001, and references therein; Stiavelli, Fall & Panagia 2004a, hereafter referred to as SFP) have to be confronted with observational identifications of the ionization sources.
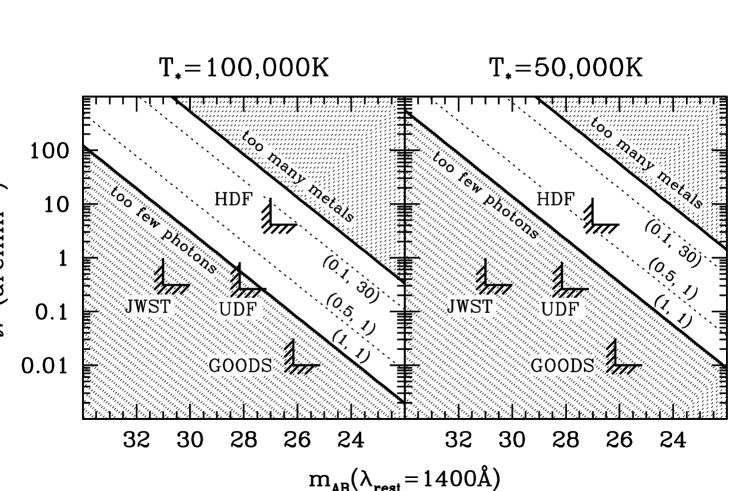
In their seminal study SFP have considered the detectability of the sources responsible for the reionization of the Universe. The main idea is that reionization places limits on the mean surface brightness of the population of reionization sources. SFP defined a family of models characterized by two parameters: the Lyman continuum escape fraction from the sources, and the clumpiness parameter of the intergalactic medium, defined as . The minimum surface brightness model corresponds to a value of unity for both parameters. An upper limit to the surface brightness is obtained by requiring that the reionization sources do not overproduce heavy elements. SFP general approach is applicable to most types of reionization sources, but in specific numerical examples they focus on Population III stars, because these have very high effective temperatures and, therefore, are very effective producers of ionizing UV photons (e.g., Panagia et al. 2003). Figure 1 shows the loci of the mean surface brightness of identical reionization sources as a function of their observable AB magnitude. The left panel refers to Population III sources with effective temperature of K, the right panel to Population II reionization sources with effective temperature K. In both panels, the lower solid line represents the minimum surface brightness model, (1,1), while the upper solid line represents the global metallicity constraint at . The dotted lines represent the (0.5, 1) and (0.1, 30) models. The non-shaded area is the only one accessible to reionization sources that do not overproduce metals. The L-shaped markers delimit the quadrants (i.e., the areas above and to the right of the markers) probed by the GOODS/ACS survey (Giavalisco et al. 2004), the HDF/HDFS NICMOS fields (Thompson et al. 1999, Williams et al. 2000), the Hubble Ultra Deep Field (HUDF; Beckwith et al. 2005) and by a hypothetical ultra-deep survey with JWST.
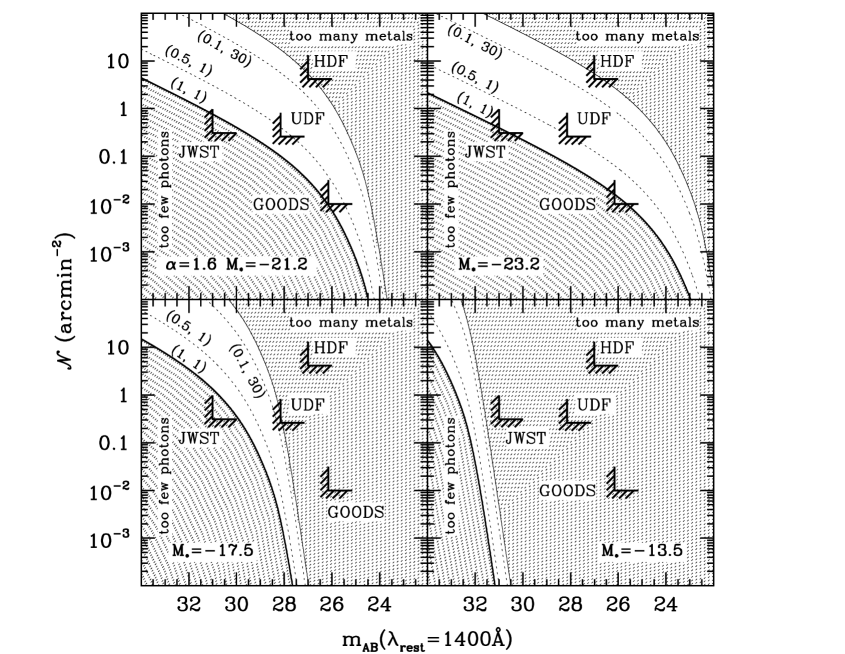
Figure 2 shows the expected cumulative surface density distributions for reionization sources with a variety of luminosity functions. In each panel, the upper solid line represents the global metallicity constraint. The lower solid line represents the minimum surface brightness model, (1,1). The dotted lines give the luminosity function for the (0.5,1) and the (0.1, 30) models. The L-shaped markers delimit the quadrants probed by the GOODS/ACS survey, the HDF and HDFS NICMOS fields, the HUDF, and an ultra-deep survey with JWST, respectively.
From these results it appears that if reionization is caused by UV-efficient, minimum surface brightness sources, the non-ionizing continuum emission from reionization sources will be difficult to detect before the advent of JWST. On the other hand, if the sources of reionization were not extremely hot Population III stars but cooler Population II stars or AGNs, they would be brighter by 1-2 magnitudes and thus they would be easier to detect.
3 As Deep as Ever: the ACS Ultra-Deep Field
The installation on HST of the new ACS camera in 2002 with its tenfold increase of sensitivity opened new possibilities for the exploration of the Universe. A first project to exploit the new capabilities for cosmology was the GOODS Treasury program (Giavalisco et al. 2004) that between August 2002 and May 2003 devoted almost 400 orbits of HST time to observe with the ACS a total area of about 0.1 square degrees in two fields, the Hubble Deep Field North (HDF-N) and the Chandra Deep Field South (CDF-S). One of the primary scientific goals was the study of the evolution of star formation activity in galaxies and the very assembly of galaxies up to redshifts of about 6 (less than 1 billion years past the Big Bang).
While the GOODS project was focused on covering a relatively large area to maximize the statistical significance of their results, an even more ambitious project has been implemented to reach the ultimate frontiers of the Universe with HST, the Hubble Ultra-Deep Field project (HUDF, Beckwith et al. 2005).
The HUDF consists of a single ultra-deep field (412 orbits in total: a million-second-long exposure!)) within the Chandra Deep Field South (CDFS) in the GOODS area. The exposure time was divided among four filters, F435W (B), F606W (V), F775W (i’), and F850LP (z), to give approximately uniform limiting AB-magnitudes near 31 for point sources. The pointing was selected so as to avoid the gaps with the lowest effective exposure times on the Chandra ACIS image of the CDFS, and was designed to include in the field both a spectroscopically confirmed z=5.8 galaxy and a spectroscopically confirmed type Ia SN at z=1.3. The HST observations begun on September 24, 2003, and continued through January 15, 2004. The reduced ACS images and source catalogs were released on March 9, 2004, about seven weeks after the completion of all HST observations. The resulting images are one magnitude deeper in the blue and the visual, and 1.5 magnitudes deeper in the red than the equivalent HDF exposures. The depth in the reddest filters is optimized for searching very red objects – like z=6 galaxies – at the detection limit of the near-infrared image.
The first results are presented in an archival paper (Beckwith et al. 2005) that includes a catalog of more than 10,000 extended objects, the vast majority of which are galaxies. Examination of the catalog for “dropout” sources yields 312 B-dropouts, 79 V-dropouts, and 45 i-dropouts. A comparison of the limiting magnitudes and surface brightnesses with crude estimates of galaxy properties in the early Universe indicates that the field does contain a population of objects at redshifts approaching 7.
In summary, the GOODS project observations (Giavalisco et al. 2004), and the observations of the Hubble Ultra-Deep Field (HUDF; Beckwith et al. 2005) opened a window through which one may hope to recognize distant sources that could provide a direct clue to the reionization process. The available data have then extended the searches to by the drop-out techniques (Dickinson et al. 2004, Giavalisco et al. 2004, Bunker et al. 2004, Yan & Windhorst 2004, Bouwens et al. 2004b, Eyles et al. 2005) and narrow-band surveys (Rhoads et al. 2004, Stern et al. 2005, Taniguchi et al. 2005). Yet measures of the luminosity functions remain uncertain (Yan & Windhorst 2004, Bouwens et al. 2004a), and the identification of the reionization sources is still just a possibility (e.g., Stiavelli, Fall & Panagia 2004b). This is because, even with the exquisite images of the HUDF, it is hard to identify and characterize sources at redshifts appreciably higher than 6, which are crucially important to properly define and understand the processes associated with reionization.
4 Detecting possible Reionization Sources
The general method developed by SFP is applicable to a wide variety of reionization sources. For specific predictions, however, it is convenient to consider sources made either of metal-free Population III stars, with an effective temperature of K, or metal-weak Population II stars, with an effective temperature of K (Stiavelli, Fall, & Panagia 2004b). These effective temperatures are nearly independent of the stellar initial mass function, provided only that it extends beyond about 30 . The metallicity dividing these stellar populations is roughly . Since Population III stars are hotter than Population II stars, they produce more ionizing photons for a given flux at longer wavelengths. In this sense, Population III stars are also more efficient ionizers than active galactic nuclei (AGN).
Figure 3 shows the expected cumulative surface density of reionization sources as a function of their apparent AB magnitude in the non-ionizing UV continuum at a rest-frame wavelength of 1400 Å (Stiavelli, Fall, & Panagia 2004b). Here it is assumed that the comoving volume density of the sources is constant over the range of redshifts spanned by -band dropouts in the HUDF and GOODS (see below). The luminosity function of the sources is assumed to have the Schechter form, parameterized by its knee and slope . For reference, the Lyman-break galaxies at have and (Steidel et al. 1999, Yan et al.2002). These are the parameters adopted for the top panels of Figure 3. The middle panels have a brighter knee (), and the bottom panels have a steeper slope (). The predictions in the left panels are for Population III stars; those in the right panels are for Population II stars.
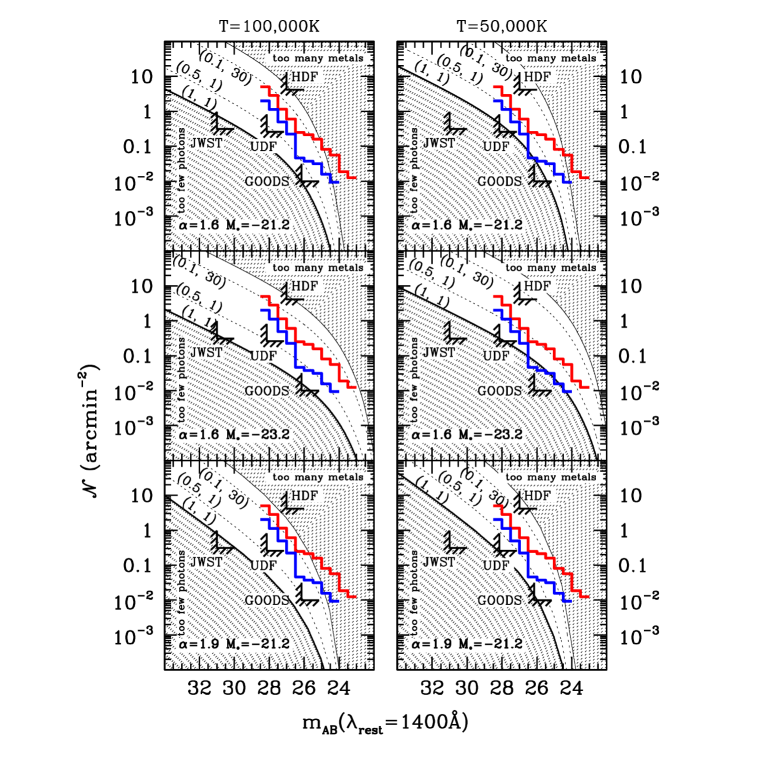
The theoretical predictions (Stiavelli et al. 2004b) can be compared with the observations from the HUDF and GOODS projects. The analysis is based on the -band dropouts ( galaxies) identified by Bunker et al. (2004). The magnitudes and colors of the objects were measured in apertures 0.5 arcsec in diameter. The HUDF catalog includes 53 objects with and 22 with down to a limiting magnitude of at , where the incompleteness is only 2% (Table 1 of Bunker et al. 2004). Stiavelli et al.(2004b) analyze the and subsamples separately. The latter may miss some high-reshift objects, but it should be nearly free of contamination by low-redshift objects.
Combining these HUDF observations with wider and shallower, but otherwise similar, observations from the GOODS survey one obtains more reliable estimates of the bright part of the surface density-magnitude relation. In particular, the GOODS observations were used brightward of and the HUDF observations faintward of this magnitude. The resulting cumulative surface density-magnitude relation is shown by the stepped lines in each panel of Figure 3. The upper, red line refers to the color cut, while the lower, blue line refers to the more stringent color cut. One expects the true relation to lie between the two stepped lines. Both of these relations appear generally compatible with the predictions, especially when allowance is made for the large statistical uncertainties at the bright ends. The observed relation extends into the shaded region at the bright end, but we have checked that this does not violate the global metallicity constraint, which pertains to the mean surface brightness when integrated over all magnitudes. It appears that the integrated surface brightness of the objects brighter than our limiting magnitude () is and 26.7 mag arcsec-2, respectively, for the and subsamples. These are consistent with the predicted minimum surface brightness and 27.2 mag arcsec-2 for reionization by Population III and Population II sources, respectively, and a redshift interval (SFP).
5 HUDF-JD2, a powerful source at z
In order to provide the multi-waveband information needed to search for galaxies at even higher redshifts and to explore their nature individually, one can use combined ultra-deep images of faint galaxies taken by both the Hubble Space Telescope and the Spitzer Space Telescope. In particular, the HUDF observations (Beckwith et al. 2005, Thompson et al. 2005), which represent the deepest images of the Universe at optical (, , , and bands; HST/ACS) and near-infrared (, ; HST/NICMOS) wavelengths, combined with the VLT and Spitzer/IRAC observations obtained by the GOODS project at NIR (; ESO/VLT) and mid-infrared (3.6-24 m; Spitzer/IRAC+MIPS) wavelengths (B. Vandame et al. 2005, in preparation, I. Labbé et al. 2005, in preparation, M. Dickinson et al. 2005, in preparation), are well suited to accomplish this aim.
Analyzing those data, Mobasher et al. (2005) searched for very red galaxies with and no detection at wavelengths shorter than (i.e. band dropouts). They found one source that satisfies the band dropout criteria, is well detected in the K-band (ISAAC) and in all four IRAC channels (3.6, 4.5, 5.8 and 8 m) and appears to be at a redshift or higher: HUDF033238.7-274839.8, hereafter referred to as HUDF-JD2.
The presence of a clear Balmer break in the observed SED of HUDF-JD2 (see Fig. 4) confirms its high redshift identification and reveals a post-starburst population. From their best-fit models, Mobasher et al. (2005) derive a photometric redshift of and a bolometric luminosity of L L⊙ (for a cosmology with km s-1 Mpc-1, and ). They also estimate the mass in stars is M M⊙ and that the stars were formed at redshifts higher than z9. Moreover, HUDF-JD2 had to form the bulk of its stars very rapidly, on time scales Myr, so that the subsequent evolution was essentially passive. A stringent upper limit to the starburst age is set by the photometric redshift of HUDF-JD2, which corresponds to a time when the Universe was only 830 Myr old. Adopting this prior, Panagia et al. (2005) infer that the age of the stellar population in HUDF-JD2 is likely to be bracketed between 350 and 650 Myr. These ages correspond to redshifts of galaxy formation between 10 and 20. The estimated reddening is quite modest, with at 95% confidence limit. The best-fit model SED also provides estimates of the overall metallicity of the galaxy, which is bracketed within the interval , i.e. between and , so that a fiducial value of has been adopted.
6 IMPLICATIONS FOR REIONIZATION
Reionization is a process that depends on the UV output of galaxies integrated over the time interval when they are active UV sources. In this respect, HUDF-JD2 is a promising reionization source in that, according to the models, its integrated Lyman continuum photon flux is about photons that had to ionize the neutral hydrogen gas within a comoving volume of about Mpc3, the exact volume depending on the specific redshift (within the range ; see below) at which H was fully ionized. For a comoving hydrogen density of atoms Mpc-3 (e.g., Spergel et al. 2003), it appears that the produced Lyman continuum photons outnumber the H atoms by almost an order of magnitude and that, therefore, a complete reionization is a real possibility (Panagia et al. 2005). However, as pointed out in the introduction, a realistic treatment of this process must take into account the facts that only a fraction of the Lyman continuum photons may escape from the source, and that the ionized gas may recombine, especially if the IGM material is clumped, because both effects reduce the overall efficiency of the ionization process.
Panagia et al. (2005) have approached this problem by using the extensive set of model calculations made by SFP. However, all cases studied by SFP are based on the implicit assumption of a “snapshot” of a statistical assembly of cosmic sources, which may have formed at different epochs and were efficient UV radiation emitters over different time intervals, but, on average, constituted a steady supply of ionizing photons over the chosen redshift interval. The situation of HUDF-JD2 is different. HUDF-JD2 is a single, powerful source for which both the birth time and subsequent evolution are constrained by the observed SED. In particular, we know that the galaxy formed stars and was very bright in its first 100 Myr of age, and essentially was evolving passively afterwards, thus declining in luminosity with time. The effects of this type of evolution can be included by adopting an effective ionization parameter , in which the ionizing photon flux is averaged over the 100 Myr of starburst activity whereas the instantaneous source luminosity is declining as the galaxy is aging (see Figure 5). It turns out that the effective ionization parameter appropriate for HUDF-JD2 is a factor of about 5 higher than it is for a 100,000 K black-body. This is because the integrated HUDF-JD2 output in ionizing radiation is high whereas its presently observed UV flux has considerably decreased as a consequence of HUDF-JD2 passive evolution.
The corresponding constraints to the surface density of possible reionization sources as a function of the apparent AB magnitude are shown in Figure 6. We see that HUDF-JD2 as observed, having a J-band magnitude of and being one source in a field of 6.25 square-arcminutes (i.e. the HUDF area covered with NICMOS observations), lies well above the locus of minimum surface brightness. It appears that HUDF-JD2 by itself could be responsible for the reionization of the IGM in its region of Universe if the escape fraction of ionizing radiation is higher than and the IGM gas is uniformly distributed, or conversely if the clumping factor is as high as 20 but the bulk of the ionizing radiation is able to escape from the galaxy. Allowance for some extinction correction and, more importantly, for the presence of unseen fainter companions, would shift the point up by a factor of 5-6, thus making it capable of ionizing its region entirely even for a low escape fraction, , and high clumping factor, (see Panagia et al. 2005 for details).
It is interesting to note that the four -dropout sources detected and studied by Eyles et al. (2005) in the HST/ACS GOODS images of the Chandra Deep Field South, may indeed be representatives of the “second brightest” galaxies in the ladder of the luminosity function. Actually, their measured magnitudes are about 1.5-2 mag fainter than measured for HUD-JD2. All of these sources are found to have z, stellar masses M⊙, ages of Myr and implied formation redshifts (Eyles et al. 2005). The presence of HUD-JD2 together with these additional bright sources suggest that the reionization of the Universe may have been dominated by massive galaxies that, rather unexpectedly, were able to form during the early evolution of the Universe.
7 DISCUSSION AND CONCLUSIONS
It appears that HUDF-JD2 may indeed be capable of reionizing its portion of IGM (i.e. the gas within a volume defined by the subtended solid angle of the HUDF-NICMOS field and the redshift of complete reionization, z), possibly with the help of unseen fainter companions, starting the process at a redshift as high as z. Regardless of whether HUDF-JD2 did ionize its cell of Universe entirely, it is certain that it had the power to appreciably ionize it at high redshifts(), so as to account for WMAP findings ( at z; Spergel et al. 2003).
Although the presence of a cluster of galaxies and the assumptions about their properties are somewhat speculative, we would like to stress that these are predictions that will be possible to confirm or reject once the James Webb Space Telescope (JWST; e.g., Stiavelli et al. 2004c), currently due to be launched in mid-2013, will come into operation. According to the model calculations by Panagia et al. (2003, and in preparation), sources like HUDF-JD2 and its analogs at higher redshifts will be easy to study spectroscopically because in their active star formation phases, they will have intrinsically high luminosities providing fluxes as high as 150 nJy in the near and mid infrared. Fluxes at these levels are expected to be detectable with the JWST-NIRSpec spectrograph at a resolution of with a S/N ratio of 10 in 105 seconds exposures (e.g., Panagia et al. 2003, Stiavelli et al. 2004c). Therefore, with the advent of JWST it will be possible to fully characterize these early Universe sources, so as to clarify conclusively the processes of galaxy formation and the reionization of the Universe.
References
- [Barkana & Loeb (2001)] Barkana, R, & Loeb, A. 2001, PhR, 349, 125
- [Becker et al. (2001)] Becker, R.H., et al. 2001, AJ, 122, 2850
- [Beckwith et al. (2005)] Beckwith, S., et al. 2005, AJ, in press
- [Bouwens et al. (2004a)] Bouwens, R.J., et al. 2004a, ApJ, 606, L25
- [Bouwens et al. (2004b)] Bouwens, R.J., et al. 2004b, ApJ, 616, L79
- [Bunker et al. (2004)] Bunker, A.J., Stanway, E.R., Ellis, R.S. & McMahon, R.G. 2004, MNRAS355, 374
- [Dickinson et al. (2004)] Dickinson, M., et al. 2004, ApJ, 600, L99
- [Eyles et al. (2005)] Eyles, L., et al. 2005, MNRAS, in press [astro-ph/0502385]
- [Fan et al. (2002)] Fan, X., et al. 2002, AJ, 123, 1247
- [Giavalisco et al. (2004)] Giavalisco, M., et al. 2004, ApJ, 600, L93
- [Loeb & Barkana (2001)] Loeb, A. & Barkana, R. 2001, ARAA, 39, 19
- [] Mobasher, B, et al. 2005, ApJ, in press [astro-ph/0509768]
- [Panagia et al. (2003)] Panagia, N., et al. 2003, RMxAC, 17, 230
- [Panagia et al. (2005)] Panagia, N., et al. 2005, ApJ, 633, L1
- [Rees (1997)] Rees, M.J. 1997, in “The Hubble Space Telescope and the High Redshift Universe”, ed. N.R. Tanvir, A. Aragon-Salamanca & J.V. Wall, (Singapore: World Scientific), p. 115
- [] Rhoads, J. E., et al. 2004, ApJ, 611, 59
- [Spergel et al. (2003)] Spergel, D.N., et al. 2003, ApJS, 148, 175
- [Steidel et al. (1999)] Steidel, C.C., Adelberger, K.L, Giavalisco, M., Dickinson, M., & Pettini, M. 1999, ApJ, 519, 1
- [] Stern, D., et al. 2005, ApJ, 619, 12
- [Stiavelli et al. (2004a)] Stiavelli, M., Fall, S.M. & Panagia, N. 2004a, ApJ, 600, 508 (SFP)
- [Stiavelli et al. (2004b)] Stiavelli, M., Fall, S.M. & Panagia, N. 2004b, ApJ, 610, L1
- [Stiavelli et al. (2004c)] Stiavelli, M., et al. 2004c, JWST Primer, Ver. 1.0 (Baltimore: STScI), http://www.stsci.edu:8083/jwst/docs/handbooks
- [] Taniguchi, Y., et al. 2005, PASJ, 57, 165
- [Thompson et al. (1999)] Thompson, R., et al. 1999, AJ, 117, 17
- [Thompson et al. (2005)] Thompson, R., et al. 2005, AJ, 130, 1
- [Williams et al. (2000)] Williams, R.E., et al. 2000, AJ, 120, 2735
- [Yan et al. (2002)] Yan, H., Windhorst, R.A., Odewahn, S.C. & Cohen, S.H. 2002, ApJ, 580, 725