A dynamical model for the extra-planar gas in spiral galaxies
Abstract
Recent H I observations reveal that the discs of spiral galaxies are surrounded by extended gaseous haloes. This extra-planar gas reaches large distances (several kpc) from the disc and shows peculiar kinematics (low rotation and inflow). We have modelled the extra-planar gas as a continuous flow of material from the disc of a spiral galaxy into its halo region. The output of our models are pseudo-data cubes that can be directly compared to the H I data. We have applied these models to two spiral galaxies (NGC 891 and NGC 2403) known to have a substantial amount of extra-planar gas. Our models are able to reproduce accurately the vertical distribution of extra-planar gas for an energy input corresponding to a small fraction (4 %) of the energy released by supernovae. However they fail in two important aspects: 1) they do not reproduce the right gradient in rotation velocity; 2) they predict a general outflow of the extra-planar gas, contrary to what is observed. We show that neither of these difficulties can be removed if clouds are ionized and invisible at 21 cm as they leave the disc but become visible at some point on their orbits. We speculate that these failures indicate the need for accreted material from the IGM that could provide the low angular momentum and inflow required.
keywords:
galaxies: kinematics and dynamics — galaxies: individual: NGC 891, NGC 2403 — galaxies: haloes — galaxies: ISM — galaxies: evolution — ISM: kinematics and dynamics1 Introduction
The evolution of spiral galaxies is influenced both internally by star formation and externally by the environment. Whether the former or the latter mechanism is dominant is difficult to determine. Star formation is responsible for blowing gas outside the galactic discs, perhaps polluting the Intergalactic Medium (IGM) with metals (e.g. McCarthy, van Breugel & Heckman, 1987). Outflows of gas from galactic discs with velocities of the order of are observed both in the neutral (e.g. Kamphuis, Sancisi & van der Hulst, 1991) and the ionised phase (e.g. Fraternali, Oosterloo & Sancisi, 2004a). On the other hand, accretion of unpolluted material from the IGM is predicted by chemical evolution models to solve the so-called G-Dwarf problem in the Milky Way (e.g. Rocha-Pinto & Maciel, 1996). The low metallicities of some of the High Velocity Clouds (HVCs) (Wakker et al., 1999) suggest that cold material is indeed accreted by spiral galaxies like our own (Oort, 1970).
In the last years, the study of the connection between galactic discs and haloes has flourished due to the collection of new high-sensitivity data at different wavelengths. Deep H observations have revealed the presence of extended layers of diffuse ionised gas (DIG) around edge-on spiral galaxies (e.g. Hoopes, Walterbos & Rand, 1999). X-ray observations with the new satellites have shown the presence of hot gas at distances of tens of kpc from the plane of galactic discs (e.g. Wang et al., 2001). H I observations of several spiral galaxies have revealed extended thick layers or haloes surrounding the galactic discs (Swaters, Sancisi & van der Hulst, 1997; Matthews & Wood, 2003). The kinematics of this extra-planar gas is characterized by: 1) a decrease in rotation velocity in the vertical direction (Swaters, Sancisi & van der Hulst, 1997; Fraternali et al., 2005); 2) vertical motions from and towards the disc (Boomsma et al., 2005); 3) a possible general radial inflow (Fraternali et al., 2001).
These studies show that the extra-planar gas is likely to be the result of a complex exchange of gas between the disc to the halo regions. In the galactic fountain scheme, gas is pushed up by stellar activity, travels through the halo and eventually falls back to the disc (Shapiro & Field, 1976; Bregman, 1980). Recently, Collins, Benjamin & Rand (2002) presented a ballistic model of a galactic fountain and compared it with H long-slit observations of two edge-on galaxies: NGC 5775 and NGC 891. They found a disagreement, especially for NGC 891, between the rotational velocities above the plane predicted by their model and those derived from the data. Other studies have concentrated on the modelling of the multi-phase ISM (Rosen & Bregman, 1995; Avillez, 2000), the cooling of the hot coronal gas (Corbelli & Salpeter, 1988) and the effect of turbulence (Struck & Smith, 1999).
Some authors have tried to model the extra-planar gas as a stationary medium in hydrostatic equilibrium (Benjamin, 2002; Barnabè et al., 2005). This approach leads to solutions that can reproduce the observed gradient in the rotation velocity above the plane if the pressure of the medium does not depend on the density alone (Barnabè et al., 2005). However, the temperatures of the extra-planar (hydrostatic) gas are of the order of 105 K and it is unclear how this medium can be related to cold neutral gas.
Here, we present a new model for the neutral extra-planar gas as the result of a continuous galactic fountain flow. We use a different strategy from the previous attempts mentioned above. We directly compare our dynamical models with H I observations (data cubes) by producing, as an output of the model, a pseudo-data cube with the same total flux and resolution as the data. The direct comparison with the observations is crucial because it removes the intermediate steps of the data analysis such as the derivation of rotation curves of the extra-planar gas or the separation of the halo gas from the disc gas (see Fraternali et al., 2002) that can introduce significant errors.
We apply this model to the observations of two spiral galaxies that currently provide the best examples of detection of extra-planar gas: the edge-on galaxy NGC 891 (Section 3) and NGC 2403, which is seen at along the line of sight (Section 4). The study of galaxies viewed at different inclination angles is essential to remove projection effects and obtain the full three-dimensional picture of the distribution and kinematics of the extra-planar gas. The data for an edge-on galaxy like NGC 891 give information on the extent of the gaseous halo and the rotation velocity of the gas (Swaters, Sancisi & van der Hulst, 1997). In addition, the study of a galaxy at intermediate inclination like NGC 2403 provides information on non-circular (inflow/outflow) motions of the extra-planar gas (Fraternali et al., 2001).
2 The model
We have modelled the extra-planar gas in a spiral galaxy as a continuous flow of material from the disc to the halo. Individual gas clouds are modelled as non-interacting particles that are pushed up from the plane of the disc. The trajectory of each particle is integrated in the galactic potential until it falls back to the disc. Runs of the models were also performed in which the particles cross the plane once but are stopped on their second passage. Positions and velocities along these trajectories are projected along the line of sight at each time interval, producing a pseudo-cube of sky positions and velocities to be compared with the H I data cubes.
2.1 The potential
The galactic potential and forces were evaluated numerically on a grid in the meridional plane, with cells on an edge close to the plane and on a side further out. The volume densities of both the stellar and the gaseous components are given by
| (1) |
where is the central density, and are the scale length and scale height of the disc, and is the vertical density distribution, either an exponential or a sech2 law. We assume that the scale height is independent of .
The first part of the r.h.s. of eq. 1 is proportional to the surface density of a razor-thin exponential disc. By modelling the disc as an infinitely flattened homoeoid, one can show (Cuddeford, 1993) that its potential is
| (2) |
where is the central surface brightness, is the modified Bessel function of zeroeth order, and The potential of the thick exponential disc (eq. 1) is
| (3) |
where is as in eq. 2 but with
The ellipsoidal components (bulge and dark matter halo) have been modelled using a double power law density profile (Dehnen & Binney, 1998):
| (4) |
where is the central density, is the scale length, and are the inner and outer slopes respectively, and with the axis ratio, related to the eccentricity by .
The potential and forces of the ellipsoidal components are calculated using formulae (2-84b) and (2-88) in Binney & Tremaine (1987) with the substitution of the density with that shown in our eq. 4.
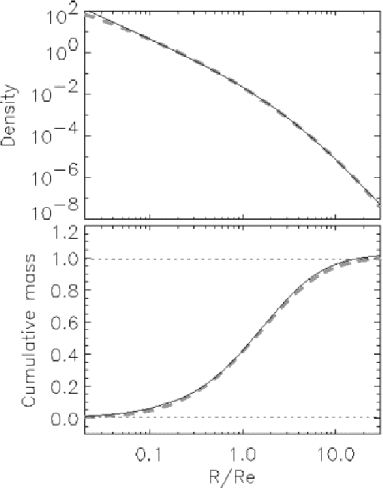
The double-power-law profile allows us to model dark matter (DM) haloes with different shapes such as pseudo-isothermal, and ; NFW profile, and (Navarro, Frenk & White, 1997); Hernquist profile, and (Hernquist, 1990). We have also used these profiles to model bulges that satisfy de Vaucouleurs’ -law (de Vaucouleurs, 1948). The associated luminosity density is given by Young (1976), and we have fitted this density with the double power law profile selecting a radial range that encloses 99% of the light. The best fit, for and integer numbers, gives , , , where is the effective radius of the -law. Solid lines in Fig. 1 show this fit, while the dashed grey lines show the profile.
For each galaxy we have constructed three mass models: 1) maximum-light (stellar disc + bulge); 2) maximum spherical DM halo; 3) maximum flat DM halo. In the first mass model, the stellar disc and bulge contribute maximally to the rotation curve; in the second and third models, the stellar mass-to-light ratio is set to the minimum plausible value (see Sections 3.1 and 4.1). The parameters of the dark matter haloes are then tuned to reproduce the rotation curve. The eccentricity is in model 2 and (axis ratio ) in model 3.
2.2 Initial conditions
The orbits of the particles are integrated in the plane and then uniformly distributed in the azimuthal angle . Thus each orbit is used to follow an ensemble of clouds that are launched from locations lying around a circle in the plane. The integration is performed in cartesian coordinates using the fourth-order Runge-Kutta method. At each interval , the positions and the velocities of the particles are projected along the line of sight. We used a variable time step with upper value yr.
Initially, the particles are considered to be gyrating around circular orbits in the plane in such a way that they have isotropic random velocities with dispersion . Then the particle receives a kick velocity in a direction that is chosen at random from an axisymmetric distribution. The magnitude of has probability distribution
| (5) |
where is the angle between the direction of the kick and the normal to the galactic plane. An natural choice for is
| (6) |
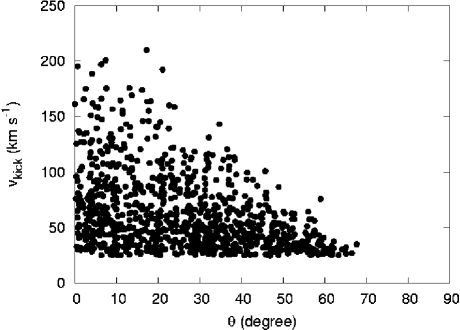
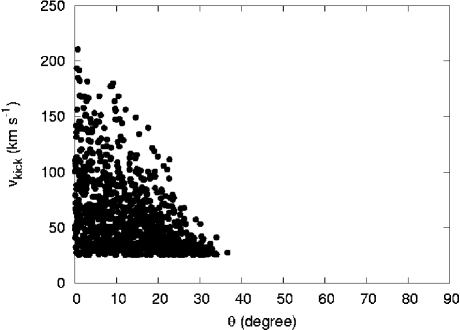
where and the characteristic kick velocity are parameters to be determined. The highest velocities are confined to a cone around the normal to the galactic plane, and the width of this cone is set by the parameter . The functional shape of determines the thickness of the gas halo and has to be constrained by the observations (Section 3.2). In order to avoid numerous low-velocity integrations, we have included a lower cut-off for kick velocities . Fig. 2 shows the resulting distributions of kick velocities as a function of with and two choices of (, top panel and , bottom panel). In section 3.2 we show how to constrain the value of from the data. It turns out that high values () are required leading to a fairly collimated flux.
Stochastic acceleration processes sometimes produce a tail of particles that extends to large , which is absent if is taken to be the Gaussian function (6). Therefore we examine the possibility that tends to a power law at large . Specifically, we present results for the choice
| (7) |
where is a characteristic velocity that we identify with the velocity dispersion of the ISM, , and the slope and the cut-off velocity are free parameters.
2.3 Outflow rate and halo mass
In our model, the flow of material escaping the disc is considered constant throughout the life of the galaxy. This is a reasonable assumption for a normal spiral like the Milky Way given the regularity of the star formation history (e.g. Rocha-Pinto et al., 2000). Therefore, at all times, there will be a constant number of particles (mass of gas) in the halo. Of these, the number launched between and and with kick velocities between and will be:
| (8) |
where is number of particles (outflow rate) generated per unit time and area at radius with kick velocity , and is the travel time for these particles. We can re-write the outflow rate
| (9) |
where is the distribution in eq. 5 normalized such that .
Since the causes of gas outflows are, presumably, strong stellar winds and supernova explosions, we assume that the outflow rate is proportional to the star formation rate (SFR). The latter can be taken proportional to the gas surface density to a power (Schmidt law) and therefore:
| (10) |
where 1.3 (Kennicutt, 1989) and is a constant that ultimately represents the efficiency of the transfer of kinetic energy from the stellar activity to the halo gas. We can relate this parameter to the total mass of the halo gas. If we integrate eq. 8 over the whole galaxy, we find that the total mass of the gaseous halo is
| (11) |
where is the mass of the single particle and Rcut is the cut-off radius of the SF activity in the disc. Therefore, for any given we obtain a value for and an outflow rate (eq. 10) in proper units.
2.4 Comparison to the observations
The strategy of this study is to compare our models with H I observations of spiral galaxies showing the presence of extra-planar gas. In the model, at each time interval , positions and velocities of the particles are projected along the line of sight for a specified inclination of the galaxy. From the projected velocities we construct a model cube of particles that can be compared with the H I data cube. The total flux in the model cube is normalized to the total H I mass of the galaxy. The spatial and velocity resolutions are smoothed to those of the data. A disc component is added to the output of the model with a density profile derived from the data and a mass , where is the total H I mass of the galaxy. The number of particles used in the simulation is on average per beam. This, in the case of NGC 891, implies a typical particle mass of , two orders of magnitude below the observational detection limit. Therefore, our model is smooth and different simulations do not show significant fluctuations with respect to each other.
The surface density in eq. 10 has been derived, for NGC 891, considering both the atomic and molecular gas. The distribution of neutral gas was derived from the H I data whilst that of H2 was taken from CO observations (Sofue & Nakai, 1993). The fit of the total gas density with an exponential profile gave =5.0 0.5 kpc and the total mass M, in good agreement with the total mass that one gets using the H I and CO fluxes: , the latter values referring to two different choices for the CO/H2 conversion factor (Sofue & Nakai, 1993). For NGC 2403, we have consider only atomic gas, being the dominant component and used the exponential fit to the H I surface density given in Fraternali et al. (2002).
3 Application to NGC 891
The (Sb) spiral galaxy NGC 891 is one of the best known and extensively studied nearby edge-on galaxies. We assumed a distance of Mpc (van der Kruit & Searle, 1981), which leads to a luminosity . The disc of NGC 891 shows intensive star formation at a rate SFR (Popescu et al., 2004). The halo region has been studied at various wavelengths and shows a variety of components from radio continuum (Allen, Sancisi & Baldwin, 1978) to hot X-ray emitting diffuse gas (Bregman & Pildis, 1994). NGC 891 is also considered to be very similar to the Milky Way (van der Kruit, 1984).
NGC 891 has been studied in HI several times with ever increasing sensitivity (e.g. Sancisi & Allen, 1979; Rupen, 1991; Swaters, Sancisi & van der Hulst, 1997) and most recently with very deep observations (with more than 200 hours of integration) obtained with the Westerbork Synthesis Radio Telescope (WSRT) (Oosterloo, Fraternali & Sancisi, 2005). We use here these new data at 28′′ (1.3 kpc) resolution. The total H I map, rotated counter-clockwise, is shown in Fig. 4 (upper left panel). The distribution of neutral gas in the disc of NGC 891 is not symmetric, being more extended in the South-West side (on the right of the rotated image). The location of this extension is not known (it is probably not in the line of nodes), so in deriving the rotation curve and studying the kinematics, it is often neglected. These new WSRT observations show very clearly the presence of extended extra-planar emission, much more extended that in the previous observations (Swaters, Sancisi & van der Hulst, 1997). As shown both by Swaters, Sancisi & van der Hulst (1997) and Fraternali et al. (2005), this emission cannot be explained by projection of either a flare or a line-of-sight warp, but it has to come from a thick component of neutral gas surrounding the thin disc and lagging behind it in rotation. The extent and the lag of the halo gas are the key constraints on our model.
3.1 Mass models for NGC 891
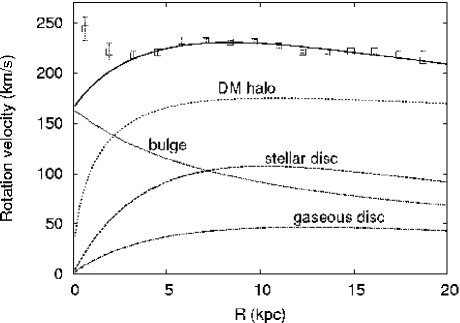
The rotation curve of NGC 891 (Fig. 3) has been derived using an envelope tracing technique (e.g Sancisi & Allen, 1979) applied to the north-west side of the galaxy (details in Fraternali, in preparation). The velocity rises very steeply in the inner parts of the galaxy (), this phenomenon may be evidence of a fast rotating inner ring or, perhaps non-circular motions related to an inner bar (see Garcia-Burillo & Guelin, 1995). Due to these uncertainties in interpretation of the inner points of the rotation curve we have excluded them in our fitting.
| Model | |||||||||||
|---|---|---|---|---|---|---|---|---|---|---|---|
| (kpc) | (kpc) | (kpc) | (kpc) | ||||||||
| maximum light | 3.7 | 4.4 | 1.05 | 6.3 | 3.3 | 0.8 | 4.0 | 0 | 2 | 0 | |
| maximum round DM halo | 1.5 | 4.4 | 1.05 | 3.5 | 3.3 | 0.8 | 5.0 | 1 | 3 | 0 | |
| maximum flat DM halo | 1.5 | 4.4 | 1.05 | 3.5 | 3.3 | 0.8 | 6.0 | 1 | 3 | 0.95 |
We decomposed the potential of NGC 891 into four components: two discs (stellar and gaseous), the potentials of a bulge and a DM halo. For the stellar component we have used the photometry and disc-bulge separation of Shaw & Gilmore (1989), who used the same optical data as van der Kruit & Searle (1981). They found no significant difference in accuracy between fits with two or three components (the latter with thin thick discs). Therefore we considered just two components, a relatively thick disc () and a flattened -law bulge. This, as Shaw & Gilmore (1989) clearly state, is not a perfect description of the light distribution in NGC 891 but it is accurate enough for our purposes. Indeed (see Section 3.4) our main conclusions do not depend on the shape of the potential.
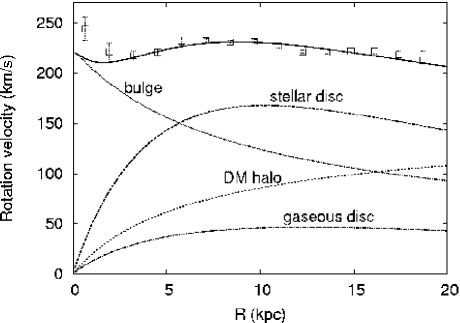
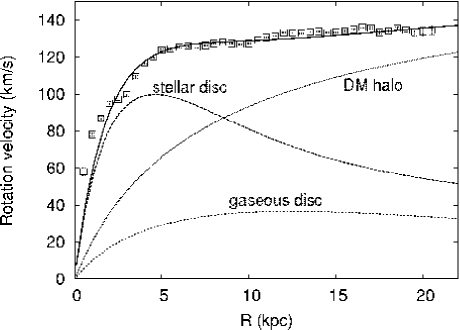
Fig. 3 shows the fits to the rotation curve of NGC 891 obtained with two of the adopted mass models. The first (top panel) is a maximum light (disc+bulge) model, in which the highest possible mass-to-light ratio is assigned to the luminosity density. The ratios obtained for the stellar disc and the bulge are, 3.7 and 6.3, respectively. The disc and bulge are dominant all the way out to the last point of the rotation curve. The dark-matter halo is pseudo-isothermal, having inner and outer slopes of and , respectively (see eq. 4).
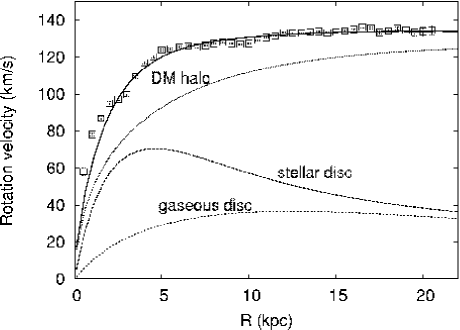
The bottom panel of Fig. 3 shows the fit to the rotation curve with a maximum-halo model. In this case the ratios were fixed to 1.5 and 3.5 respectively for disc and bulge. We chose these values as the minimum allowed for two stellar populations of mean ages of about 2 and 4-5 Gyr, for disc and bulge respectively (Charlot, Worthey & Bressan, 1996). In order to reproduce the rotation curve in this case we need to use a more peaked DM halo of a NFW type (1, 3). The DM halo dominates everywhere outside . The model shown in Fig. 3 is for a round halo (). We also constructed a model for a flat halo (, ), where the fit to the rotation curve is essentially identical to that for a round halo. The parameters of the mass models of NGC 891 are reported in Table 1.
3.2 Model constraints
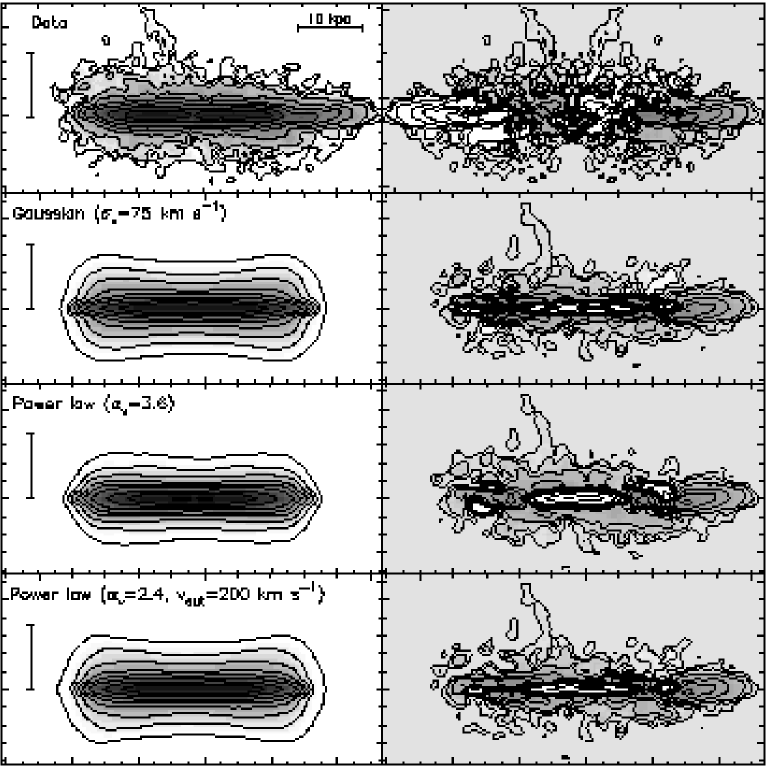
The most striking evidence for extra-planar gas in NGC 891 is given by the total HI map (Fig. 4, upper left panel; see also Fraternali et al. (2005)) and our first step is to reproduce the observed vertical distribution. Hence, we have explored the parameter space to obtain the right amount of high-latitude gas. The parameters of our model that have a critical impact are: 1) the functional form of (eq. 5) with its parameters (, and ); 2) the mass of the halo gas (eq. 11); 3) the cut-off radius of star formation (eq. 11).
To constrain these parameters we have used an iterative method. We have constructed total maps with different values of these parameters, subtracted them from the total H I map of NGC 891 and minimized the residuals in the halo region only (at ). For each of the three functional forms of , the lower three panels in the left column of Fig. 4 show the best fits to total maps that can be obtained by adjusting the free parameters. The parameters of these models are given in Table 2. In each case the cut-off radius for SF is and the potential is that of the maximum-light model. Hence the models differ only in the distribution of kick velocities.
The upper right panel of Fig. 4 shows the residuals obtained just mirroring the data about the minor axis and subtracting it from the original total H I map. Clearly, no axisymmetric model could produce smaller residuals than these. The lower three panels of the right column show the residuals produced by the model whose total H I map is shown on the left. In the plane there are systematic differences between data and models; these residuals reflect both inhomogeneities in the plane and uncertainties in the shape of the radial H I profile. Inevitably, the model does not match the outer part of the disc on the right (originally South-West) side of the galaxy.
Our models tend to produce a flaring shape of the total map because particles launched from larger radii can reach higher distances from the plane. Below the plane (South-East in the original orientation), the data show a hint of a flare, but the effect is weaker in the data than in most models. This flare can be reduced by increasing the parameter in eq. 10. The optimum value was found to be close to 1.3. However, overall the residuals are insensitive to , so for NGC 891 we henceforth simply set . In Section 4.4 we vary in an attempt to account for gas at very peculiar velocities near the centre of NGC 2403.
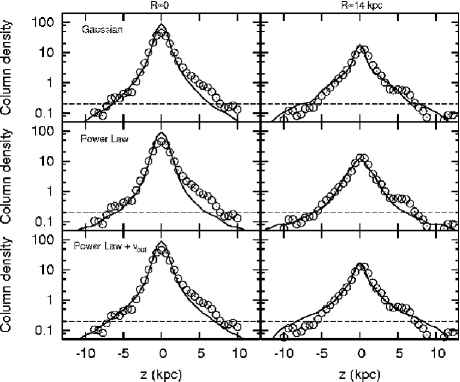
In Fig. 5 we plot density profiles perpendicular to the plane, the vertical ordering of the models being as in Fig. 4. The left-hand profiles are along the minor axis, while the right panels are along the parallel line that cuts the major axis to the left of the centre in Fig. 4. Circles show the data, and the column-density scale is in . The dashed lines show the last contour level in the total H I map.
| Model | ||||
|---|---|---|---|---|
| Gaussian | 75 | - | 2.0 | |
| Power Law | - | 3.6 | 3.0 | |
| Power Law + vcut | - | 2.4 | 2.3 | 200 |
The best results are obtained with the Gaussian and the Power Law (PL)vcut models. The PL model without a velocity cut-off does not produce much extra-planar gas above the detection limit, instead it produces a long tail of emission below this limit (partially visible in Fig. 5). This is why the total map of the PL model appears thinner than the others and there are substantial residuals. Note however that a lower value of would have produced too much material at very high latitude. This shows that, except to produce the high latitude spur visible in the total H I map, there is no need for a population of clouds with very high kick velocities (above ) that may arise from an un-truncated PL distribution of velocities. Therefore, in the following models, we prefer to use the Gaussian distribution, which has only one free parameter. The characteristic kick velocity required to reproduce the distribution of the halo gas is around ( of the circular velocity in NGC 891). This number is well constrained (): for lower the extent of the halo is not reproduced.
It is interesting to compare this characteristic value for the kick velocities with the expansion velocities for superbubbles that are predicted by hydrodynamical models. In the classic paper by Mac Low & McCray (1988), in the case of an exponential atmosphere and reasonable values for the other parameters, the expansion velocities at heights above 300 pc (when the supershell “leaves” the plane) are expected to be of in good agreement with our findings. Moreover, observations of vertical motions in H I gas give very similar values. A well known example is the expanding supershell found in M 101 (Kamphuis, Sancisi & van der Hulst, 1991) for which a line-of-sight expansion velocity of has been derived.
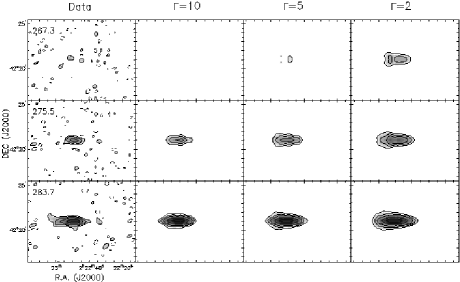
We now study the effect of the parameter in eq. 5. This parameter affects the direction of the kick velocities. The larger is, the closer the initial trajectories are to the normal to the plane (Fig. 2). Fig. 6 shows channel maps (heliocentric velocities are shown in the upper left corner) for the data of NGC 891 and for three models with different values of . The three models have the same parameters as the Gaussian model in Table 2 and Fig. 4. The channel maps shown here are those at extreme approaching velocities. Varying the opening angle produces different patterns especially for these channels. As one can see from this figure, if the cone of the kick velocities is too wide (low ), particles end up populating channels that are not populated in the data. For the channel maps are similar to those of the data. We have fixed for all our models. When , with falls by a factor two as increases from to . Thus, the data require a fairly highly collimated upward flow.
3.3 Dynamics of the extra-planar gas
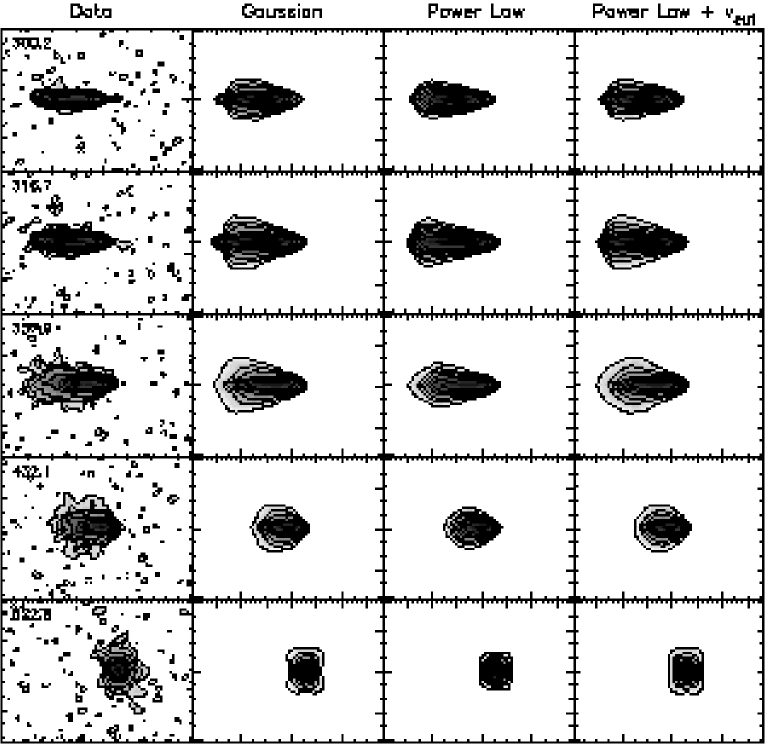
Extra-planar gas rotates more slowly than the gas in the plane. This may be seen in the channel maps. Fig. 7 (leftmost column) shows five representative channel maps in the approaching (North-East) side of the galaxy, compared with the three models of Table 2. The emission of NGC 891 becomes thinner the more one approaches high rotation velocities (first rows), far from the systemic one (). Although this effect can be produced also by other phenomena, especially a line of sight warp, Swaters, Sancisi & van der Hulst (1997) showed that the shape of the channel maps is accurately reproduced only by a lagging halo. The presence of a mild warp along the line of sight cannot be excluded (Becquaert & Combes, 1997) but it will play a minor role. In our models we have assumed that the galaxy is perfectly edge-on at each radius, so all the emission outside the plane is produced by extra-planar gas.
Although the models reproduce the basic shape of the channels, there are systematic differences with the data. In the data, extra-planar gas is more concentrated to channels close to the systemic velocity (bottom row) and is almost absent from the extreme channels (two first rows). Even though the model channel maps at are thinner than those at , the models show much more extra-planar emission than the data in the extreme channels. The Power-Law model (third column) has globally less extra-planar emission than the others (see Section 3.2) but the kinematic pattern is the same. Thus regardless of the distribution of kick velocities, model extra-planar material invariably rotates too fast. Fraternali et al. (2005) have estimated the vertical gradient in rotation velocity in NGC 891 to be about (in the range kpc). We have applied the same technique to our model cube and found a value of (a factor of two smaller than in the data). We have also inspected the behaviour of in our model and found a very similar value for the rotation velocity gradient between kpc and (the cut-off radius of star formation). In the inner regions the gradient is more pronounced, beyond the gradient become steeper close to the plane (kpc) and then shallower afterwards. The velocity gradient inferred from the observations relates to the region and has to be compared with the value of derived from the model. In the innermost regions, the data also indicate the possibility of a larger gradient (Fraternali et al., 2005).
It seems that clouds that are shot up loose part of their angular momentum, rather than conserving it. A possible mechanism for this loss is interactions with pre-existing hot halo or infalling material from the IGM (see Section 7).
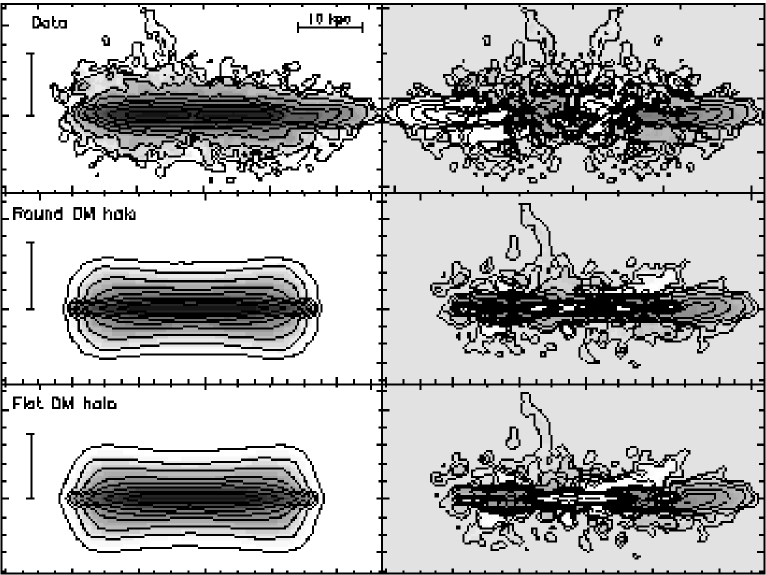
3.4 Impact of the potential
We now investigate the effects of different galactic potentials for NGC 891. The second and third rows of Fig. 8 show the total maps obtained with our best fit models with potentials dominated by the dark matter halo, which may be round or flat (see Table 1).
| Model | ||
|---|---|---|
| () | ||
| Round DM halo | 70 | 1.85 |
| Flat DM halo | 80 | 2.4 |
The best fit parameters of the models with maximum-DM potentials differ slightly from those obtained with the maximum-light potential (see Table 3). In particular, for the first model we have and , both lower than the values required for the maximum-light model. This finding reflects the fact that in a round potential it is easier for particles to leave the plane of the disc. The distributions of extra-planar gas and the residuals obtained with these two models are comparable. They are also comparable with those obtained with the maximum disc models.
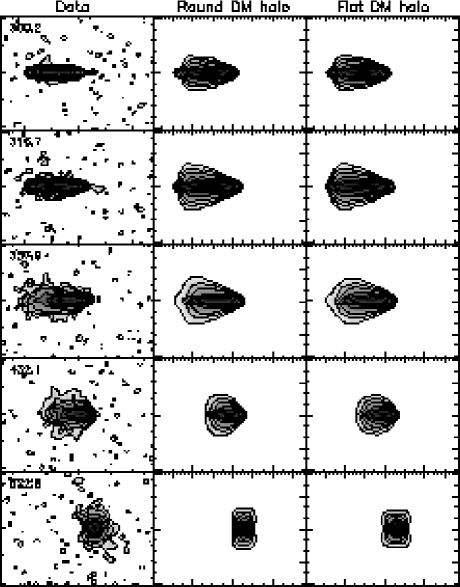
What about the kinematics? Fig. 9 shows channel maps equivalent to those shown in Fig. 7. These channel maps differ little from those obtained with the maximum-light potential. In particular, the upper channels (away from systemic velocity) are again thicker than those of the data, so the halo-dominated models fare no better in producing the required lag in the rotation of the extra-planar gas. Thus the dynamics of the extra-planar gas does not depend significantly on the potential of the galaxy.
3.5 Outflow and inflow rates
In this section we ask the question whether the model is physically feasible in terms of mass loss and energy input. In particular we look at the fate of the gas pushed up from the galactic plane through the lifetime of the galaxy. Finally, we calculate the energy input necessary to maintain the fountain.
The good agreement between the model and observed total-H I maps guarantees that the models have the right mass of extraplanar gas. However, the mass of the halo gas that we obtain from eq. 11 is unrealistically large: for all models we obtain , which is half of the total H I mass of the galaxy and about 4 times larger than the “observed” halo mass. This discrepancy arises because eq. 11 counts everything that is shot up, while the observed halo mass includes only material at distances above the plane that exceed the observational resolution, in the case of NGC 891. Indeed if we consider only the material travelling above 1.3 kpc from the plane we obtain a mass of .
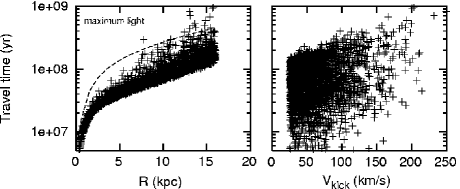
It is interesting at each radius to compare the rate at which material is shot up with the rate at which it returns to the disc. The amount of mass pushed up is related to the outflow rate by eq. 8. Depending on their initial radius and kick velocity the particles remain in the halo for a time . Fig. 10 shows the travel times for 2000 particles as a function of radius (left panel) and kick velocities (right panel) for a maximum light model. The travel times are quite short: half to a third of the dynamical (revolution) times at each radius (dashed line). They are slighly larger in a rounder (DM dominated) potential.
| Model | Total outflow | Net outflow | Energy input |
|---|---|---|---|
| () | |||
| Maximum light | |||
| () | 33.1 | 2.1 | 49.8 |
| () | 5.7 | 1.4 | 19.2 |
| Maximum DM | |||
| () | 22.7 | 1.3 | 33.2 |
| () | 5.6 | 1.0 | 15.1 |
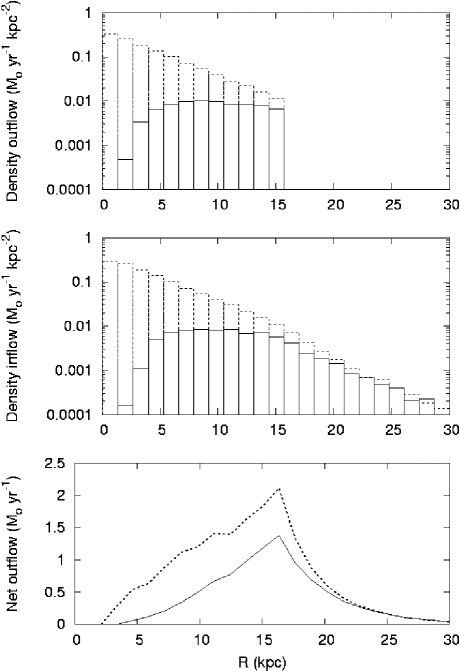
Once the mass of the halo has been fixed, the orbits have been integrated and the travel times derived, we can infer the outflow rates. Fig. 11 shows the outflow (upper panel) and inflow (middle panel) rates at each radius for the maximum-light model. Dashed lines show the flow rates at , while solid lines show the flow of material at , and thus give an indication of the flow of material that would appear as extraplanar in the observations. Especially at small the great majority of particles never reach , and nearly all these particles return to the disc within the same radial bin. Near the outside of the star-forming disc, a significant fraction of the particles that leave the disc pass through .
The bottom panel of Fig. 11 shows the rate of flow of material across a cylinder of radius as a function of ; the dashed curve shows the flow for the whole cylinder and the full curve shows the flow for . This flow peaks at at the edge of the star-forming disc. If gas is permitted to cross the plane on its first return to the plane, the net flow is reduced to . We discuss such ‘second-passage’ models in detail in Sections 4 and 5. Table 4 reports the global values of outflow and inflow rates for NGC 891, at and at . These values are very similar to those obtained by Collins, Benjamin & Rand (2002).
From the mass outflows we can derive the total energy input required to maintain the H I halo, which turns out to be a few . If we consider a supernova rate of for NGC 891 (calculated from the SFR assuming a Scalo IMF (Scalo, 1986)) and an energy per supernova of erg, the efficiency required for transferring kinetic energy to the extra-planar gas would be . Therefore the fountain flow required by our model is energetically plausible.
In summary, the application of our model to NGC 891 has led to the following conclusions: 1) the model reproduces the vertical gas distribution with characteristic kick velocities of about ; 2) the energy requirement to maintain this mechanism is less than 4 percent of the total energy input from supernovae; 3) the model’s main shortcoming is that it gives the extra-planar gas too little lag; 4) this lack of lag is independent of the choice of potential.
4 Application to NGC 2403
NGC 2403 is a nearby Sc galaxy located at a distance of Mpc (Freedman et al., 2001). NGC 2403 is much less luminous () and less massive than NGC 891 and is in several respects similar to M33 in the Local Group. It has a fairly high SFR with very bright H II regions (Drissen et al., 1999) and a global SFR rate of (Kennicutt et al, 2003).
NGC 2403 is inclined at rather than being edge-on. This intermediate inclination has the disadvantage that we cannot directly determine the distance from the plane at which emission occurs. It has, however, the advantage that it enables us to distinguish radial outflow from inflow.
Recent H I observations of NGC 2403 have revealed a component of neutral gas at lower rotation velocities () with respect to the rotation of the thin disc (Schaap, Sancisi & Swaters, 2000; Fraternali et al., 2001). Three-dimensional modelling of the H I data cube has shown that this component is produced by lagging extra-planar gas as observed in edge-on galaxies, and revealed evidence that the extra-planar gas is flowing inward (Fraternali et al., 2001).
4.1 Mass models for NGC 2403
We have used the H I rotation curve derived by Fraternali et al. (2002). Since no stellar bulge is detected in this galaxy (Kent, 1985), there are just three contributors to the potential: stellar and gaseous discs, and DM halo. The scale length of the stellar and gaseous discs are (Kent, 1985) and (Fraternali et al., 2002).
| Model | ||||||||
|---|---|---|---|---|---|---|---|---|
| (kpc) | (kpc) | ) | (kpc) | |||||
| maximum light | 1.70 | 2.0 | 0.4 | 3.1107 | 4.5 | 0 | 2 | 0 |
| maximum round DM halo | 0.85 | 2.0 | 0.4 | 6.9106 | 14.0 | 1 | 3 | 0 |
Fig. 12 (top panel) shows the fit to the rotation curve obtained with the maximum-disc model for . The DM halo in the maximum-disc fit is a double power-law model (eq. 4) with , and . The bottom panel of Fig. 12 shows the fit to the rotation curve of NGC 2403 obtained with our maximum-DM model, in which the stellar disc has , half the value in the maximum-disc model. With this choice, the DM halo is dominant at all radii. The other parameters of these mass models are listed in Table 5.
4.2 Dynamics of the extra-planar gas
Both displacement of gas from the galactic plane and rotational lag shift emission towards the systemic velocity and away from the velocities of disc gas. This phenomenon is apparent in a position-velocity (p-v) plot along the major axis of the galaxy (Fig. 13, upper panel). We use here the data of Fraternali et al. (2002) at a resolution of (). The extra-planar gas in this p-v plot is visible as a tail in the region of low rotation velocities towards the systemic velocity (indicated by the left arrow). It is difficult to say what percentage of this low-rotation gas (said to form a “beard”) is produced by lag rather than by thickness effects (Schaap, Sancisi & Swaters, 2000). There is also halo gas at very high velocity, as indicated by the right arrow in Fig. 13. This is “forbidden” gas because it shows up in quadrants of the p-v diagram (upper right and bottom left) that are inaccessible to gas that moves on circles in the same sense as the disc, regardless of its distance from the plane or speed of rotation. We defer discussion of the nature of this gas to Section 4.4.
| Model | ||
|---|---|---|
| () | ||
| Maximum disc | 70 | 0.5 |
| Maximum halo | 65 | 0.45 |
| Second passage | 70 | 0.5 |
The lower panels of Fig. 13 are p-v plots derived with three dynamical models. All the models have a Gaussian distribution of kick velocities with or for maximum-disc and maximum-DM, respectively (Table 6). We have kept these values similar to those found for NGC 891 since it is reasonable to think that they are related to physical characteristics of the ISM, rather than to the potential of the galaxy.
In Fig. 13 the second panel down shows the maximum-disc model, while the third panel down shows the maximum-DM model. The mass of halo gas used here is about , considerably lower than that needed for NGC 891. This halo mass is also quite close to that derived from the data i.e. about . Note, however, that the technique used to separate the halo gas from the disc is, in this case (Fraternali et al., 2002), totally different from that used for NGC 891 (Swaters, Sancisi & van der Hulst, 1997) and a direct comparison may be misleading.
Fig. 13 shows that both models reproduce the global shape of the p-v diagram along the major axis, although they cannot reproduce the forbidden gas in the central parts of the galaxy (right arrow in top panel); the models produce tails only in the region of low rotation velocities, and the brightness of such tails is very similar to that in the data. We stress that in the case of NGC 2403 we did not perform any minimization of residuals but simply used values for close to those obtained for NGC 891 and tuned the halo mass and the outer radius of star formation () to match the p-v diagram along the major axis. We have experimented with different values of these parameters and found that is not tightly constrained: one can get a good fit to the p-v plot along the major axis with values as low as .
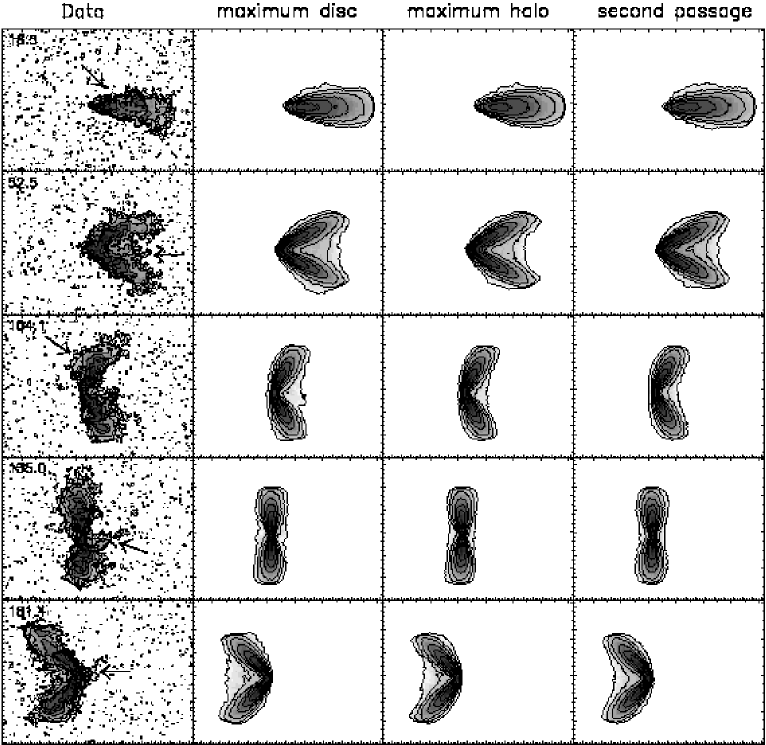
Fig. 14 compares five representative channel maps for NGC 2403 with those obtained with our models. The arrows in the data indicate features of the extra-planar gas that should be compared with the models. The typical location of the extra-planar gas is that shown by the arrow in the second row, which is for , the velocity of material that is rotating a shade more slowly than the disc gas. The corresponding model maps reproduce this emission quite well. The arrows in the bottom two channels show peculiar features in the extra-planar gas: in the fourth row () a massive -long filament, and in the fifth row () forbidden gas (see Section 4.4). Although our smooth, axisymmetric models cannot reproduce these features, in the third row () the maximum-disc model does reproduce a similar feature.
The travel times for particles in the potential of NGC 2403 are generally longer than those found for NGC 891 due to the lower attraction from the disc. As we have seen, the mass of halo gas required to reproduce the data is smaller. This implies that the outflow rates are much reduced in this galaxy with respect to NGC 891.
| Model | Total outflow | Net outflow | Energy input |
|---|---|---|---|
| () | |||
| Maximum disc | 3.15 | 0.23 | 3.85 |
| Maximum halo | 2.72 | 0.21 | 2.93 |
| Second passage | 1.70 | 0.16 | 2.05 |
Table 7 shows these values for the three models presented here together with the energy input required to maintain the H I halo. These values are about an order of magnitude lower than those obtained for NGC 891 (Table 4). For a supernova rate of (Matonick et al., 1997) and an energy per supernova of erg, the required efficiency is . Hence, only a small fraction of the energy released by supernovae is required to maintain the fountain.
4.3 Inflow or outflow?
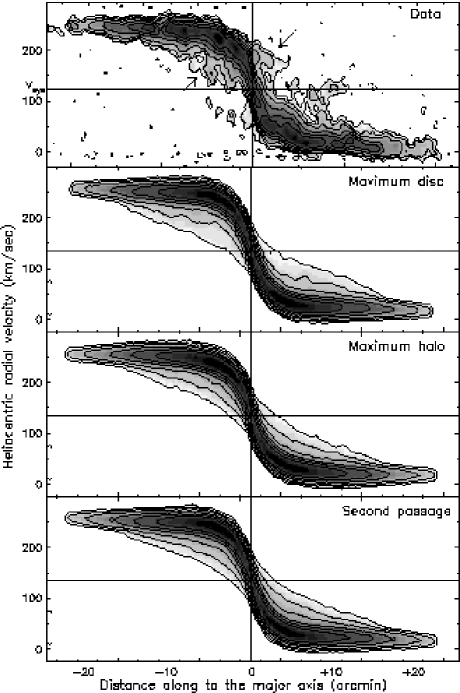
We now turn to the most significant discrepancy between the data and the models of NGC 2403. In the third row of Fig. 14 an arrow emphasises that at velocities close to the systemic velocity () the emission from extra-planar gas is rotated slightly counter-clockwise in the channel map. This phenomenon, can be better appreciated in p-v plots perpendicular to the major axis. Fig. 15 shows such plots for three perpendiculars: the middle row is for the minor axis, while the plots above and below are for north-west and south-east of the minor axis, respectively. If the gas were in circular rotation, these plots would be symmetric with respect to the central vertical line (the location of the major axis). Radial motion of the gas inwards or outwards will break this symmetry, as is most easily understood by considering the p-v plot along the minor axis. Actually all three data plots are strongly asymmetric, as indicated by the arrows. To determine whether the observed asymmetry corresponds to inflow or outflow, we need to know which side of the galaxy is nearer. Absorbing features in the disc of NGC 2403 and the assumption that the spiral arms are trailing led Fraternali et al. (2001) to conclude that the south-west side (right in these plots) is nearer. Then the asymmetry of the observed p-v diagrams implies that the extra-planar gas is flowing in towards the galactic centre (Fraternali et al., 2002). Similar evidence for an inflow of the extra-planar has recently been reported for NGC 4559 (Barbieri et al., 2005).
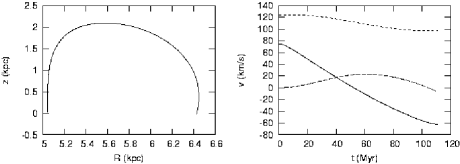
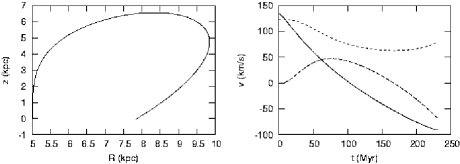
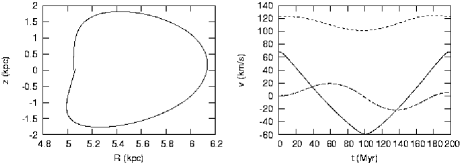
The model p-v plots in the middle column of Fig. 15 are slightly asymmetric in the opposite sense to the data plots. This phenomenon reflects the fact that in the models there is a net outflow of halo gas. It is easy to understand why the fountain model predicts an outflow: clouds that form the halo are shot upwards nearly perpendicular to the disc from platforms that are moving close to the local circular speed. Consequently, the clouds start from pericentre. They return to the disc after half a period of vertical oscillation, which is comparable to half a period of radial oscillation. Hence clouds are near apocentre when they return to the disc, and have spent most of the intervening period moving outwards. Fig. 16 illustrates this reasoning by showing the coordinates along three representative orbits in the maximum-disc potential of NGC 2403. Each trajectory starts at , and from top to bottom the initial vertical velocity is , 140 and . It is striking that the outflow inherent in the fountain model produces an asymmetry in the p-v diagrams of Fig. 15 that is appreciably smaller than the opposite asymmetry apparent in the data. Thus the data imply really significant inflow.
Is it possible to reconcile the fountain model with the observed inflow of halo gas?
We have seen that ejected gas is bound to flow outwards for most of the time prior to its return to the disc plane. If the gas disc has a sufficiently low surface density at the (large) radius of this impact, a cloud may pass clean through the disc. In this case it will contribute to halo-gas emission with for most of the time until it hits the high-surface-density inner gas disc. The panels labelled ‘second passage’ in Figs 8 and 4.2 to 15 show what the data would look like in this case. In particular, the column on the extreme right of Fig. 15 shows that permitting clouds to pass through the outer disc restores symmetry to the p-v diagrams for perpendiculars to the major axis of NGC 2403, rather than introducing the required sense of asymmetry. This makes perfect sense physically, and suggests that our only hope of accounting for the observed inflow with the fountain model involves both allowing clouds to pass through the disc, and arguing that they are visible only during the second halves of their orbits. This condition would be satisfied if outflowing clouds were highly ionized (perhaps because they are hot), and the clouds become predominantly neutral near apocentre, perhaps as a result of radiative cooling (Section 5).
4.4 Halo substructures and forbidden gas
In previous sections we have compared the data of NGC 2403 with smooth axisymmetric pseudo-data cubes produced with our models. Although there is a general agreement between the two, Fig. 14 demonstrates that the data contain features that are not reproduced by the models. In particular several gas complexes are detected as discrete features or substructures with masses from about (limit of the data) to (filament visible in channels at and ). Moreover some of these extra-planar gas structures are found at anomalous velocities (forbidden gas, see the map and Fig. 13). Can these features be produced in a galactic fountain scheme or are they evidence of gas accretion?
We can think of two ways to obtain these features in our models. The first is to increase the kick velocities in the centre of the galaxy. This will produce gas with large vertical velocities that may end up in the forbidden quadrants of the p-v plot along the major axis. The second is to increase substantially the number of particles pushed up in the central regions by increasing the parameters in eq. 10. Indeed by inspecting the model cubes we found that at low density levels some gas is already present at forbidden velocities but below the threshold of the lowest contour. Both proposals have reasonable physical explanations. First, if many supernovae go off in a limited spatial region (a bright H II region), then the supernovae may power a supershell at higher expansion velocities. The second idea is also plausible considering the uncertainties in the Schmidt law and the fact that star formation may well depend on several other parameters in addition to gas density.
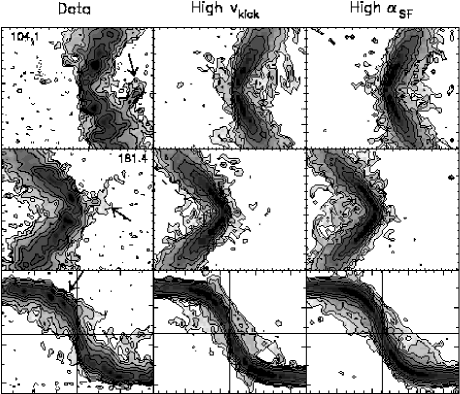
The left column of Fig. 17 shows, from top to bottom, two observed channel maps and the major-axis p-v plot. The other two columns show the corresponding predictions for two models. In the case of the centre column, the ejection velocity is at , comparable to the circular speed, . The right-hand column shows the result of assuming a high SFR, , at . In both cases we have enhanced substructure by reducing the number of clouds employed in the simulations. The top row of panels shows that both models produce features at anomalous velocities that are not unlike some of those observed. The second row of panels shows that the models can even produce emission at forbidden velocities, although not to the extent observed (arrow in left-hand panel). Unfortunately, the major-axis p-v diagrams of the bottom row reveals a serious problem with the models: the data show very little gas at speeds larger than circular (arrow at left) whereas the models do show such emission, especially in the case of large (middle column).
We summary that there is little promise of accounting for very anomalous emission (forbidden gas) within the context of the fountain model.
In conclusion, we have shown that 1) the basic distribution and kinematics of extra-planar gas in NGC 2403 can be reproduced with the same model used for NGC 891 and the same characteristic kick velocity (); 2) the energy input required by this model is less than 1 percent the input from supernovae; 3) the models fail to reproduce the global inflow of extra-planar gas seen in the data, predicting instead an outflow (or no flow); 4) high velocity and massive substructures are not easily produced by the fountain model.
5 Phase-change models
The models presented so far have two major failures in reproducing the dynamics of the extra-planar gas. They do not produce enough lag (for NGC 891) and they produce a general radial outflow of the extra-planar gas contrary to what is observed in NGC 2403. If these failures cannot be solved in a galactic fountain scheme, mechanisms such as accretion of material from the IGM, will be required to explain the kinematics of the extra-planar gas. Here we explore the only remaining possibility to reconcile the fountain models with the data. This is that clouds are visible only during the second (infalling) parts of their orbits, because they leave the plane highly ionized and only later become predominantly neutral.
We have considered four models of this kind. In the first class of models (vertical infall) the particles are switched on (become visible as H I clouds) when and they attain maximum height. In this scheme we considered two subclasses, with particles stopped at the first or the second passage through the disc. The other class of models (radial infall) is constructed by switching on the particles at apocentre (). This conjecture ensures the maximum contribution possible from radially infalling material. However, only particles with high initial kick velocities reach their apocentre before the first passage through the disc (see Figure 16). Therefore the only radial-infall model that produces reasonable results is the one with particles stopped at the second passage.
In Fig. 18 we show the comparison between three channel maps for NGC 891 and those obtained with the three phase-change models described above. The parameters of these models were derived by minimizing the residuals in the total H I map and they are reported in Table 8. The cut off radius for star formation is for all these models. All the models have maximum-light potentials.
| Model | ||
|---|---|---|
| () | ||
| Vertical inflow | 75 | 2.7 |
| Vertical inflow + second passage | 80 | 2.5 |
| Radial inflow + second passage | 90 | 2.4 |
From Fig. 18 it is clear that the radial-inflow model (rightmost column) is immediately ruled out because it produces fast rotating extra-planar gas. This is due to the fact that beyond the apocentre the azimuthal component of the velocity rises again (see bottom panel of Fig. 16). The two vertical-inflow models are more acceptable. They produce slighly more lagging material than the models without a phase change (Figs 7 and 9). This arises because we have removed the contribution from the first (outflowing) part of the orbits, on which the lag is very limited (Fig. 16).
| Model | ||
|---|---|---|
| () | ||
| Vertical inflow | 70 | 0.5 |
| Vertical inflow + second passage | 70 | 0.5 |
| Radial inflow + second passage | 80 | 0.6 |
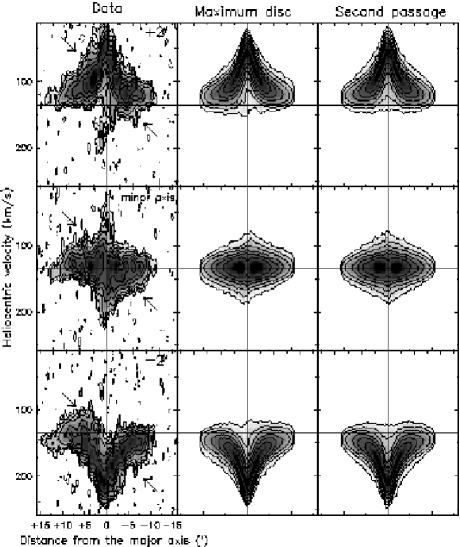
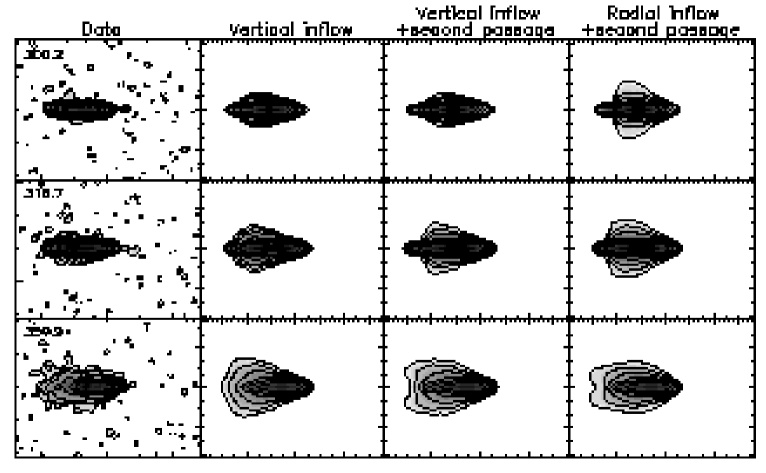
Consider now NGC 2403. Fig. 19 shows the comparison between three channel maps and the same three models used for NGC 891. The parameters of these models are shown in Table 9. The cut-off radius is , and all models use the maximum-disc potential.
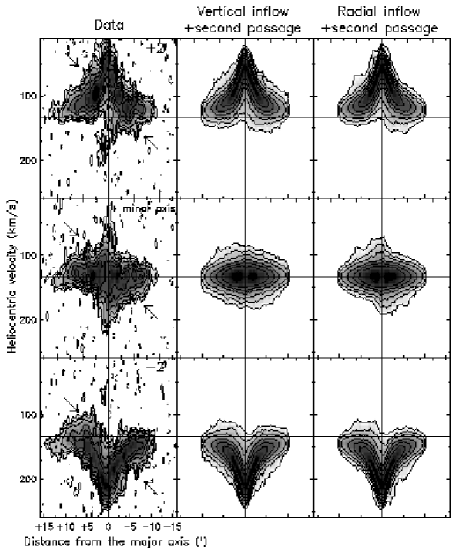
The arrows in Fig. 19 indicate peculiar locations for extra-planar gas in the data. In particular the arrow in the bottom channel map () indicates a feature produced by radial inflow motions. Clearly only the models with particles stopped at the second passage produce a similar pattern, whilst the vertical-inflow model displays the opposite pattern. The same effect is indicated by the arrow in the channel map in the middle row () and the second-passage models seem to show the correct pattern. However, these second-passage models are problematic in the top channel map () in that they show extended tails of emission not seen in the data. This emission is produce by vertical motions (inflow and outflow) combined with thickness and lag. This seems to indicate that, although the data require a large amount of inflow, the dominant component of this inflow should be radial rather than vertical.
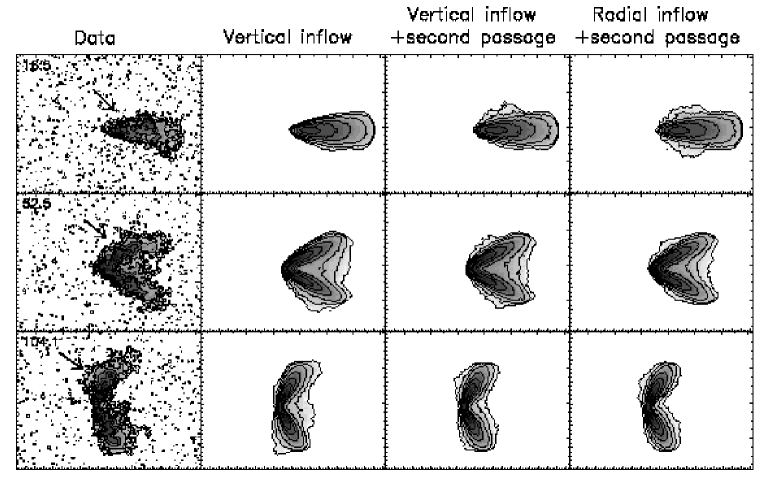
Finally, consider Fig. 20. This is the analogue of Fig. 15 for the two second-passage models described here. The asymmetric pattern shown in the data (evidence of radial inflow) is now visible in the model p-v plots. In particular in the radial-inflow model which is indeed the most extreme inflow model that we can produce. However even in this extreme (probably unrealistic) model, there is less asymmetry than in the data. This shows that the amount of inflow required by the data is very large.
In conclusion, combining the results for NGC 891 and NGC 2403, the only promising model is the one with vertical-inflow and a second passage because the radial-inflow model produces fast rotating extra-planar gas and the model without second passage shows outflow instead of inflow. However, even this vertical-inflow model does not produce as much lag (for NGC 891) and inflow (NGC 2403) as the data require. Hence, we conclude that selecting portions of the particle orbits does not make it possible to reproduce the data with the fountain model. There is an intrinsic need for low angular momentum and radially infalling material that is not present in a pure galactic-fountain scheme.
6 Comparison with previous work
Corbelli & Salpeter (1988); Charlton & Salpeter (1989) suggested that the extended H I discs of galaxies might be built up from gas that is shot out from interior, star-forming regions and later settles to circular orbits of large radius. This proposal requires some ejected gas to acquire significant extra angular momentum per unit mass about the galaxy’s symmetry axis, , as it is expelled from the star-forming region. We have found that the observations require the outflow to be narrowly collimated upwards, and in this case none of the ejected gas will increase its to the large values required for formation of an extended H I disc. Hence our work effectively rules out this proposal.
Our phase-change models are essentially variants of the classic galactic-fountain model of Bregman (1980). In that model, star-formation in the disc drives a hot wind that cools as it rises, with the result that clouds of H I eventually form in it, and fall back to the disc. The main difference between our model and Bregman’s is that in the latter a pressure gradient in the coronal gas steadily accelerates the gas over a significant distance, while in our calculations the gas is abruptly accelerated within the disc and subsequently coasts under gravity. Crucially, in both models the specific angular momentum of gas is conserved in the flow because the dynamics is axisymmetric. Consequently, in both models the rotation speed of gas at cylindrical radius will be , where is the radius from which the gas was shot upwards. It follows that in Bregman’s model, as in ours, the rotational lag of the halo gas is likely to to be too small.
Our work closely resembles that of Collins, Benjamin & Rand (2002), who also considered the dynamics of ballistic gas clouds. A difference in the coding is that we integrate orbits in the plane and then uniformly distribute them in azimuth. This allows us to have a larger number of “particles” with a limited number of integrations, drastically reducing discreteness noise. However, the main difference between our work and that of Collins, Benjamin & Rand (2002) is in the comparison with the data. Collins et al. extracted average projected velocities from the models, and compared them with the mean velocities of ionized gas derived from H long-slit observations of NGC 5775 and NGC 891. The problem with this approach is that it does not exploit the wealth of information that is contained in the line-of-sight velocity distribution. The work of Collins et al. has been recently revised by Heald et al. (2005), who applied the same ballistic model of Collins, Benjamin & Rand (2002) to Fabry-Perot observations of NGC 5775. They found that the vertical gradient in rotation velocity predicted by the model is shallower than that measured from the data, in agreement with our results.
Finally, we stress that the distinctive feature of the work presented here is that we attempt to reproduce directly the whole H I data-cube of a galaxy. Our models are constructed to match the raw data without performing any data analysis, and this procedure assures a full control of projection and resolution effects.
7 Concluding remarks
We have presented a model for the dynamics of the neutral gas outside the plane of spiral galaxies (extra-planar gas). We have explored the role of internal (stellar activity) processes in the formation and maintenance of the gaseous halo. In our model, we have considered orbits of particles expelled from the disc by supernova explosions and have integrated their paths through the halo. We have generated output pseudo-data cubes and compared them with the data of two galaxies with a large amount of extra-planar gas (NGC 891 and NGC 2403).
The main results are:
-
•
the vertical gas distribution in NGC 891 is well reproduced by the models with characteristic kick velocities ;
-
•
the same characteristic kick velocity also reproduces accurately the distribution and lag of the extra-planar gas in NGC 2403 (as seen in the p-v plot along the major axis);
-
•
we were able to constrain the opening half-angle of the upward flow for a typical superbubble chimney to be ;
-
•
the energy input required to maintain the gaseous haloes in the two galaxies is percent of the energy released by supernovae;
-
•
the actual shape of the galactic potential plays a minimal role in the dynamics of the extra-planar gas;
-
•
the main problem with our model it that it produces only half the required lag of the extra-planar gas in NGC 891, so there is a need for low angular momentum material (loss of angular momentum) to reconcile the models with the data;
-
•
a second problem is that our model predicts an outflow of the extra-planar gas whilst, in NGC 2403, the data indicate an inflow;
-
•
high velocity massive substructures, observed in NGC 2403 and in NGC 891, are difficult to obtain in a fountain model and may be the signature of accretion from IGM.
-
•
allowing the clouds to be invisible (ionised) for the outflowing part of their orbits does not solve the main problems of the models.
We have seen how our fountain model is able to reproduce accurately some features of the extra-planar gas (such as its vertical distribution) and it is energetically consistent. However it has two main failures that clearly indicate that a (collision-less) fountain alone cannot fully account for the dynamics of the extra-planar gas. The need for low angular momentum material seems to suggest that one has to take into account interactions between the fountain flow and a hot gaseous halo and/or accretion material. The latter possibility seems particularly attractive. The accretion of material with low angular momentum (zero on average) that interacts with the fountain gas may cause the loss of angular momentum necessary to reproduce the lag observed in NGC 891. Moreover it may add the component of inflow velocity to the extra-planar gas needed to reconcile the predictions of the models with the observed inflow in NGC 2403. This possibility will be explored in a forthcoming paper.
Finally, another topic to pursue is that of our Galaxy. The features detected in NGC 891 and other external galaxies are very likely to be the analogous of the Intermediate and High Velocity Clouds (IVCs and HVCs) of the Milky Way. In the Milky Way we have very detailed information about the kinematics of these features, in particular their inflow motion (Wakker & van Woerden, 1997), but also about their metallicity that, in the case of Complex C, has been found to be of solar (Wakker et al., 1999; Tripp et al., 2003). Such a metallicity, intermediate between a primordial value and a galactic (roughly solar) value, may indicate a mixing process between disc (fountain) gas and the accretion material. The study the Milky Way halo will be a further application of our model in the near future.
Acknowledgments
F.F. gratefully acknowledges support from Marie Curie Fellowship (MEIF-CT-2003-501221). We thank Renzo Sancisi for helpful comments and advice. The WSRT is operated by the Netherlands Foundation for Research in Astronomy (ASTRON) with the support from the Netherlands Foundation for Scientific Research (NWO).
References
- Allen, Sancisi & Baldwin (1978) Allen R.J., Sancisi R., Baldwin J.E., 1978, A&A, 62, 397
- Avillez (2000) de Avillez M.A., 2000, MNRAS, 315..479
- Barbieri et al. (2005) Barbieri C.V., Fraternali F., Oosterloo T., Bertin G., Boomsma R., Sancisi R., 2005, A&A, accepted (astro-ph/0504534)
- Barnabè et al. (2005) Barnabè M., Ciotti L., Fraternali F., Sancisi R., 2005, A&A, submitted
- Becquaert & Combes (1997) Becquaert J.-F., Combes F., 1997, A&A, 325, 41
- Benjamin (2002) Benjamin R.A., 2002, in Seeing Through the Dust ed. A.R. Taylor, T.L. Landecker, and A.G. Willis, ASP Conference Series, Vol. 276, 201
- Binney & Tremaine (1987) Binney J., Tremaine S., 1987, “Galactic Dynamics”, Princeton University Press, Princeton, NJ
- Boomsma et al. (2005) Boomsma R., Oosterloo T., Fraternali F., van der Hulst J.M., Sancisi R., “Extra-planar Gas”, Dwingeloo, ASP Conf. Series, ed. R. Braun (astro-ph/0410022)
- Bregman (1980) Bregman, J.N., 1980, ApJ, 236, 577
- Bregman & Pildis (1994) Bregman, J.N.; Pildis, R.A., 1994, ApJ, 420, 570
- McCarthy, van Breugel & Heckman (1987) McCarthy P.J., van Breugel W., Heckman T., 1987, AJ, 93, 264
- Charlot, Worthey & Bressan (1996) Charlot S., Worthey G., Bressan A., 1996, ApJ, 457, 625
- Charlton & Salpeter (1989) Charlton J.C., Salpeter E.E., 1989, ApJ, 346, 101
- Collins, Benjamin & Rand (2002) Collins J.A., Benjamin R.A., Rand R.J., 2002, ApJ, 578, 98
- Corbelli & Salpeter (1988) Corbelli E., Salpeter E.E., 1988, ApJ, 326, 551
- Cuddeford (1993) Cuddeford P., 1993, MNRAS, 262, 1076
- Dehnen & Binney (1998) Dehnen W., Binney J., 1998, MNRAS, 294, 429
- de Vaucouleurs (1948) de Vaucouleurs G., 1948, Ann. Astrophys., 11, 247
- Drissen et al. (1999) Drissen L., Roy J.-R., Moffat A.F.J., Shara M.M., 1999, AJ, 117, 1249
- Fraternali et al. (2001) Fraternali F., Oosterloo T., Sancisi R., van Moorsel G., 2001, ApJ, 562, 47
- Fraternali et al. (2002) Fraternali F., van Moorsel G., Sancisi R., Oosterloo T., 2002, AJ, 123, 3124
- Fraternali, Oosterloo & Sancisi (2004a) Fraternali F., Oosterloo T., Sancisi R., 2004, A&A, 424, 485
- Fraternali et al. (2005) Fraternali F., Oosterloo T., Sancisi R., Swaters R., 2005, “Extra-planar Gas”, Dwingeloo, ASP Conf. Series, ed. R. Braun (astro-ph/0410375)
- Freedman et al. (2001) Freedman W.L., Madore B.F., Gibson B.K., Ferrarese L., Kelson D.D., Sakai S., Mould J.R., Kennicutt R.C.Jr., Ford H.C., Graham J.A., Huchra J.P., Hughes S.M.G., Illingworth G.D., Macri L.M., Stetson P.B., 2001, ApJ, 553, 47
- Garcia-Burillo & Guelin (1995) Garcia-Burillo S., Guelin M., 1995, A&A, 299, 657
- Heald et al. (2005) Heald G.H., Rand R.J., Benjamin R.A., Collins J.A., Bland-Hawthorn J., 2005, ApJ, in press
- Hernquist (1990) Hernquist L., 1990, ApJ, 356, 359
- Hoopes, Walterbos & Rand (1999) Hoopes C.G., Walterbos R.A.M., Rand R.J., 1999, ApJ, 522, 669
- Kamphuis, Sancisi & van der Hulst (1991) Kamphuis J., Sancisi R., van der Hulst T., 1991, A&A, 244, 29
- Kennicutt (1989) Kennicutt R.C. Jr., 1989, ApJ, 344, 685
- Kennicutt et al (2003) Kennicutt R.C. Jr., Armus L., Bendo G., Calzetti D., Dale D.A., Draine B.T., Engelbracht C.W., Gordon K.D., Grauer A.D., Helou G., Hollenbach D.J., Jarrett T.H., Kewley L.J., Leitherer C., Li A., Malhotra S., Regan M.W., Rieke G.H., Rieke M.J., Roussel H., Smith J.-D.T., Thornley M.D., Walter F., 2003, PASP, 115, 928
- Kent (1985) Kent S.M., 1985, ApJS, 59, 115
- van der Kruit (1981) van der Kruit P.C., 1981, A&A, 99, 298
- van der Kruit & Searle (1981) van der Kruit P.C., Searle, L., 1981, A&A, 95, 116
- van der Kruit (1984) van der Kruit P.C., 1984, A&A, 140, 470
- Young (1976) Young P.J., 1976, AJ, 81, 807
- Navarro, Frenk & White (1997) Navarro J.F., Frenk C.S., White S.D.M., 1997, ApJ, 490, 493
- Mac Low & McCray (1988) Mac Low M.-M., McCray R., 1988, ApJ, 324, 776
- Matonick et al. (1997) Matonick D.M., Fesen R.A., Blair W.P., Long K.S., 1997, ApJS, 113, 333
- Matthews & Wood (2003) Matthews L.D., Wood K., 2003, ApJ, 593, 721
- Oort (1970) Oort J.H., 1970, A&A, 7, 381
- Oosterloo, Fraternali & Sancisi (2005) Oosterloo T., Fraternali F., Sancisi R., 2005, in preparation
- Popescu et al. (2004) Popescu C.C., Tuffs R.J., Kylafis N.D., Madore B.F., 2004, A&A, 414, 45
- Rocha-Pinto & Maciel (1996) Rocha-Pinto H.J., Maciel W.J., 1996, MNRAS, 531, 279, 447
- Rocha-Pinto et al. (2000) Rocha-Pinto H.J., Scalo J., Maciel W.J., Flynn C., 2000, ApJL, 531, 115
- Rosen & Bregman (1995) Rosen A., Bregman J.N., 1995, ApJ, 440, 634
- Rupen (1991) Rupen M.P., 1991, AJ, 102, 48
- Sancisi & Allen (1979) Sancisi R., Allen R.J., 1979, A&A, 74, 73
- Scalo (1986) Scalo J.M., 1986, Fundamentals of Cosmic Physics (ISSN 0094-5846), 11, 1
- Schaap, Sancisi & Swaters (2000) Schaap W.E., Sancisi R., Swaters R.A., 2000, A&A, 356, L49
- Shapiro & Field (1976) Shapiro P.R., Field G.B., 1976, ApJ, 205, 762
- Shaw & Gilmore (1989) Shaw M.A., Gilmore G., 1989, MNRAS, 237, 903
- Sofue & Nakai (1993) Sofue Y., Nakai N., 1993, PASJ, 139, 151
- Swaters, Sancisi & van der Hulst (1997) Swaters R.A., Sancisi R., van der Hulst J.M., 1997, ApJ, 491, 140
- Struck & Smith (1999) Struck C., Smith D.C., 1999, ApJ, 527, 673
- Tripp et al. (2003) Tripp T.M., Wakker B.P., Jenkins E.B., Bowers C.W., Danks A.C., Green R.F., Heap S.R., Joseph C.L., Kaiser M.E., Linsky J.L., Woodgate B.E., 2003, AJ, 125, 3122
- Wang et al. (2001) Wang Q.D., Immler S., Walterbos R., Lauroesch J.T., Breitschwerdt D., 2001, ApJ, 555, 99
- Wakker & van Woerden (1997) Wakker B.P, van Woerden H., 1997, ARA&A, 35, 217
- Wakker et al. (1999) Wakker B.P., Howk J.C., Savage B.D., van Woerden H., Tufte S.L., Schwarz U.J., Benjamin R., Reynolds R.J., Peletier R.F., Kalberla P.M.W., 1999, Nature, 402, 388