The Observed Galactic Annihilation Line. Possible Signature of the Cluster for Accreting Small Mass Black Holes
Abstract
Compton Gamma Ray Observatory, OSSE, SMM, TGRS, balloon and recent INTEGRAL data reveal a feature of the 0.511 MeV annihilation radiation of the Galactic Center with a flux of approximately MeV photons cm-2s-1. We argue that pairs can be generated when the X-ray radiation photons and MeV photons interact with each other in the compact region in the proximity of the Galactic Center black hole. In fact, disks formed near black holes of g mass should emit the MeV temperature blackbody radiation. If positron () sources are producing about s-1 near the Galactic Center they would annihilate on the way out and result in MeV emission. We suggest that the annihilation radiation can be an observational consequence of the interaction of the accretion disk radiation of the SMall Mass Black Holes (SMMBHs) with X-ray radiation in the Galactic Center. This is probably the only way to identify and observe these SMMBHs.
1 Introduction
The Galactic Center (GC) of our Galaxy found in 1974 as a strong radio source called Sgr A∗ is the site a supermassive black hole weighing 2.6 millions solar mass is present (e.g. Melia and Falcke 2001). Morever the total mass of stars enclosing the inner 20 pc of the Galaxy is M⊙, or % of the Galactic stellar mass (Baganoff et al. 2003). Therefore, the X-ray observations of the Galactic Center can potentially reveal accreting black holes and neutron stars. During five years of Chandra observations, Baganoff et al. identified seven X-ray transients located within 20 pc of Sgr A∗. Remarkably four of these transients lie within only 1 pc of Sgr A∗ (Muno et al. 2005). This implies that, compared to the numbers of similar systems located between 1 and 20 pc, transients are over-abundant by a factor of per unit stellar mass within 1 pc of Sgr A∗.
It is also now a subject of intense activity due to the possible presence of a dark matter cusp inside the Galactic Center. Numerous space missions have observed the center of our Galaxy in radio, infrared, X and rays. Thanks to these measurements we have a more precise picture of this region. The center of our Galaxy presents the characteristic that there is a strong activity both in X and rays. A recent HESS (High Energy Stereoscopic System) experiment reports a detection of very high energy gamma rays from the Galactic center within of Sgr A∗. The flux above 165 GeV is order of m-2 s-1 and consistent with a luminosity of ergs s-1 (Aharonian, et al. 2004).
The most intense line of our Galaxy is coming also from GC: the 511 keV annihilation line. Balloon flight observations reported in 1972 showed first evidence for the existence of an annihilation line from the Galactic Center region (Johnson, Harnden & Haymes 1972; see also Johnson & Haymes, 1973). Since that time the Galactic Center has been the object of intense observations from space missions and balloon experiments (Leventhal, MacCallum & Stang 1978; Purcell et al. 1993; Ramaty, Skibo & Lingenfelter 1994; Purcell et al. 1997; and Cheng et al. 1997; Share et al. 1990; Teegarden et al. 1996; Gehrels et al. 1991; Leventhal et al. 1993; Niel et al. 1990; Chapuis et al. 1991).
The observed emission of the brightest gamma-ray line in our Galaxy is due to two separate sources: a diffuse one and a point source near the Galactic Center. For the point source we use the value given by INTEGRAL from recent observations (Churazov et al. 2005). The point source line flux is : ph cm-2 s-1, for which the corresponding luminosity of the line emission is about ergs s-1 for the distance of about 8 kpc. Then the positron sources are produced at a rate given by: s-1, where is the distance expressed in unit of 8 kpc. This observation is in a good agreement with the previous measurements and is well fitted by a gaussian with the full width at half maximum of 10 degrees, with a 2 confidence interval of 6-18 degrees. The INTEGRAL measurement providing the line width of keV exlcudes velocity of the interstellar medium (ISM) greater than km s-1, i.e. .
Several possible sources of the observed line related to the positron sources have been proposed. For example, Dermer & Skibo (1997) suggest that these sources could be associated with galactic fountains of radioactive elements ejected from supernova activity in the Galactic Center. Boehm, Fayet & Silk (2004) offer an alternative explanation that the observed annihilation line could be related to the annihilation of dark light matter particles into . In fact, Guessoum, Jean & Gillard (2005) present the list of the main processes that led to the positron production. They are: (i). the decay of a radioactive nucleous which is widespread in the explosive and/or hydrostatic nucleosynthesis enviroments of novae, supernovae, Wolf-Rayet, and Asymptotic Giant Branch stars, (ii). decay into and gives off a positron taking place where the pion is produced in collisions of highly energetic ( MeV) cosmic rays with interstellar material, (iii). pair production by interaction of an electron with a strong magnetic field and (iv) the process of the photon-photon pair production which requires photons of high energies occuring in the enviroment of luminous compact objects, black holes, active nuclei (AGN) an etc. Thus one cannot exclude that pair production is a result of the interaction of X-ray and emission in the very compact shell near Galactic Center.
X-ray observations of the Galactic Center have been made with several instruments (Watson et al. 1981; Skinner et al. 1987; Kawai et al. 1988; Takeshima et al. 1991; Sunyaev et al. 1993; Markevitch et al. 1993; Pavlinsky et al. 1993; Preddehl, & Trumper 1994). High-sensitivity imaging observations with the Einstein Observatory (Watson et al.) and ROSAT (Preddehl, & Trumper) resolved several discrete sources within of Galactic Center. One of the ROSAT sources, RXJ 1745.6-2900 (Preddehl & Trumper), is within coincident of the nonthermal radio source Sgr A ∗, which is believed to be the dynamical center of our Galaxy.
The Japanese satellite GINGA having detected K lines from highly ionized iron, found a large amount of hot plasma which is strongly concentrated towards the Galactic Center (Koyama et al. 1989; Yamauchi et al. 1990). The ASCA image (Tanaka et al. 1995) has revealed extended diffuse emission over the Galactic Center region. The observed spectrum shows the Kα lines from highly-ionized ions of silicon, sulphur, argon, calcium, in addition to the high-ionization iron lines. This gives firm evidence for the presence of high-temperature ( keV) plasma. A large energy generation rate of ergs s-1 is required to produce the observed plasma. In fact, Koyama et al. (1996) argue for a source at the Galactic Center. The luminosity required to account for the 6.6-keV line from Sgr B2 (the prominent molecular cloud) is ergs s-1 (in 2-10 keV band). While the Sgr A region has an X-ray luminosity of ergs s-1 at present, it could have been much more luminous yr ago. The distinctly bright region inside the Sgr A shell is probably due to this recent activity and the X-ray luminosity may have been as high as several ergs s-1. Koyama et al. conclude that the ASCA results suggest the presence of an active galactic nucleus and together form the evidence for a large mass concentration at the Galactic Center and transient activities due to sporadic mass accretion rate. Muno et al. (2004a) also presented the study of the spectrum of diffuse emission in field around Sgr A∗ during 625 ks of Chandra observations. They confirmed and extended the results of the previous study (see e.g. Koyama et al.). In particular, they showed that the contiuum and line spectra are consistent with an origin in a two-temperature plasma. As the cooler, keV plasma differs in the surface brightness, the hotter, keV component is more spatially uniform.
Recently Revnivtsev et al. (2004) have published INTEGRAL data on giant molecular cloud Sgr B2’s (IGR J17475-2822) fluorescence. They have constructed the broad band (3-200 keV) spectrum from the ASCA-GRANAT-INTEGRAL data. It appears that the X-ray irradiating spectrum of the cloud is, in fact, not free-free, (as early proposed irradiating spectrum, see above) and it is rather quite hard, extending to over 100 keV and probably a power law with photon index 1.8. Revnivtsev et al. concluded that 300-400 years ago Sgr A∗ was a low luminosity (of ergs s-1 at 2-200 keV) AGN with characteristic hard X-ray Comptonization spectrum with photon index of about 1.8 and plasma temperature is about 50 keV.
The emission between 1 MeV and 30 Mev has been measured by COMPTEL. Using the COMPTEL data points (Hunter et al. 1997) one can calculate that the luminosity in 1-30 MeV energy band is about ergs s-1 with an assumption that the distance to the Galactic Center is about 8 kpc.
In this Paper, we study a possibility of pair creation due to X-ray and photon interaction inside the compact Galactic Center shell (the SGR A shell) and we discuss a possibility of annihilation line formation when these pairs propagate through the Galaxy from the Galactic Center region. In §2 we present a pair creation model. In §3 we compare our theoretical predictions for the pair and annihilation photon production with observations. We determine the size of the pair production area using the observable fluxes in X-ray and ray energy ranges. In §4 we investigate the outward propagation of positrons from the Galactic Center region. In §5 we present arguments for the origin of the MeV emission near Galactic Center. We discuss our results in §6 and we make our final conclusions in §7.
2 Pair creation model
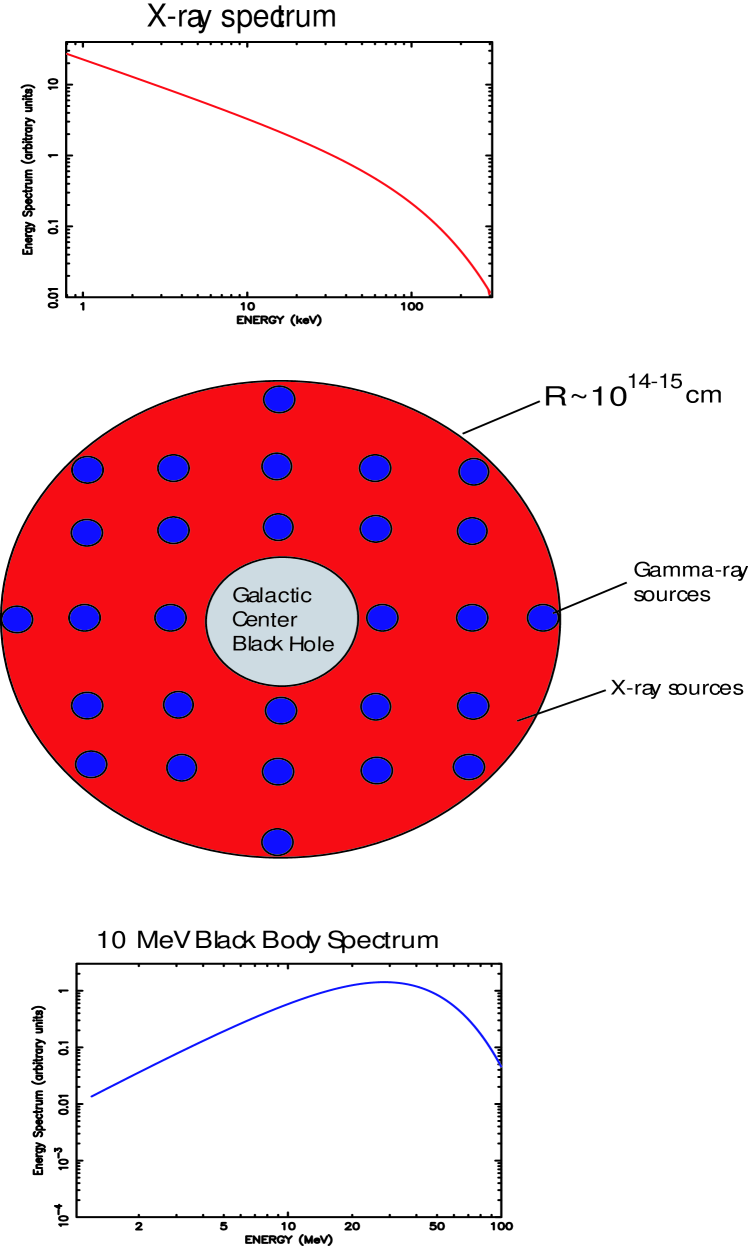
We assume that the photon density of X-ray photons emitted by the inner shell near the central BH within (Schwarzschild radii) is described by the following distribution over radius (see Fig. 1 for the geometrical description of the model)
| (1) |
where is X-ray luminosity of the central source per keV (X-ray energy spectrum), is the energy of X-ray photon and is the speed of light. Also we consider that the spherical shell between the inner radius and ( and ) is uniformly filled by radiation sources where photon density production is
| (2) |
where is the -radiation luminosity of the spherical shell per keV (-ray energy spectrum) and is the energy of the -ray photon. Then the pair production by the photons (for which the pair production condition is satisfied) is
| (3) |
where is the optical path for -ray photon propagating in the X-ray background and incoming at radius at given direction . The multiple integral in equation (3) can be calculated analytically. In fact,
| (4) |
where
| (5) |
and ; where is a pair creation cross section given by (Dirac, 1930, Heitler, 1954)
| (6) |
and , and where the classical electron radius cm.
The analytical integration of
| (7) |
allows us to calculate the second integral of over :
| (8) |
Finally, the expression for the Green’s function can be written as
| (9) |
In order to obtain the total pair production rate one should integrate over X-ray and energies, namely
| (10) |
3 Results of calculations
To compute the positron flux one needs the X and ray energy spectra, and respectively. We will use for the total X-ray and luminosities of the inner GC region, ergs s-1 and ergs s-1 respectively (see a review of the observations in the Introduction).
We assume that the radiation emanates from a optically thick medium and consequently the emergent spectrum has a blackbody like shape that color temperature MeV (see Fig. 1). Then for a normalization constant we have an equation as follows
| (11) |
where . For the X-ray photons, we assume a power law with an exponential cutoff
| (12) |
where , keV, the spectral index and is the normalization constant. From the previous section we saw that the process of pair creation is driven by the cross section given by equation (6). The energy dependence, represented by the parameter can be expressed using the dimesionless energies and , namely . Then the formula for the pair flux
| (13) |
can be modified using the variables and as follows
| (14) |
We compute this double integral and obtain the following result:
| (15) |
To reproduce the value of s-1 for the positrons rate, one needs a value of the radius , given by:
| (16) |
It is worth noting that the intrinsic pair flux s-1, formed as a result of interaction (to calculate this flux one should replace by in formula 14) in this emission region of size cm, is six orders of magnitude less than the pair flux s-1 required to reproduce the observed annihilation line strength.
4 Outward propagation of positrons from the Galactic Center region
A positron, may collide with an electron , to produce two gamma ray photons according to the reaction . Before decaying, the positron in the free space interacts with an electron and forms the positronium, a bound state with lifetime of order of s. Then particles annihilate into two or three photons. One photon will have a high energy and ,if the electron is at rest; the other photon will have an energy of the order keV. In our calculations we assume that most of the produced positrons are thermalized in the surrounding thermal plasma and thus we can consider the annihilation of thermal positrons at a temperature of order K , i.e. , where is the thermal velocity of electrons. In fact, the recent INTEGRAL observations of 511 keV annihilation line (Churazov et al. 2005) exclude velocity of the interstellar medium greater than . For , the cross-section , for positron annihilation with a free electron at rest is given by Dirac (1930)
| (17) |
Murphy, Dermer & Ramaty (1987) showed that the fraction of that annihilites in flight prior to thermalizing usually amounts to less that %, and that these positrons do not contribute to the 511 keV line emission. After entering the thermal pool, the positron annihilate in a fully ionized thermal plasma through direct annihilation. The problem of the positron thermalization and annihilation photon production in the interstellar medium has been recently studied in details by Guessoum, Jean, & Gillard (2005) (see for a review of this subject). They reexamine in the utmost detail the various processes undergone by positron annihilation using most recent interaction cross section with atomic and molecular hydrogen, as well as helium. Putting all the new calculations together, they constructed annihilation spectra of ISM.
The fair question is how far the positrons of energy about one MeV can travel from the Galactic central region to be annihilated. In order to answer to this question one has to compare the diffusion (travel) time with the energy loss (thermalization) time with taking into the main energy loss mechanisms. In general terms, the particle diffusion is related to escape of a magnetized turbulent plasma.
Jean et al. (2005) present a spectral analyzis of the annihilation emission from the GC region based on the first year of measurements made with the spectrometer SPI of the INTEGRAL mission. They also analyze the positron diffusion propagation in the GC region in detail. The quasilinear diffusion coefficient the diffusion coefficient (Melrose 1980) can be expressed as:
| (18) |
with the Bohm diffusion coefficient, is the maximum scale of the turbulence, for a Kolmogorov turbulent spectrum, is relative perturbation of the magnetic field pressure which is often approximated to 1, is the positron velocity and is the Larmor radius (gyroradius)
| (19) |
is the positron (electron) charge, is the magnetic field strength, . The maximum scale was estimated to be pc from the measurements of ISM turbulence (Armstrong et al. 1995).
Recently the (mean) magnetic field strength in the GC region was measured by La Rosa et al. (2005), hereafter LaR05, to be G. LaR05 have used the Very Large Array in all four configurations to image the GC region at 74 MHz. The resulting image of large scale () of nonthermal synchrotron emission presented in LaR05 has a resolution of . At distance of 8 kpc the angular scales of corresponds to region pc and that of corresponds to 0.09 pc. It has be noted that in the past several authors (see Morris & Serabyn et al. 1996 and references therein) estimated magnetic fields values of G in the GC region. This is 2 orders of magnitude larger than the value ( G) obtained by LaR05.
Thus for the mean B of G and for 1 MeV positrons cm2s-1. The low limit time scale for 1 MeV positrons to thermalize in a the G, and cm -3 density region due to ionization, bremsstrahlung, synchrotron and other processes is years. Then the distance travelled by diffusion in a time of years (slowing down time plus annihilation time in the standard grain model) is
| (20) |
which is much greater than typical half-size of the hot GC region. The volume filling factor of the hot GC region 0.72 is highest among all phases of the Galactic bulge (see more details of these estimates in Jean et al. 2005). Using the spectral data and positron propagation analysis Jean et al. (2005) come to conclusion that the sources of annihilation emission are diffusively distributed over the Galaxy. They also explain that the lack of annihilation emission from the GC hot gas is due to its low density, which allows positrons to escape this phase.
It is worth noting Liu, Petrosian & Melia (2004) find that an outflow of low energy electrons of order 1 MeV are distributed over a spatially larger scale than that of the BH inner region (see more discussion of their work in section 6.2). Namely, the escape time of these electrons is more than a factor of 2 shorter than the time scales for acceleration and losses.
On the hand one can argue that the positrons can be diffusely trapped, thermalized and annihilated in the region that size is of order a few parsec and where the magnetic field can be much higher than G. Melia & Falcke (2001) suggest that out to pc (essentially inside the cavity surrounded by the circumnuclear disk), the field is turbulent (matching the turbulent plasma generated by wind-wind interactions from the Wolf-Rayet and O/B stars in this region), can be as high as mG.
So the problem is that the gyroradius of the electrons and positrons produced in gamma-gamma interactions, will be far smaller than the region over which the positrons are believed to be annihilating. Consequently, the pairs should be radiating profusely via synchrotron, bremsstrahlung, and inverse Compton.
The photon energy density in this region is about eV cm-3. To obtain this number we assume that the bolometric luminosity of the source in the Galactic Center is of order erg s-1 (see e.g. Narayan et al. 1998). Thus the derived magnetic strength using equipartition between photons and magnetic field energies is about G. For such a low magnetic field we have already demonstrated that the positrons can escape from the GC region.
In fact, Longair (1994) derived the minimum magnetic energy requirement for a given luminosity and photon volume V per unit time (in our case . He shows that which value is higher than that obtained using relation . But the ratio of is not orders of magnitude. The difference of the indicies of ratio is vs . Furthermore Longair found that the magnetic field strength, , corresponds to approximate equality of the energies in the particles and magnetic field. LaR05 confirm this conclusion. They show that the mean magnetic field in the GC region G inferred from their observations is consistent with the particle energy density of eV found in cosmic-ray data.
The turbulent diffusion time scale is not determined by the magnetic field only. In fact for the diffusion coefficient is proportional to (see Eq.18). Even if the magnetic field is about mG the diffusion coefficient decreases by factor 4.6 only, namely cm2s-1. The related difussion time through this region is about years which is much less than the thermalization and annihilation time years.
5 -Emission as the disk emission in small mass black holes
One of the possible origins for MeV-emission is a disk emission from mass accretion by SMall Mass Black Holes (SMMBHs). The BH mass can be evaluated using the color disk temperature . Using formula (5) in Shrader & Titarchuk (1999), hereafter ShT99, we obtain that a black hole mass in solar units ()
| (21) |
where is the dimensionless mass accretion rate in units of , related to the Eddington luminosty , is the maximum temperature in the disk in keV, is a disk color factor and is the inner disk radius calculated in Schwarzchild units. Analyzing quite a few BH sources, ShT99 and Borozdin et al. (1999), hereafter BRT99, established that in the soft state the inner disk radius is very close to the last stable Keplerian orbit, namely . The disk color factor was calculated by BRT99 using the known contraints on BH mass and the distance to the source for GRO J1655-40. This value of the disk color factor obtained for GRO J1655-40 was recently confirmed for other Galatic black hole candidates sources. Shrader & Titarchuk (2003) have made use of improved Galactic black hole binary dynamical mass determinations to derive, in effect, an empirical calibration of this factor.
In the soft state the mass accretion rate in the disk is in the order of Eddington, i.e . With assumption regarding , and we obtain
| (22) |
The SMMBHs can be exposed through the accretion, if the mass accretion is at the Eddington rate and higher. The Eddington accretion rate by definition is
| (23) |
Thus for the Eddington rate is about 52 g s-1. The gravitation attraction of the black hole in the Galactic center causes a substantial mass accretion in its proximity. This accretion flow passing through SMMBH which are probably distributed uniformly around the central black hole, provides enough material for mass supply of the SMMBH objects.
Sgr A∗, the massive BH in the Galactic Center was recently found to be surrounded by a cluster of young, massive stars. Over the past year, three of these stars named SO-2, SO-16 and SO-19 by Ghez et al (2004) and Schodel et al (2003) are at Schwarzschild radii from the central black hole. It was also found that these stars can be classified as O stars of the main sequence (Ghez et al. 2003; Eisenhauer et al. 2003). The winds from these stars have a typical mass loss yr-1 and speed in the range km s-1 (Puls et al. 1996; Repolust, Puls & Herrero 2004). Loeb (2004) showed that SO-2, SO-16, SO-19 can supply required mass flow that fuels the emission from Sgr A∗.
Now we can check if this mass accretion rate yr g s-1 can provide the Eddington mass accretion into SMMBH of g s-1. In order to do this one should calculate the SMMBH luminosity of for a given color temperature keV as follows (BRT99)
| (24) |
where is the disk effective radius in Schwarzschild units, and the color factor (see BRT99).
Then we can evaluate the number of SMMBH in the GC region if we assume they are responsible for ray emission about ergs s-1, namely . One can conclude that the mass flow rate g s-1 needed to fuel SMMBH in the Galactic Center region within cm (or within Schwarzschild radii from the central BH) is much smaller then the mass flow g s-1 supplied by the young massive O-stars in this central region. Consequently, we show how the small mass black holes could be exposed when there is enough material around them.
6 Discussion
6.1 The spectrum and origin of X-ray emission of a BH in the Galactic Center
Revnivtsev et al. (2004) claimed that the inferred X-ray spectrum and luminosity of the emission illuminating the molecular cloud Sgr B2’s, strongly support the idea that the X-ray emission of Sgr B2 is Compton scattered and reprocessed radiation emitted in the past by the Sgr A∗ source. We have calculated the pair creation using the inferred luminosity and the inferred spectrum that is a power-law photon spectrum of index 1.8 with an exponential cutoff at 100 keV. In fact, this is a typical spectrum of BH sources at low/hard state which is presumably a result of Comptonization of the soft (disk) radiation in the hot electrons of temperature 50 keV in Compton cloud around central BH.
It has already been shown that the spectral shape in the low hard state is independent of the luminosity (e.g. Laurent & Titarchuk 1999, Titarchuk & Fiorito 2004). We can propose that Sgr A* is now in a quiescent state, presumably a result of the gravitational energy release in the advection dominated flow (see e.g Narayan & Yi 1994).
The luminosity of the X-ray spectrum of the X-ray source IGR J17475-2822 does not change since GRANAT/ART-P and ASCA era, i.e. during last 10 years. The clear match of ASCA/GIS, GRANAT/ART-P and INTEGRAL/IBIS (Fig. 2, Revnivtsev et al. 2004) strongly supports this claim. Thus the proposed incident spectrum emanating from Sgr A* in the past (300 years ago) should not be vary either during the period at least of 10 years. It means that the inferred e+e- rate should be quite stable during the same period. The constraints on the “breathtaking variability on a time scale of only several hundred years” was proposed by Sunyaev et al. (1993). They argue that X-ray echo from Sgr B2 should be delayed by 300-400 years relative to the direct signal from Sgr A∗ due to the light travel time from Sgr A∗ to Sgr B2. One can put the fair question regarding such a short recurrence time for the spectral transition, as 300-400 years for a black hole of mass solar masses.
On the other hand one can suggest the more likely scenario for irradiating Sgr B2 was the interaction between the supernova remnant, we now see as Sgr A East and the km s-1 molecular cloud behind Sgr A∗, rather than Sgr A∗ itself. The luminosity, time scale, and spectrum all fit the requirements rather well, so the need for a high X-ray activity in Sgr A∗ can be weaker now. This effect of supenova (SN) ejecta and its interactions with molecular clouds proposed by Bykov (2002, 2003) is recently discussed in the literature (see e.g. Muno et al. 2004b, and Park et al. 2004). One can be right that “the luminosity, time scale, and spectrum all fit the requirements rather well”. However Park et al. pointed out that although the SN ejecta contribution to the observed neutral Fe line emission appears to be plausible, they noted a caveat, that nonthermal radio emission features have not been reported in the northeast regions of Sgr A∗.
This absence of nonthermal radio features is admittedly a difficult problem in terms of the SNR interpretation. It means that the supernova ejecta model needs the nonthermal distribution of electrons in order to explain the hard X-ray energy spectrum of the Sgr B2 molecular cloud (Revnivtsev et al. 2004). We want to emphasize once again that the spectrum seen from Sgr B2 is a typical spectrum of the low/hard state seen in many BH sources. It has already been proven long ago (see e.g. Sunyaev & Titarchuk 1980) that this hard spectrum is a result of thermal Comptonization of soft (disk) photons in the hot Compton cloud surrounding the central part of a BH. Thus one does not need any fine tuning or nonthermal electron distribution to produce such a spectrum, because in the outskirts of the GC BH there are plenty of molecular clouds, and we should see the effect of the reflection of the BH X-ray spectrum from these configurations. Thus the spectra of molecular clouds are naturally formed as a result of reflection of BH emission from molecular clouds.
6.2 The site and the origin of the annihilation line
In connection with the previous points, one can raise a question related to expected rapid variability in the annihilation line flux for such a compact BH region. However the observations over several decades seem to not show any variability at all.
It is correct to say that the variability in the annihilation line flux would be quite high if this line was formed in the compact central region. However, we propose that the pairs are produced in this compact region and only then do they propagate through the Galaxy and the e+e- annihilation line is formed through the Galaxy. Thus variability of the e+e- annihilation line flux is related to the scale of a few kpc and it is not by chance that observations over several decades seem to not show any variability at all.
We infer that the MeV gamma ray region, where the pairs are created due to X-ray illuminations by the central source, is quite compact. Its radius is cm. This region within cm, is consistent with the COMPTEL map (Schonfelder et al. 2000, Strong et al. 1998). The full sky intensity map, longtitude and latitude profiles for 1-3, 3-10 and 10-30 MeV show the strong peaks within a few degrees near GC. However, the spatial resolution of the COMPTEL map is not better than one degree and thus the compact region of cm cannot be resolved in COMPTEL map. It is worth noting that Strong & Moskalenko (1999) argue that there is an unresolved point-source population in the inner Galaxy and that this source is an important contribution to the emission around 10 MeV.
Producing s-1 (or more, depending on the duty cycle) has consequences beyond simply calculating the annihilation rate. The region surrounding Sgr A∗ is magnetized, with magnetic field strength of order 10 G inside cm . Out to pc the field is turbulent (matching the turbulent plasma generated by wind-wind interactions from the Wolf-Rayet and O/B stars in this region). Melia & Falcke (2001) have suggested that the magnetic field strength of this region should be in the range of mG.
In section 4.2 we review the positron propagation in the Galactic Center region and we find the positrons can pass through there. Consequently the sources of annihilation emission are presumably distributed over the Galaxy.
Recently Liu, Petrosian & Melia (2004), hereafter LPM04, formulated and solved the propagation and acceleration problem in the turbulent magnetized plasma for a given pair flux , magnetic field strength , plasma interaction time , density , the size of the acceleration site and particle distribution of the background plasma.. They showed that acceleration of electrons by plasma wave turbulence in hot gas in the inner-most part of the black hole reasonably account for Sgr A∗’s millimeter and shorter wavelength emission in the quiescent state and for the infrared and X-ray flares. In their model A ( s-1, G) they found the power carried away by accelerated electrons, with , is about ergs s-1; which is more than enough to power observed radio emission, whose liminosity of ergs s-1.
For the pair flux of order s-1, the “collateral” spectrum (and flux) arising from these particles is very consistent with Sgr A∗’s millimeter and shorter wavelength emission in the quiescent state and for the infrared and X-ray flares (LPM04). It is worth noting that the low energy electron flux calculated by LPM04, is comparable with the injected flux . It means that a significant fraction of the low enery electrons escapes from this region without any noticeable acceleration. In fact, the escape time of low energy electrons is more than a factor of 2 shorter than the time scales for acceleration and losses. The exact value of the electron flux depends on the model assumptions (see LPM04); and thus these theoretical uncertainties of the flux estimate (within a factor of a few) are unavoidable. The LPM04’s model also suggested that an outflow of high energy electrons (Liu & Melia 2002) are distributed over a spatially larger scale than that of the BH inner region. Finally the escaping high energy electron gas (cooled through the radiation) could form the annihilation line emission in the large scale of the Galaxy. The LPM04’s injected flux s-1, is related to the mass accretion rate of order of the Eddington value (). If the pairs are accelerated to then their energy would be enough to power the observed radio emission whose luminosity is about ergs s-1.
It is worth noting that within our model, the same flux of pairs ( s-1) is generated in the SMMBH site as a result of X-ray illumination emitted by surrounding material. If at the present time the X-ray flux is of order erg s-1, then the pair flux would be s-1.
6.3 The dark matter problem and its relation to observed annihilation line flux
Dark matter is a long standing puzzle starting from Le Verrier with his discovery of Neptune in 1846 as a perturbation of Uranus (Le Verrier 1846). Our Galaxy is surrounded by an extended halo of unseen material. So far undetected, that dark matter induces a flat rotation curve in the Galactic plane (van Albada & Sancisi 1986). Its presence has been noticed since many decades (see Oort 1932). However, its nature is still unknown. The dark matter problem consists simply, in the existence of invisible mass showing its presence by gravitational effects. Now, it is widely accepted that dark matter exists. In fact, there is evidence for dark matter on scales from galaxy to the cluster of galaxies and to the whole Universe itself. Zwicky (1937) measured the dispersion velocity in the Coma cluster and found that the dynamical mass was hundred times more than the luminosity mass.
Moreover, the dark matter seems essential: the growth of structure in the Universe by hierachical merging of the dark matter halo is a master piece of moderm cosmology. Recently, WMAP has established the presence of non baryonic dark matter with the density reported in terms of critical density of order . This is now the standard value of the modern cosmology for dark matter density.
On the galactic scale, one can interprete the rotation curve measurements by the presence of the dark matter halo and then determine the mass density profile of this distribution. The average density is . The core of this halo seems to be extremely packed. In the Galactic Center, numerical simulations of structure formation in the non-linear regime have shown the presence of a singular power law cusp , where and is the dark matter density at radius pc (Gnedin & Primack 2004). The central density is not uniquely determined and its value depends on models and it varies from 60 to 600 pc-3. On the other hand up to now there is no identification for it despite the large number of candidates proposed from masses in the range between eV to .
While there is no a priori reason to expect that massive compact halo objects (MACHOs) in the mass range comprise a significant fraction of the density of the Universe, neither is there any definitive argument ruling them out. Nemiroff & Gould (1995) and Marani et al. (1999) discuss the possibility of identification of SMMBHs by gravitational lensing. The basic idea is to study the deflection of light by measuring the amplification due to gravitational bending of compact objects. For black hole mass in the range to , the expected image separation is of order of arcseconds and the average time separation between the images is order of s. They applied this delay as an interference process using gamma ray bursters. On the other hand, the absolute value of the light deflection by small black holes is extremely small , where R is the characteristic distance in the Galaxy and therefore not observable. It is easy to show that the optical depth for the photons scattering at small angles by SMMBH is small, () and consequently the light multiple scattering by the small black holes effect is also ruled out.
The supersymmetry theory as an extension of the Standard Model, predicts that one stable particle should be around today as a cosmological relic. Among these new particles, the neutralinos, could be the dark matter. If the dark matter halo of our Galaxy is made up of such particles, they will annihilate each other into fermion-antifermions pairs, and this will produce stable particles which could be detected as anti-protons, electrons and photons. Another way is to look for direct detection via laboratory experiments. Such new particles are scrutinized by direct and indirect searches since more than ten years. Our Galaxy is indeed a subject of intense activities because it could be a direct search for dark matter in studying astrophysical signatures.
Among all the signatures, our Galaxy presents three strong signatures in X-ray, ray backgounds and a typical annihilation source in the Galactic Center. Among the other possibilities, the micro-lensing searches have been developed and used to probe the dark matter halo of our galaxy (see above). The possibility that the halo could be made of primordial black holes is not ruled out by observations. Recently, Seto and Cooray (2004) discussed also the future possibility of searching dark matter candidates using the space-based gravitationnal wave detectors. They used this idea to test the possibility that the halo could be made of primordial black holes. According to Hawking predictions such primordial black holes will not suffer evaporation if their mass is greater than g.
While the consequences of evaporating black holes has been widely analyzed in terms of particles production, the case for stable SMMBHs s has not been considered so far. In literature, the problem is analyzed generically and the mass range used are often very large from g to g.
7 Conclusions
In this Paper, we show that there is a particular black hole mass which is very interesting for the dark matter problem. This mass of order of g, corresponds to a typical Schwarzschild radius proton size order. We explore this possibility in the light of existing galactic diffuse X and backgrounds and with the strong source of annihilation lines at 511 keV in the Galactic Center. Our approach is to find a natural explanation of such astrophysical backgrounds within an astrophysical dark matter scenario.
We also offer a model for the origin of the annihilation line appearance in the our Galaxy which has been detected in several balloon and space experiments. We combine X-rays and -observations of the Galactic Center region to show that pair production can be a result of interactions of X-rays and gamma photons emitted in this region. Pairs production strongly depends on the compactness of the X-rays and emission region which is determined by X-rays and luminosity and size of the region.
For velocity of the interstellar medium of much less than cm s-1 and the value of density column a few times , the optical depth for 511 keV line is more than one. We found for the observed X-rays and luminosities and for the observed annihilation lines flux, the size of the X-ray and emission area is cm. This size is consistent with the size of the area where the OB stars supply sufficient amount of fuel required for the X-rays and emissions from the Galactic Center region.
If we compute the total black hole mass inside this region of radius R= pc, we obtain that this mass is about two solar masses. We can then naturally ask if SMMBHs can be a candidate for dark matter as already proposed in literature ( e.g. Nemiroff & Gould 1995, Marani et al. 1999). It is interesting to compare this number to the dark matter mass computed using the singular power law cusp often used in the dark matter model for the Galactic Center (see Moore et al. 1998 and Gnedin & Primack 2004). We found that with a set of parameters ( pc-3, pc , ), we can obtain a mass of inside the same radius R, which is compatible to our number within a factor of a few.
Koyama (1996) and Muno et al. (2004a), Revnivtsev et al. (2004) noted that the Galactic Center exhibited intermittent activities with time-averaged energy generation rate ergs s-1 comparable to Seyfert nuclei. Muno et al. (2004a) are left to conclude either that there is a significant shortcoming in understanding of mechanisms that heat the interstellar medium in Galactic Center region or that of a population of faint ( ergs s-1) hard X-ray sources. Muno et al. (2004b) using a deep Chandra observations study to detail the origin of the point like sources near the Galactic Center. Possibly a single population of sources may dominate in this cluster. There are certainly many classes of objects present in this set of faint sources. We may suggest that some part of X-ray and radiation of the Galactic Center, can originate in accreting flows into SMMBHs (that are really faint sources with their bolometric luminosity ergs s-1) in which outer parts of flow emit X-rays and the innermost part of the flow emit rays.
Finally we can conclude, that the only way to identify small mass black holes (SMMHHs) is by accretion mechanism in presence of a surrounding dense material. In the absence of this matter these SMMBHs are invisible and can be treated as dark matter, or invisible matter, i.e. without any observational appearance in the radiation.
We appreciate productive discussions with Gerald Shore and Robert Duffin. For this work, L.T. was partly supported by French Ministère de l’Education Nationale et de la Recherche with grant SSHN2004-413077D. We thank the referee for his/her profound questions and we acknowledge the referee’s contribution in the discussion section of this paper.
References
- Aharonian et al. (2004) Aharonian, F., et al. 2004, A&A, 495, L13
- Armstrong et al. (1995) Armstrong, J.W., Rickett, B.J. & Spangler, S.R. 1995, ApJ, 443, 209
- Bananoff et al. (1997) Baganoff, F.K., 2003, ApJ, 591, 891
- Boehm et al. (2004) Boehm, C, Fayet, P., & Silk, J. 2004, Phys. Rev, D69, 101302
- Bykov (2003) Bykov, A.M. 2003, A&A, 410, L5
- Bykov (2002) Bykov, A.M. 2002, A&A, 390, 327
- Borozdin et al. (1999) Borozdin, K., Revnivtsev, M., Trudolyubov, S., Shrader, C, & Titarchuk, L. 1999, ApJ, 517, 367 (BRT99)
- Chakrabarti & Titarchuk (1995) Chakrabarti S.K. & Titarchuk, L. G. 1995, ApJ, 455, 623
- Chapuis et al. (1991) Chapuis, C.G.L. et al. 1991, Gamma-Ray Line Astrophysics, ed. P. Durouchoux & N. Prantos (New York: AIP), 54
- Cheng et al. (1997) Cheng, L.X., 1997, ApJ, 481, L43
- Chez et al. (2004) Chez, A.M., et al. 2004, ApJ, 601, L159
- Chez et al. (2003) Chez, A.M., et al. 2003, ApJ, 586, L127
- Churazov et al. (2005) Churazov, E., Sunyaev, R., Sazonov, S. & Varshalovich, D. 2005, MNRAS, 357, 1377
- Dermer & Skibo (1997) Dermer,C.D. & Skibo, J.G. 1997, ApJ, 487, 57
- Dirac (1930) Dirac, P.A.M. 1930, Proc. Camb, Phil. Soc. 26, 361
- Eisenhauer et al. (2003) Eisenhauer, F., et al. 2003, ApJ, 597, L121
- Gehrels et al. (1991) Gehrels, N., et al. 1991, ApJ, 375, L13
- Gnedin & Primack (2004) Gnedin, O.Y., & Primack, J.R. 2004, Phys. Rev. Lett. , 61, 302
- Guessoum et al. (2005) Guessoum, N., Jean, P & Gillard, W. 2005, A&A, 436,171
- Heitler (1954) Heitler, W. 1954, The Quantum Theory of Radiation, Oxford University Press, Oxford
- Hunter et al. (1997) Hunter, S.D., Bertsch, J.R., Catelli, J.R. 1997, in AIP Conf Proc. 410, 4th Compton Symposium, New York, 1193
- Jean et al. (2005) Jean, P. 2005, A&A in press (astro-ph/0509298)
- Kawai et al. (1988) Kawai, N., et al. 1988, ApJ, 330, 130
- Koyama et al. (1996) Koyama, K., et al. 1996, PASJ, 48, 249
- Koyama et al. (1989) Koyama, K., et al. 1989, Nature, 339, 603
- Laurent & Titarchuk (1999) Laurent, P. & Titarchuk, L. 1999, ApJ, 511, 289
- Le Verrier (1846) Le Verrier, 1846, Astronomische Nachrichten, 25, 65
- Leventhal et al. (1993) Leventhal, M. et al. 1993, ApJ, 405, L25
- Leventhal et al. (1978) Leventhal, M., MacCallum, C.J., & Stang, P.D. 1978, ApJ, 225, L11
- Liu et al. (2004) Liu, S., Petrosian, V., & Melia, F. 2004, ApJ, 611, L101
- Liu & Melia (2002) Liu, S., & Melia, F. 2002, ApJ, 573, L23
- Loeb (2004) Loeb, A. 2004, MNRAS, 350, 725
- Longair (1994) Longair, M.S. 1994, High Energy Astrophysics, Cambridge: University Press
- Marani et al. (1999) Marani, G.F., Nemiroff, R.J., Norris, K. & Bonnell, J.T. 1999, ApJ, 512, L13
- Markevitch et al. (1993) Markevitch, M., Sunyaev, R.A., & Pavlinsky, M. 1993, Nature 364, 40
- Melia (2001) Melia, F. & Falcke, H. 2001, ARAA, 39, 309
- Melrose (1980) Melrose, D.B. 1980, Plasma Astrophysics. Nonthermal Processes in Duffuse Magnetized Plasmas, New York: Gordon and Breach
- Moore et al. (1998) Moore, B., et al. 1998, ApJ, 499, L5
- Morris & Serabyn (1996) Morris, M., & Serabyn, E. 1996, ARA&A, 34, 645
- Muno et al. (2005) Muno, M., et al., 2005, ApJ, 622, L113
- Muno et al. (2004a) Muno, M., Baganoff, F.K, Bautz, M. W. et al. 2004a, ApJ, 613, 326
- Muno et al. (2004b) Muno, M., Arabadjis, F. K, Baganoff, F.K, et al. 2004b, ApJ, 613, 1179
- Murphy et al. (1987) Murphy, R.J., Dermer, C.D., & Ramaty, R. 1987, ApJS, 63, 721
- Oort (1932) Oort J. H., 1932, Bull. Astron. Inst. Netherlands 6, 349
- Narayan & Yi (1994) Narayan, R., et al. 1998, ApJ, 492, 554
- Narayan & Yi (1994) Narayan, R. & Yi, I. 1994, ApJ, 428, L13
- Nemiroff & Gould (1995) Nemiroff, R.J. & Gould, A. 1995, ApJ, 452, L111
- Niel et al. (1990) Niel, M. et al. 1990, ApJ, 356, L21
- Park, et al. (2004) Park, S. et al. 2004, ApJ, 603, 548
- Parker (1979) Parker, E. N. 1979, Cosmical Magnetic Fields, Clarendon Press, Oxford
- Pavlinsky, et al. (1993) Pavlinsky, M., Grebenev, S.A., & Sunyaev, R.A., & 1993, ApJ, 425, 110
- Preddehl, & Trumper (1994) Preddehl, P., & Trumper,J. 1994, A&A, 290, L29
- Puls et al. (1996) Puls et al. 1996, A&A, 305, 171
- Purcell et al. (1997) Purcell, W.R., et al. 1997, ApJ, 491, 725
- Purcell et al. (1993) Purcell, W.R., et al. 1993, ApJ, 413, L85
- Ramaty et al. (1994) Ramaty, R., Skibo, J.G. & Lingenfelter 1994, ApJS, 92, 393
- Repolust, Puls & Herrero (2004) Repolust, Puls & Herrero 2004, A&A, 415, 349
- Revnivtsev et al. (2004) Revnivtsev, M.G., et al. 2004, A&A, 425, L49
- Schodel et al. (2003) Schodel, R., et al. 2003, ApJ, 596, 1015
- Schonfelder et al. (2000) Schonfelder, V., et al. 2000, A&ASS, 143, 145
- Seto & Cooray (2004) Seto, N. & A. Cooray, A. 2004, Phys. Rev. D, 70, 63512
- Share et al. (1990) Share, G.H., et al. 1990, ApJ, 358, L45
- Shrader & Titarchuk (2003) Shrader, C., & Titarchuk, L.G. 2003, ApJ, 598, 168
- Shrader & Titarchuk (1999) Shrader, C., & Titarchuk, L.G. 1999, ApJ, 521, L121 (ShT99)
- Skinner et al. (1987) Skinner, G.K., et al. 1987, Nature, 330, 544
- Smith (2002) Smith, D.M., Heindl, W.A. & Swank, J.H. 2002, ApJ, 569, 362
- Strong & et al. (1998) Strong, A.M., Bloemen, H., Diehl, R., Hermsen, W., & Schonfelder, V. 1998, Proc. 3rd. INTEGRAL Workshop (Eds. G. Palumbo, A.Bazano, & C. Winkler) Astrophys. Lett. Comm. 39, 209
- Strong & Moskalenko (1999) Strong, A.M. & Moskalenko, I.V. 1999, Proc. 5th Compton Symposium (Eds. M. L. McConnell and J. M. Ryan) AIP Conference Proceedings, 510, 291
- Sunyaev et al. (1993) Sunyaev, R.A., Markevitch, M., & Pavlinsky, M. 1993, ApJ, 407, 606
- Sunyaev & Titarchuk (1980) Sunyaev, R.A. & Titarchuk, L.G. 1980, A&A, 86, 121
- Takeshima et al. (1991) Takeshima, T. et al. 1991, in proc. of 28th Yamada Conf., Frontiers of X-ray Astronomy, ed. Y. Tanaka, K. Koyama (Universal Academy Press, Tokyo), 421
- Teegarden et al. (1996) Teegarden, B.J., et al. 1996, ApJ, 463, L75
- Tanaka et al. (1995) Tanaka, Y., Inoue, H., & Holt, S.S. 1995, PASJ, 46, L37
- Titarchuk & Fiorito (2004) Titarchuk, L. & Fiorito, R. 2004, ApJ, 612, 988
- van Albada& Sancisi (1986) van Albada T. S., & Sancisi R., 1986, Phil. Trans. R. Soc. Lond. A, 320, 447
- Watson et al. (1981) Watson, M.G., Willingate, R., Grindlay, J.E., Hertz, P. 1981, ApJ, 250, 142
- Wood et al. (2001) Wood, K.S., et al. 2001, ApJ, 563, 246
- Yamauchi et al. (1990) Yamauchi, S. et al. 1990, ApJ, 365, 532
- Zwicky (1933) Zwicky, F. 1937, ApJ, 86 217