The SAURON project - V. Integral-field emission-line kinematics of 48 elliptical and lenticular galaxies
Abstract
We present the emission-line fluxes and kinematics of representative elliptical and lenticular galaxies obtained with our custom-built integral-field spectrograph SAURON operating on the William Herschel Telescope. H, [O iii]4959,5007, and [N i]5198,5200 emission lines were measured using a new procedure that simultaneously fits both the stellar spectrum and the emission lines. Using this technique we can detect emission lines down to an equivalent width of 0.1Å set by the current limitations in describing galaxy spectra with synthetic and real stellar templates, rather than by the quality of our spectra. Gas velocities and velocity dispersions are typically accurate to within 14 and 20 , respectively, and at worse to within 25 and 40 . The errors on the flux of the [O iii] and H lines are on average 10% and 20%, respectively, and never exceed 30%. Emission is clearly detected in 75% of our sample galaxies, and comes in a variety of resolved spatial distributions and kinematic behaviours. A mild dependence on the Hubble type and galactic environment is observed, with higher detection rates in lenticular galaxies and field objects. More significant is that only 55% of the galaxies in the Virgo cluster exhibit clearly detected emission. The ionised-gas kinematics is rarely consistent with simple coplanar circular motions. However, the gas almost never displays completely irregular kinematics, generally showing coherent motions with smooth variations in angular momentum. In the majority of the cases the gas kinematics is decoupled from the stellar kinematics, and in half of the objects this decoupling implies a recent acquisition of gaseous material. Over the entire sample however, the distribution of the mean misalignment values between stellar and gaseous angular momenta is inconsistent with a purely external origin. The distribution of kinematic misalignment values is found to be strongly dependent on the apparent flattening and the level of rotational support of galaxies, with flatter, fast rotating objects hosting preferentially co-rotating gaseous and stellar systems. In a third of the cases the distribution and kinematics of the gas underscores the presence of non-axisymmetric perturbations of the gravitational potential. Consistent with previous studies, the presence of dust features is always accompanied by gas emission while the converse is not always true. A considerable range of values for the [O iii]/H ratio is found both across the sample and within single galaxies. Despite the limitations of this ratio as an emission-line diagnostic, this finding suggests either that a variety of mechanisms is responsible for the gas excitation in E and S0 galaxies or that the metallicity of the interstellar material is quite heterogeneous.
keywords:
galaxies: bulges – galaxies: elliptical and lenticular, cD – galaxies: evolution – galaxies: formation – galaxies: kinematics and dynamics – galaxies: structure – galaxies: ISM1 Introduction
Early-type galaxies were once considered uniform stellar systems with little gas, dust, and nuclear activity. A number of imaging and spectroscopic studies both from the ground and space have changed this view (see Goudfrooij, 1999, for a review). Based on these surveys, we now know that early-type galaxies commonly contain dust in either organised or complex structures, which is almost always associated with optical nebular emission (e.g., Sadler & Gerhard, 1985; van Dokkum & Franx, 1995; Tran et al., 2001). Early-type galaxies also show nuclear emission in 60% of the cases (Ho et al., 1997c).
Still, a number of issues remain open. What is the origin of the interstellar material in E/S0 galaxies? Is it material lost by stars during their evolution or does it have an external origin? It has long been demonstrated (Faber & Gallagher, 1976) that during their life stars would reinject more than enough material in the interstellar medium to explain the observed gas emission. Yet, the finding that the angular momentum of the gas or the orientation of the dust is very often decoupled from that of the stars (e.g., Bertola et al., 1992; van Dokkum & Franx, 1995) suggests an external origin. And what is its fate? Does it cool down to form stars or does it become hot, X-ray emitting gas? With the advent of new mm-wave detectors and the Chandra space telescope, both molecular gas and X-ray detections have become more common in early-type galaxies (e.g., Young, 2002; Fabbiano, 2003). And finally, what powers the observed nebular emission? Is it a central AGN? Is the warm (K) gas ionised by the hot (K) gas, through thermal conduction (the “evaporation flow” scenario, e.g., Sparks et al., 1989; de Jong et al., 1990)? Is the gas ionised by stars, either young (Shields, 1992) or old (e.g., post-AGB stars, di Serego Alighieri et al., 1990; Binette et al., 1994)? Or is the gas excited by shocks, as also proposed for low-ionisation nuclear emission-line regions (LINERs, Dopita & Sutherland, 1995, 1996). If the extended emission observed in many early-type galaxies is unlikely to be powered by nuclear activity (Goudfrooij, 1999), all other ionising mechanisms are plausible.
So far, the kinematics and ionisation of the gas in early-type galaxies have been studied mostly through long-slit observations (e.g., Zeilinger et al., 1996; Caon et al., 2000; Phillips et al., 1986; Ho et al., 1997b), while imaging surveys have investigated the distribution of the ionised gas and dust (e.g., Buson et al., 1993; Goudfrooij et al., 1994; Macchetto et al., 1996; Tran et al., 2001). Integral-field spectroscopic (IFS) data can combine both spatial and spectroscopic information, mapping the flux and kinematics of the ionised gas across large sections of nearby galaxies. Using two-dimensional measurements it is possible to accurately measure and compare the projected angular momentum of gas and stars, assess the regularity of the gas-velocity fields, and investigate the possible sources of ionisation for the gas.
In this paper we present maps for the ionised-gas kinematics and distribution within the effective radius of 48 representative E and S0 galaxies in both “cluster” and “field” environments, which were obtained with the SAURON integral-field spectrograph (Bacon et al., 2001, Paper I). These galaxies were observed in the course of the SAURON survey, a study of the structure of 72 representative nearby early-type galaxies and bulges. The objectives of the survey along with the definition and properties of the sample are described in de Zeeuw et al. (2002, Paper II). The stellar kinematics for the 48 E and S0 galaxies in the survey are presented in Emsellem et al. (2004, Paper III).
This paper is organised as follows. In §2 we describe the extraction of the ionised-gas kinematics and fluxes, compare the SAURON measurements with published data, and set detection thresholds for the gas emission and the sensitivity of our survey. In §3 we present the maps for the ionised-gas distribution and kinematics, discuss the incidence of emission, and describe the main features of the gas distribution and kinematics. In the same section we also describe the maps for the [O iii]/H line ratio and review systematic differences between the kinematics of the [O iii] and H lines. §4 is devoted to the relation between gas and dust, while in §5 we compare the kinematics of gas and stars in order to discuss the origin of the gas. We further discuss the observed gas phenomenology and draw our conclusions in §6.
2 Measuring the Ionised-Gas Kinematics and Flux Distribution
Within the limited wavelength range of the SAURON observations (4830-5330 Å) there are three well-known emission lines we can expect to detect, the H4861 Balmer line and the [O iii]4959,5007 and [N i]5198,5200 forbidden-line doublets. The starting point for our emission-line measurements is described in Paper II. It consists of measuring the emission lines on residual spectra obtained by subtracting from the SAURON spectra a detailed description for the stellar spectrum, itself constructed for measuring the stellar kinematics. As described in Paper III and in Cappellari & Emsellem (2004), the latter process requires an optimal combination of templates representative of the galaxy stellar population, excluding spectral regions that could be contaminated by emission lines.
Further testing revealed that this procedure does not work well for all emission lines if there is insufficient information in the emission-free part of the spectrum to adequately constrain the stellar population content. Indeed when the wavelength range is limited it is possible that some of the emission lines we wish to measure lie very close to, or are coincident with, the most age- or metallicity-sensitive absorption features. By masking the regions potentially affected by emission, these important absorption features will be partially or even entirely excluded from the template-fitting process. This can lead to substantial biases in the resulting combination of templates, evident in the residual spectrum as spurious features in the masked regions that in turn contaminate the measurement of the emission lines. This is exactly the case for the SAURON observations and particularly for the H and [N i] doublet emission lines. The [O iii] lines are less affected by this problem.
2.1 The Method
In this paper we extend the idea of Paper II, draw from the software of Cappellari & Emsellem (2004), and exploit the results of Paper III to develop a more refined procedure to measure the gas kinematics and fluxes without any spectral masking. The key ingredient is to treat the emission lines as additional Gaussian templates and, while iteratively searching for their best velocities and velocity dispersions, to solve linearly at each step for their amplitudes and the optimal combination of the stellar templates 111The composition of the template library was improved with respect to the one used in Paper III. Three stars from the Jones (1997) library were exchanged with more suitable ones that allowed a better match to the spectra of large early-type galaxies, thus improving the emission-line measurements. The impact on the published stellar kinematics is negligible. , which are convolved by the best stellar line-of-sight velocity distribution (LOSVD). In this way both the stellar continuum and the emission lines are fitted simultaneously.
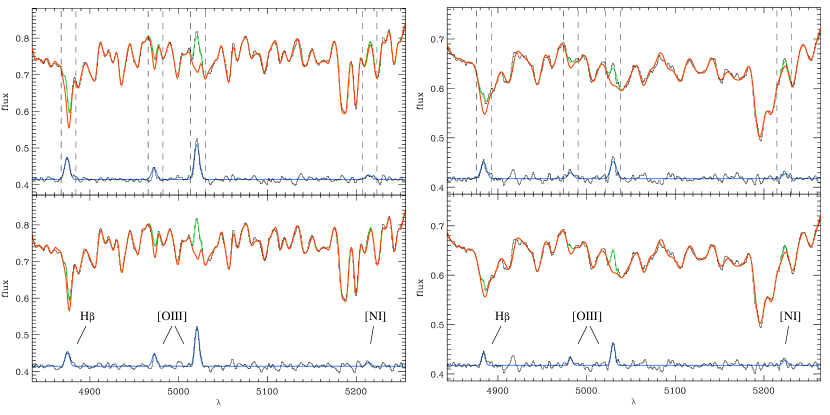
Here we adopt the same stellar kinematics and spatial binning scheme of Paper III (from Cappellari & Copin, 2003) and hence solve for the gas kinematics in exactly the same spectra. Furthermore for each galaxy we adjust the continuum shape of the stellar templates using a multiplicative Legendre polynomial of the same order (typically 6) as needed in Paper III. We adopt a multiplicative polynomial adjustment to ensure that no extra dilution of the absorption features is introduced. As mentioned before, we assume a Gaussian LOSVD for the gas clouds. In the case of doublets, each component has the same mean velocity and width, and their relative strength is fixed by the ratio of the corresponding transition probabilities. Figure 1 shows for two specific cases the advantages of this new method, when all emission-lines are fitted with the same kinematics. Across our sample, template-mismatch features in the masked regions lead to overestimated H fluxes in average by 10% and by up to and, if the [O iii] lines are weak, also to systematically overestimated line-widths by .
In principle, we could have used the new method imposing the same kinematics on lines emitted from different atomic species or while fitting each of them independently. In practise, however, neither the H nor the [N i] lines could be always measured confidently without first constraining their kinematics, as contamination due to template mismatch can still be important even using our new approach.
The main difficulty with the H measurement is the presence of a number of metal features, mainly from chromium and iron, around Å. If we allow the position and width of the H emission to vary, when the stellar templates cannot match the strength of this absorption feature, the overall spectral shape between Å and Å can be described using metal-poor templates and a spurious H line placed roughly half-way between the H and Cr-Fe absorption features. Figure 2 shows an example of this problem. The strength of this emission artifact can be significant and produce a spurious detection. Fortunately, because the spurious H emission always falls at the same wavelength region in the rest frame, the mean velocity of this line appears shifted with respect to the stellar velocity by an approximately constant amount. Hence it is possible to recognise this problem across the field by comparing H velocity maps to the stellar velocity maps (Figure 2).
The lines of the [N i] doublet are normally quite weak so that it is almost never possible to constrain their kinematics independently. To complicate matters further, the [N i] doublet sits close to the continuum region that is generally the worst matched by the templates, because of an enhancement in the magnesium over iron ratio that is neither included in the Vazdekis (1999) models (which form the bulk of our template library) nor observed in stars in our Solar neighbourhood. The impact of template-mismatch on the measurement of the [N i] lines is therefore more difficult to estimate than in the case of the H emission.
To measure the fluxes of the H and [N i] lines we therefore constrained their kinematics to those of the [O iii] lines, which was obtained first.
Using the spatial binning, spectral library, and stellar kinematics of Paper III, we obtain the emission-line fluxes and kinematics in each (binned) spectrum of our sample galaxies by following these exact steps:
-
a)
Mask all spectral regions within of the location of the H and [N i] lines at the galactic systemic velocity , taken from Paper III. This covers the typical range of emission-line velocities and widths found in a preliminary analysis of our sample.
-
b)
Convolve all stellar templates in our library with the corresponding best stellar LOSVD from Paper III.
-
c)
Solve for the best amplitude , mean velocity and intrinsic velocity dispersion of the [O iii] lines, while also optimising the continuum shape of the templates using a multiplicative polynomial adjustment. is used as initial velocity guess for .
-
d)
Remove the mask and find the best for all the lines, while imposing on them the [O iii] kinematics.
More specifically, at step c) the best and and the best coefficients of the multiplicative polynomial correction are found through a Levenberg-Marquardt least-squares minimisation. At each iteration we construct a Gaussian template for each emission line with the current position and width (accounting for the SAURON spectral resolution), and with unit amplitude. For the [O iii] doublet, the template is formed by two Gaussians, with amplitude of 0.33 for the [O iii]4959 line (Storey & Zeippen, 2000). After multiplying the convolved stellar templates by the current polynomial correction, we fit for the best linear combination of both stellar and emission-line templates (with positive weights), excluding the regions potentially affected by H and [N i] emission using the mask built in a). The weights assigned to the emission-line templates provide the best emission-line amplitudes at each iteration, and eventually, the final best values.
Step d) is similar to c), although only the coefficients of the polynomial adjustment are solved for non-linearly, while the contribution of the stellar and emission-line templates is still optimised at each iteration. Gaussian templates are constructed also for the H and [N i] lines, and the entire spectrum is used in the fit.
In order to follow the most general method described at the beginning of this section, only steps b) and c) are needed, without masking any spectral region and by searching for the gas kinematics of all lines at the same time.
2.2 Constructing the Emission-Line Maps
In our sample galaxies the ionised-gas emission is neither uniformly distributed nor always strong enough to be detectable. It is therefore crucial to understand the level to which we are confident of detecting gas emission. In Appendix A we present a number of experiments specifically designed to address this issue, and here we summarise the results obtained there.
The accuracy with which the position and width of an emission-line can be recovered depends on how much the line protrudes above the noise in the stellar spectrum. We call this quantity the line amplitude-to-noise ratio, hereafter . The accuracy in recovering the amplitude of a line, on the other hand, scales only with the noise level in the spectrum. The ability to estimate the amplitude of the lines is also the dominant factor in the error budget of the line fluxes. Hence, in the limit of purely statistical fluctuations the line fluxes are subject to larger errors in spectra of higher quality, although the equivalent width of the lines is better estimated at these regimes. Better spectra also allow a more accurate description of the stellar continuum, which is equally crucial to the emission-line measurements.
Indeed, since emission lines are measured while simultaneously fitting the stellar spectrum using a template library, any systematic mismatch between the templates and the galaxy stellar population will constitute a further source of error. It is therefore important to include such deviations when estimating the noise level against which the emission-line amplitudes are compared. We use a robust biweight estimator (Hoaglin et al., 1983) to measure the scatter in the residuals of the fit to the integrated stellar spectrum, as an estimate of both statistical fluctuations and systematic deviations. We will refer to this as to the “residual noise”.
The simulations of Appendix A also show that the formal uncertainties returned by our emission-line fitting procedure correctly estimate the accuracy with which the input parameters are recovered. At low , however, our measurements become dominated by systematic, rather than random, effects and the formal uncertainties cannot account for the observed biases. The minimum values below which these problems arise naturally sets our detection threshold.
According to our emission-line measurement scheme, we must first assess the presence of the [O iii] emission, without which no other emission line can be detected. The simulations show that our ability to estimate the velocity dispersion of the [O iii] lines steadily deteriorates for , while the line fluxes start to be overestimated by more than 10% for . As these experiments cannot fully account for the limitations of our template library, we conservatively settled on an overall threshold of 4. This limit was chosen also considering that in galaxies with larger velocity dispersions the impact of template-mismatch can be more important and cause the line widths to be overestimated, as shown by our experiment based on independent fits to the two lines in the [O iii] doublet (§A.5). For an intrinsic and the simulations show that the errors on and are typically 25 and 40 , respectively, while errors on fluxes are 30%. The large error on the intrinsic is not due to a poor fit but arises because the instrumental resolution is much larger than the adopted value of 50 . In fact, the observed width of the lines is matched to within 17 . Measurements for intrinsically broader lines will be more accurate for a given .
When [O iii] lines are detected, H emission is also likely to be present. The possibility that the H emission could be dominated by gas with different kinematics than that contributing to the [O iii] emission will not change our ability to estimate the H fluxes. Indeed, the accuracy in recovering fluxes is not dramatically affected by how well the position and width of the lines are measured. This is not only observed in our simulations, but also in the few galaxies where the [O iii] and H lines could be fitted independently (§3.5). When we impose the [O iii] kinematics on the H line, our simulations show that, for , the estimates of the H flux are unbiased. At this level, they are accurate to within 30%. Unbiased H fluxes can be measured with lower because the H fit involves a lower number of parameters ( and are fixed). Considering that template-mismatch affects the measured H fluxes even in the framework of ideal simulation, we conservatively settled on a threshold of 3 for this line.
Finally, we come to the harder problem of assessing the presence of the [N i] doublet. These lines are the most affected by our limited ability to describe the stellar populations of our sample galaxies, a problem that we cannot properly simulate. The most likely source of template mismatch in this spectral region is the absence of templates with super-solar abundance ratios. A more robust detection threshold can be established by comparing the [N i]5200 amplitude to the residual-noise level measured more specifically in the Mg region, . Furthermore, we do not expect to observe [N i] lines without strong H and [O iii] emission. Hence, we consider the detection of the [N i] doublet to be reliable only if both the H and [O iii] lines have already been detected, and if the [N i] lines satisfy the quite conservative detection requirement of .
For our survey we will therefore show maps for the flux, equivalent widths, velocity, and velocity dispersion of the [O iii] emission-lines for which . Maps for the flux and equivalent width of the H lines and for the [O iii]/H ratio will show regions where additionally for the H line. We will not show maps for the [N i] lines, as these are detected only in the central regions of 13 objects. Instead, the galaxies with [N i] emission are listed in Table 1.
To conclude, we stress that the detection thresholds adopted here will never perfectly exclude all spurious measurements or guarantee that all regions with real emission appear the maps. For completeness, the public data release will contain all emission-line measurements with associated errors, for all spectra corresponding to single lenses or larger spatial bins shown in the maps, with a flag marking the measurements we deem unreliable.
2.3 Sensitivity Limits
The detection thresholds adopted in the previous section set the sensitivity of our survey. The equivalent width () of the weakest [O iii] and H lines that we detect are around 0.1Å and 0.07Å for the [O iii]5007 and H lines, respectively. These limits can be understood as follows. If is the continuum level in the spectra, the flux in the lines, and their typical observed widths, then an threshold can be translated into a limiting considering that for a Gaussian line:
| (1) |
Hence, for emission lines with a typical intrinsic broadening of 50 , which due to instrumental broadening appears as 120 , or 2Å at 5007Å, the of a barely detected [O iii]5007 line () would be 0.2Å for .
In the nuclear region of our sample galaxies the SAURON spectra are of extremely high quality, with nominal up to 500 per pixel, so that very weak lines should be detected. However, what matters for the detection of emission lines is the “residual noise”, not just the statistical fluctuations in the stellar spectrum. When the “residual noise” is compared to the continuum level, the corresponding ratios reach values only up to , dominated by template mismatch. With this upper limit for the limits become 0.1Å for [O iii]5007 and 0.07Å for H, as found. At a lower surface brightness level, however, the statistical fluctuations still dominate the “residual noise”, and the signal-to-noise ratio is close to nominal. In Paper III we adopted a binning scheme with . Therefore our sensitivity is never worse than 0.3Å and 0.2Å for [O iii]5007 and H, respectively.

2.4 Comparison with Published Emission-Line Measurements
In Paper II we showed for NGC 5813 that the SAURON ionised-gas kinematics is consistent with published data. An ideal source for a more general comparison is the Palomar spectroscopic survey of Ho, Filippenko, & Sargent (1995, 1997a), who observed 37 of our 48 sample galaxies and also carefully subtracted the stellar light prior to the emission-line measurements. We compare the [O iii]/H emission-line ratios as well as the width of the forbidden emission, in this case relating the SAURON [O iii] lines width to the [N ii]6583 width of Ho et al. (1997a). For consistency with the Palomar data, we analysed nuclear spectra extracted from our SAURON cubes within central apertures that match the size () and orientation of the Palomar long-slit observations. For these spectra we first derived the stellar kinematics as in Paper III, using the penalised pixel fitting algorithm of Cappellari & Emsellem (2004), and then followed our procedure to measure the gas emission.
The result of this comparison is shown in Figure 3 for the 21 objects with measured emission-lines in the Palomar survey. Considering the number of possible systematic factors that could enter this exercise (e.g., different observing conditions, data quality and reduction, starlight subtraction), the agreement between the SAURON and Palomar measurements is satisfactory, as these are on average consistent to within 20% (see Figure 3). In particular, for the [O iii] over H ratios, the quality of the Palomar blue spectra is significantly worse than that of the SAURON data, with nominal per pixel as opposed to at least 500 for our nuclear extractions. On the other hand, the higher quality of the Palomar red spectra () is consistent with the better match between the widths of the [O iii] and [N ii] lines.
Forbidden lines can have different widths depending on their respective critical densities (Filippenko & Halpern, 1984; de Robertis & Osterbrock, 1986). The fact that in the majority of the SAURON galaxies the width of the [N ii] lines is comparable to that of the [O iii] lines could be explained if emission predominantly originates in low-density reservoirs, as suggested by Ho et al. (1997b) in the case of [N ii] and [S ii], which also often display similar widths. On the other hand, the origin of the four outliers in Figure 3 with significantly broader [O iii] lines can be explained considering that, according to the positive correlation between line width and critical density, [O iii] should be broader than [N ii].
Of the 16 objects that Ho et al. identified as emission-line free, 9 show clear emission in the SAURON central apertures. Apparently low-luminosity nuclear activity in early-type galaxies is even more common than already established.
3 Ionised-Gas Distribution and Kinematics
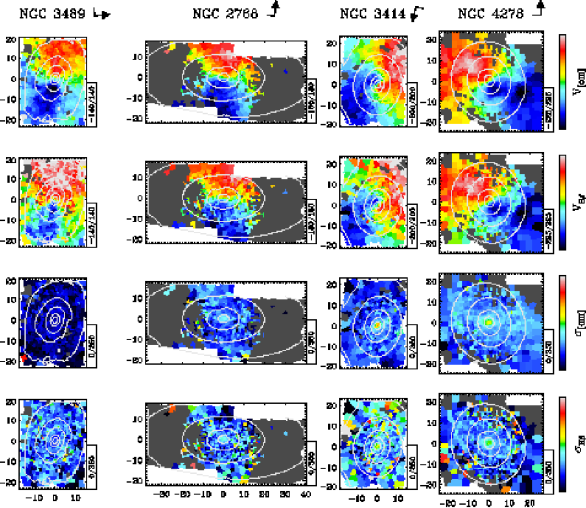
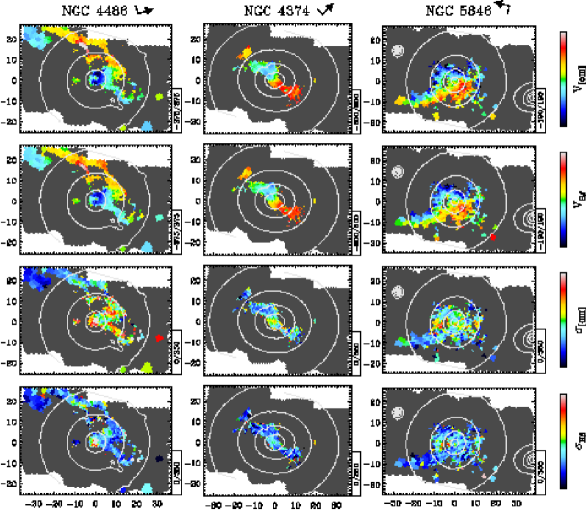
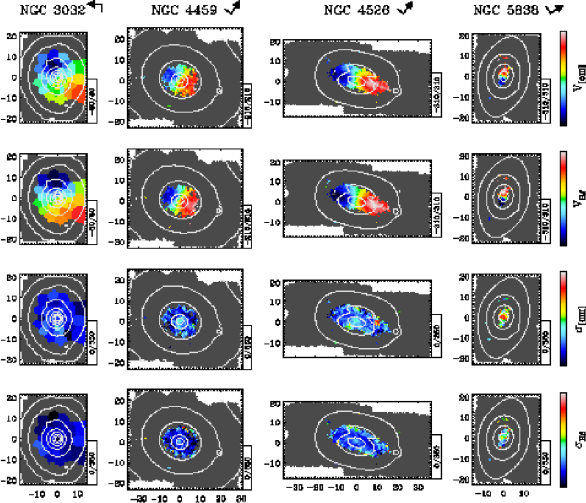
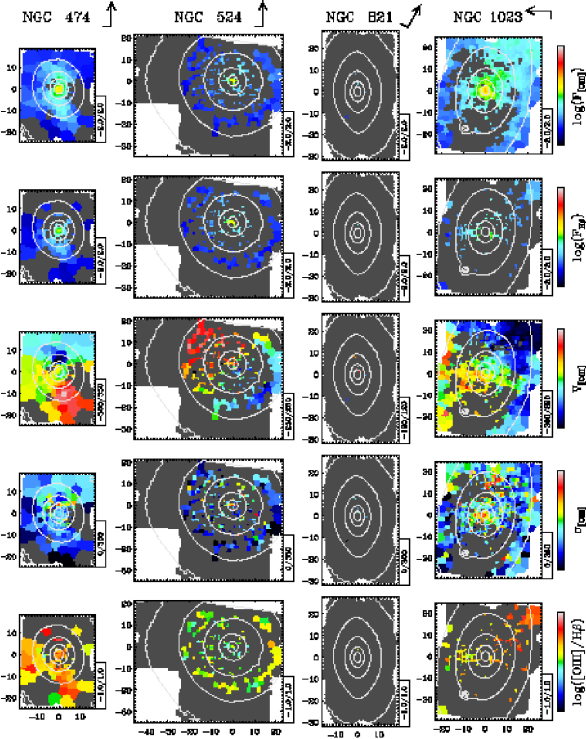
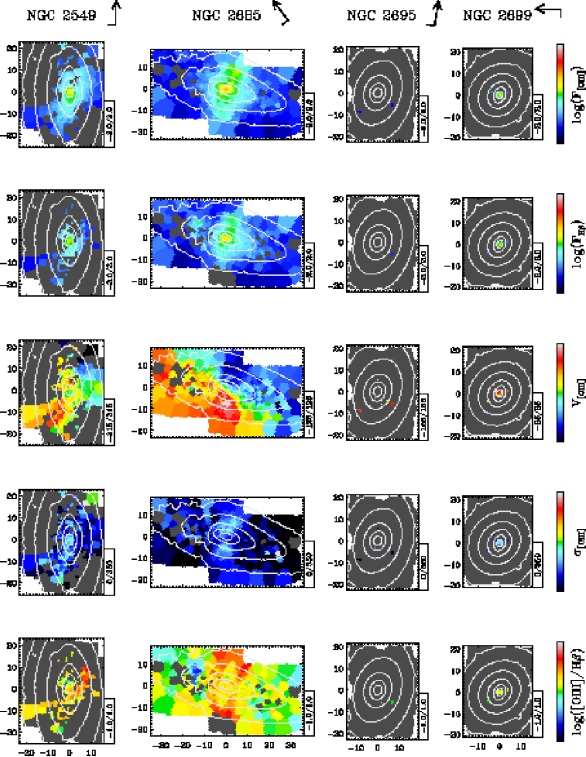
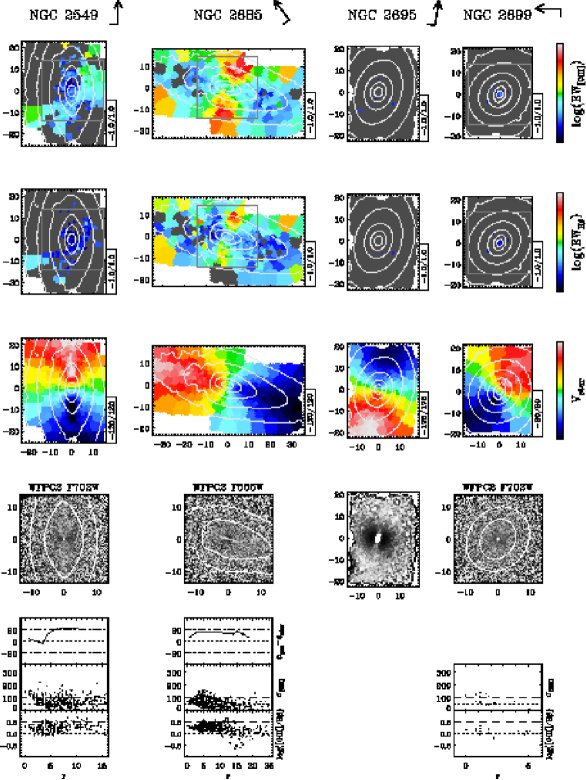
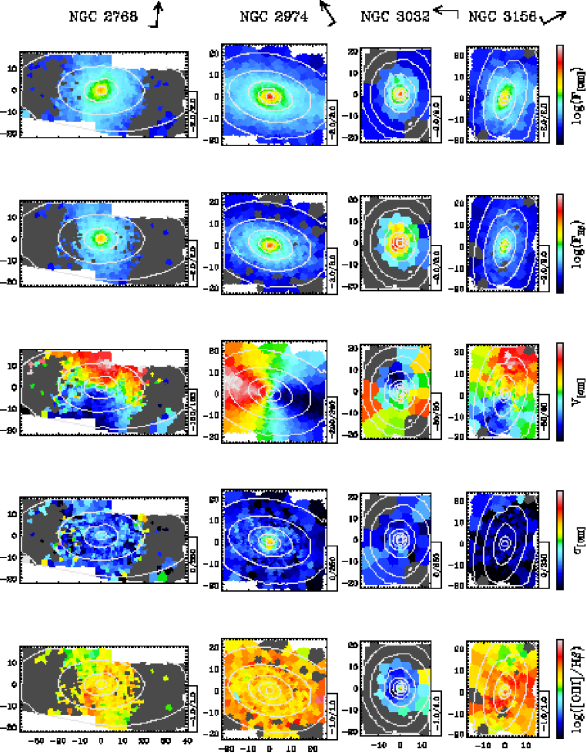
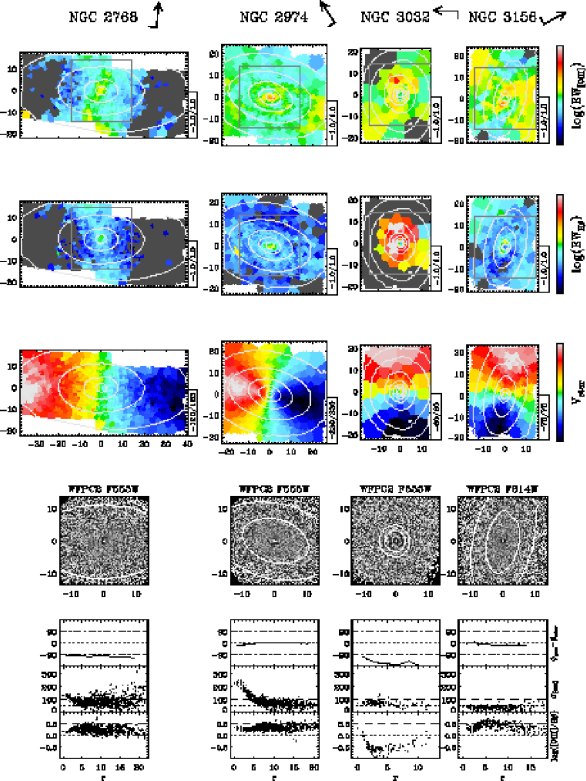
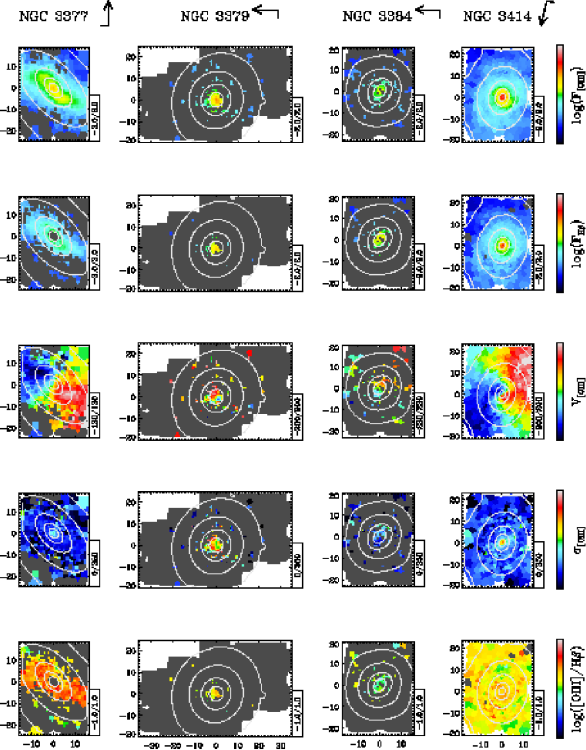
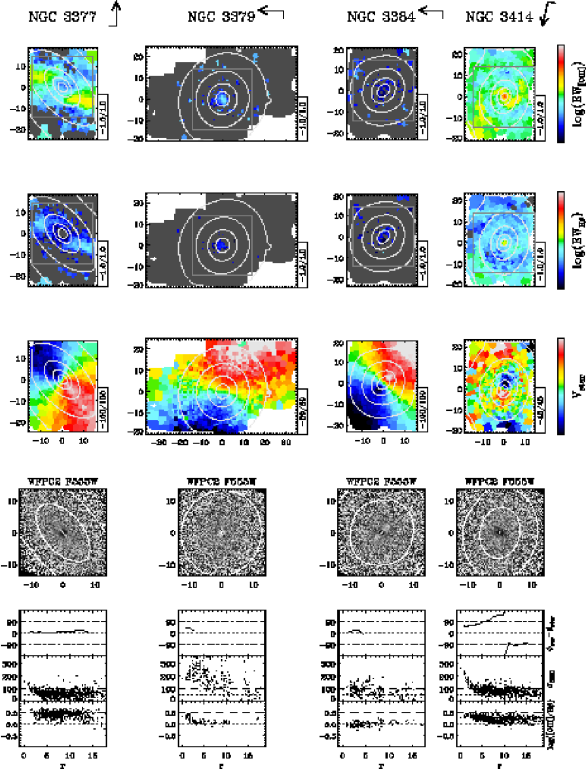
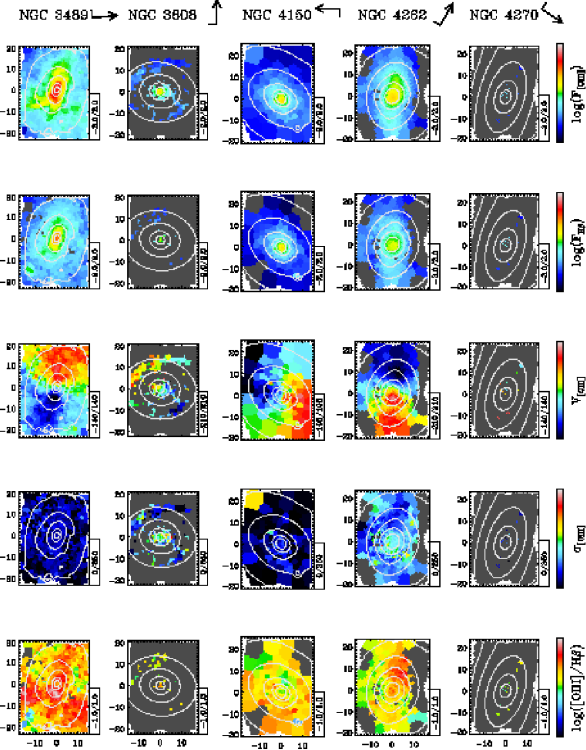
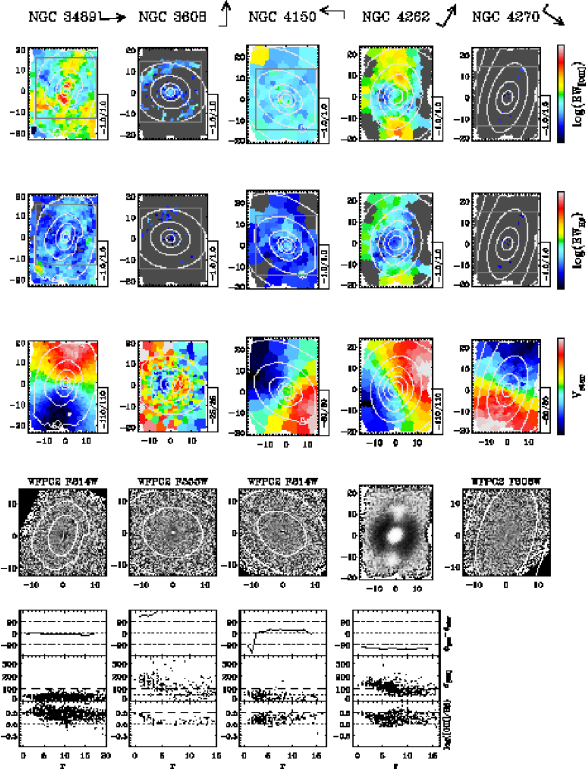
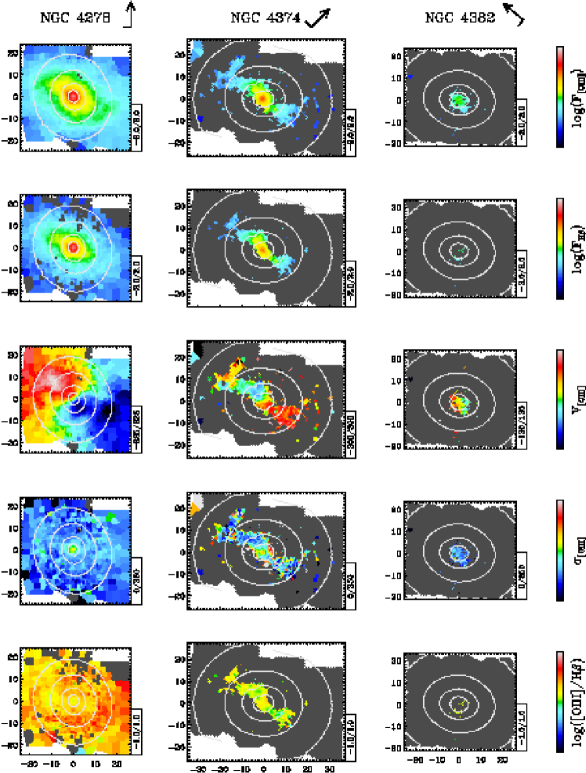
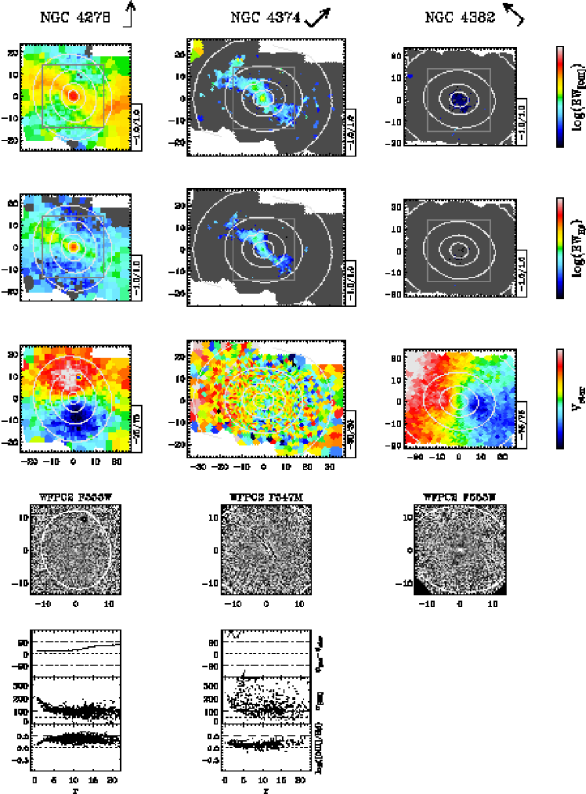
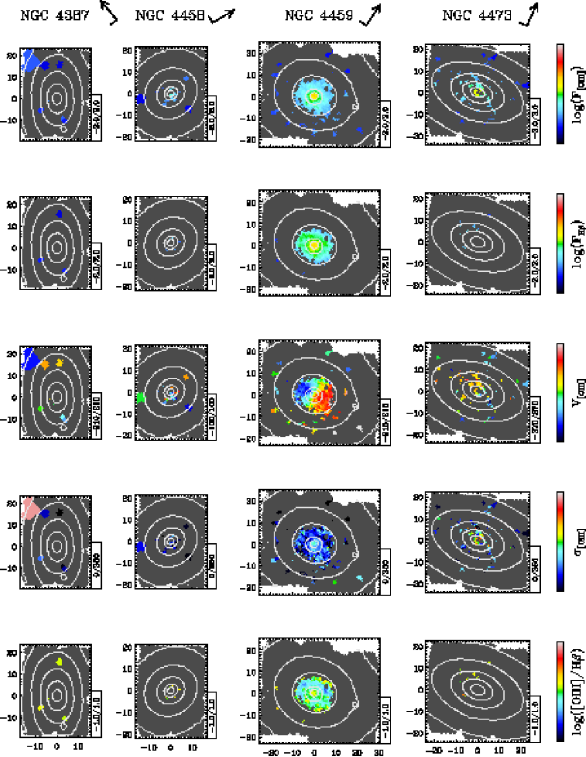
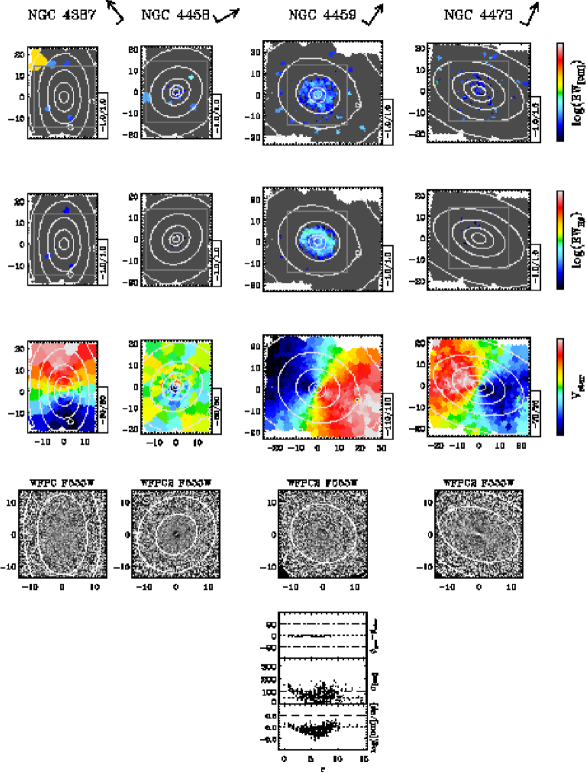
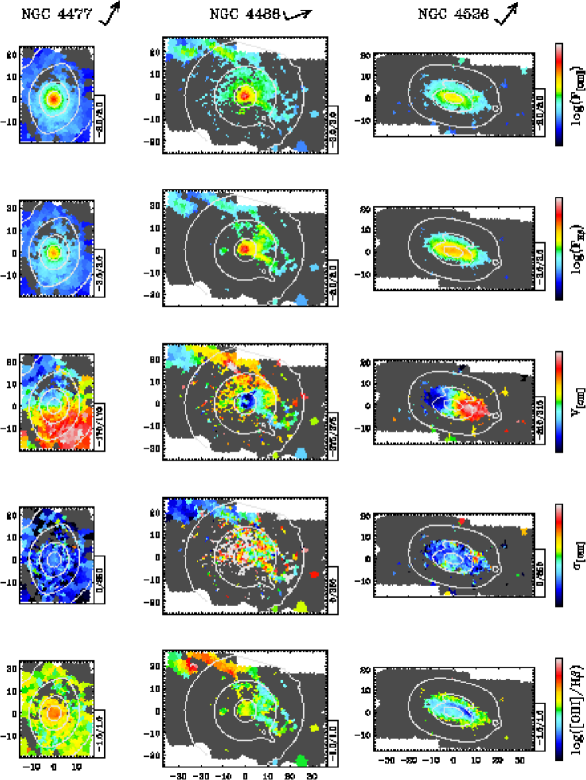
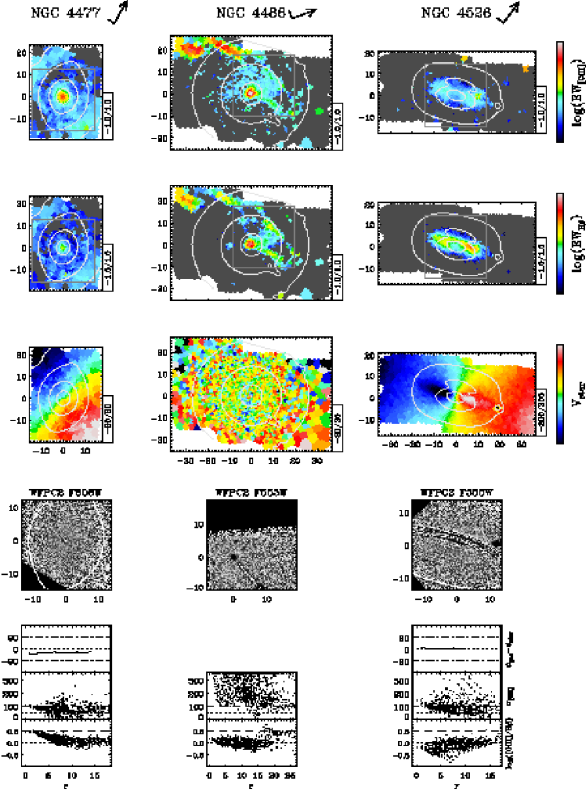
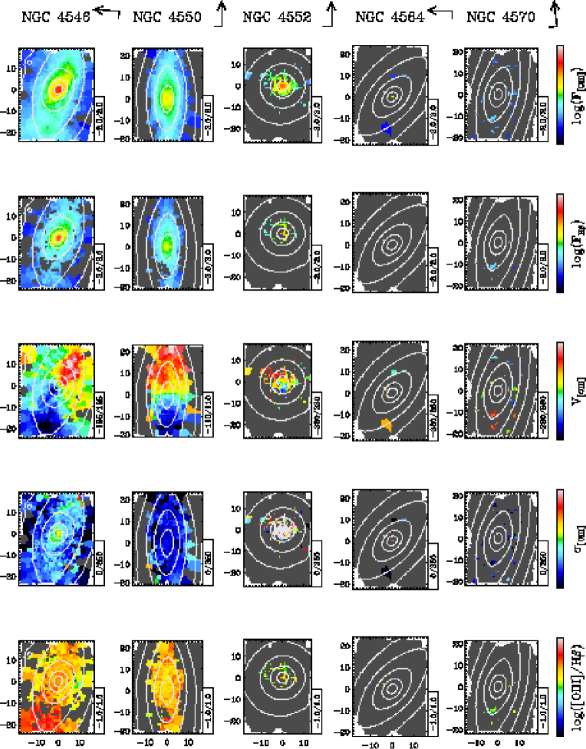
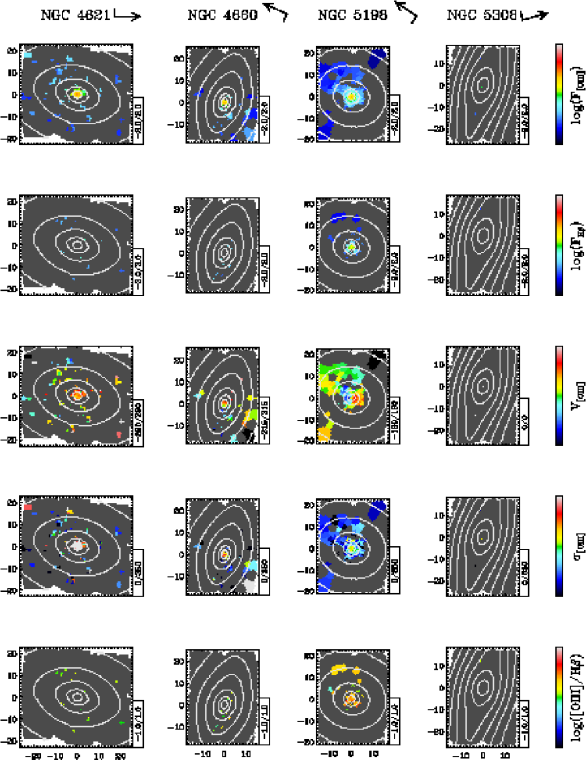
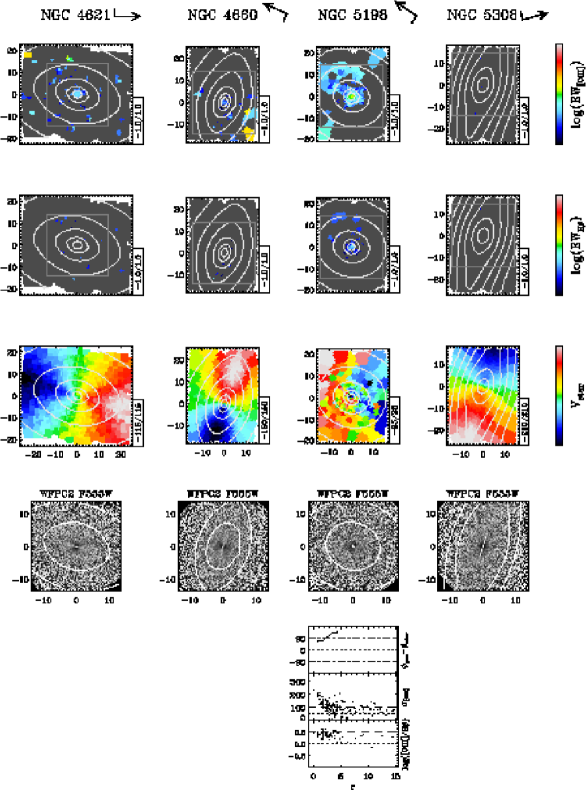
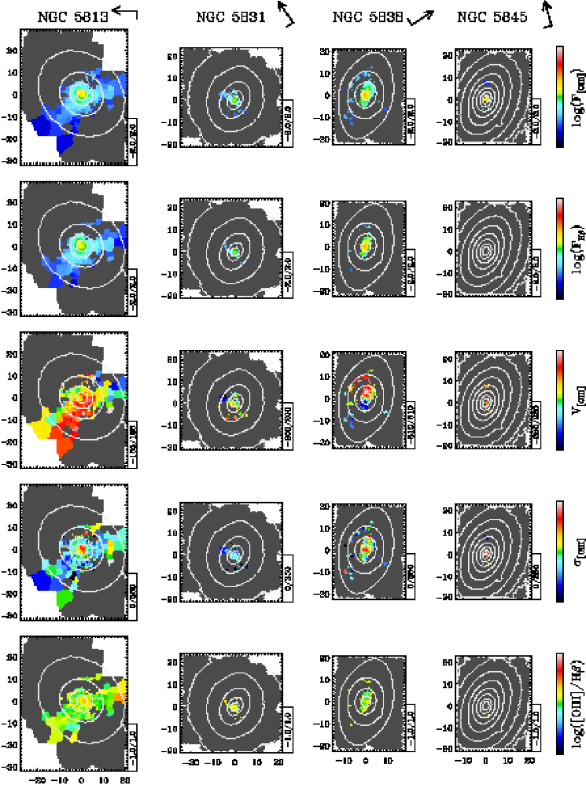
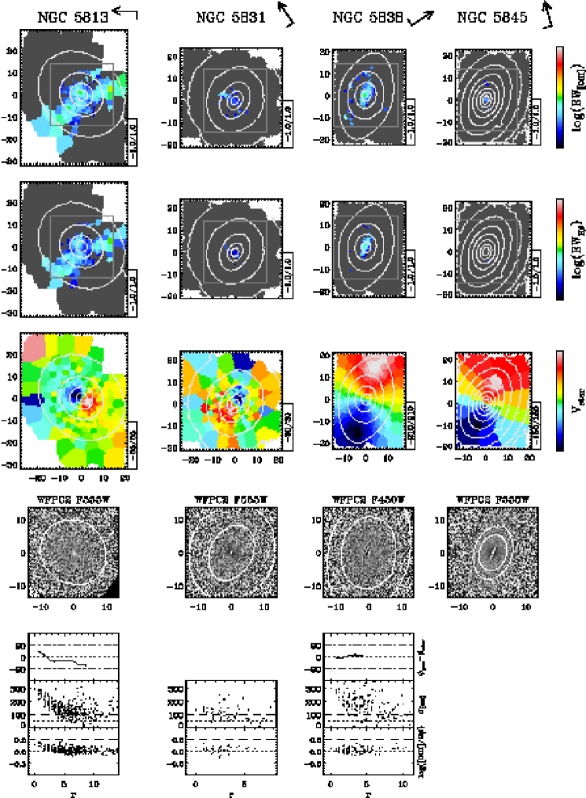
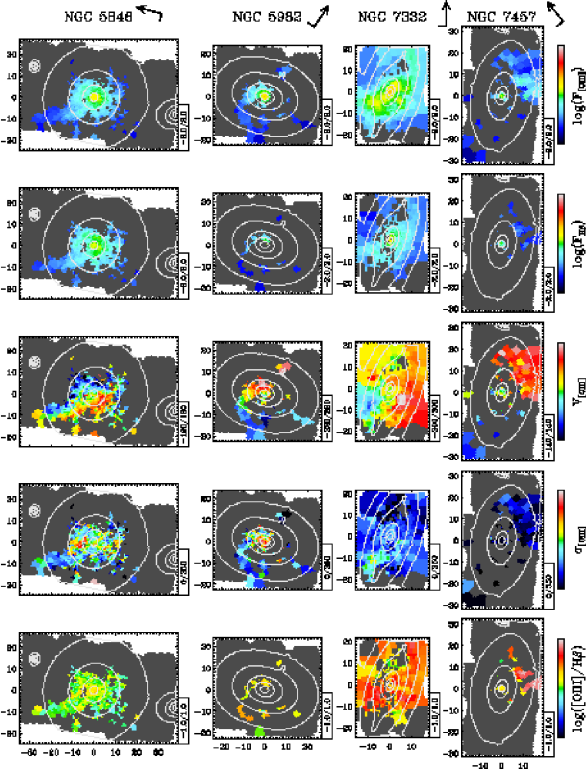
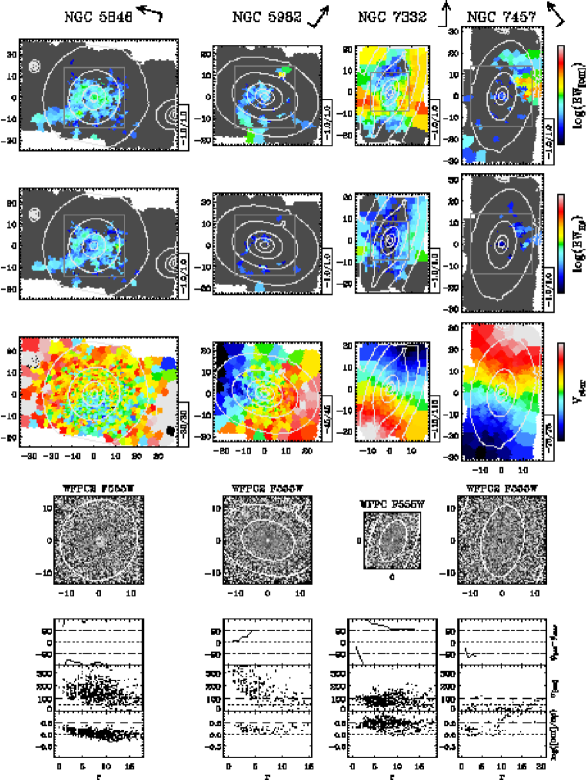
Figure 4a-4b shows maps for the flux and equivalent widths of the [O iii] and H emission lines, for the velocity and intrinsic velocity dispersion of the [O iii] lines, and for the [O iii]/H ratio of all 48 E and S0 galaxies in our sample. The maps were constructed according to the detection thresholds set in §2.2. The SAURON observations were not always carried out in photometric conditions. Therefore the derived fluxes should be considered only as approximate values.
Appendix B contains a description of the gas distribution and kinematics in each of our sample galaxies, along with comments on the dust distribution, the connection to the stellar kinematics, the [O iii]/H ratios, and references to previous narrow-band imaging and long-slit spectroscopic work. In the following we quantify the incidence of ionised-gas emission and describe the general properties of the gas distribution, the morphology of the gas velocity and velocity dispersion field, and the range of [O iii]/H ratios observed in Figure 4a-4b for galaxies with clear emission-line detections. We will also briefly investigate the presence of systematic differences between the kinematics of the [O iii] and H lines.
3.1 Incidence of Ionised-Gas Emission
The maps reveal that ionised-gas emission is very common in early-type galaxies, and that it comes with a variety of spatial distributions, degrees of regularity in the observed kinematics, and large variations in the [O iii]/H ratio. [O iii] and H emission is clearly detected in 36/48 galaxies in our sample (75%), while in a further 7 objects we found either weak central [O iii] lines only (NGC 4382, NGC 5845) or patchy traces of emission (NGC 4270, NGC 4458, NGC 4473, NGC 4621, NGC 4660). Whether strong, weak or patchy, such emission is always spatially resolved. Just 5 galaxies do not show any significant emission (NGC 821, NGC 2695, NGC 4387, NGC 4564, NGC 5308). [N i] lines are found in 13 galaxies. Table 1 lists the basic properties of the E/S0 SAURON sample and identifies galaxies in which H and [O iii] emission was detected, and where [N i] lines were found.
Among the clear detections, the incidence of emission lines is higher in lenticular galaxies, where emission is found in 20/24 objects (83%), compared to 16/24 (66%) for ellipticals. The dependence on the galactic environment appears similarly marginal, with 20/24 field galaxies showing emission compared to 16/24 in clusters, where the definition of “field” and “cluster” is as in Paper II. However, the fraction of galaxies with clearly detected emission in the Virgo cluster drops to only 55% (10/18), with just 3/9 ellipticals showing the presence of ionised gas. These 3 galaxies are also the brightest ellipticals that we observed in Virgo. More generally the incidence of emission does not seem to depend on the galaxy luminosity. The incidence of gas emission is the same for barred and unbarred S0 galaxies.
Table 1 also lists the total flux of the H emission in each galaxy with clearly detected emission. This includes the contribution of regions where only the [O iii] lines were detected, assuming a constant line ratio of [O iii]H . Assuming Case B recombination, a temperature of , and an electron density of , we also report total H luminosities and ionised-gas masses (following Kim, 1989). In computing the H luminosity we adopted the distance moduli of Paper II, and used the theoretical value of 2.86 for the flux ratio of the H and H lines (Osterbrock, 1989), thus ignoring the impact of dust absorption which would lead to higher H luminosities and larger gas masses. We caution against using such flux and mass measurements for quantitative applications.
3.2 Ionised-Gas Distribution
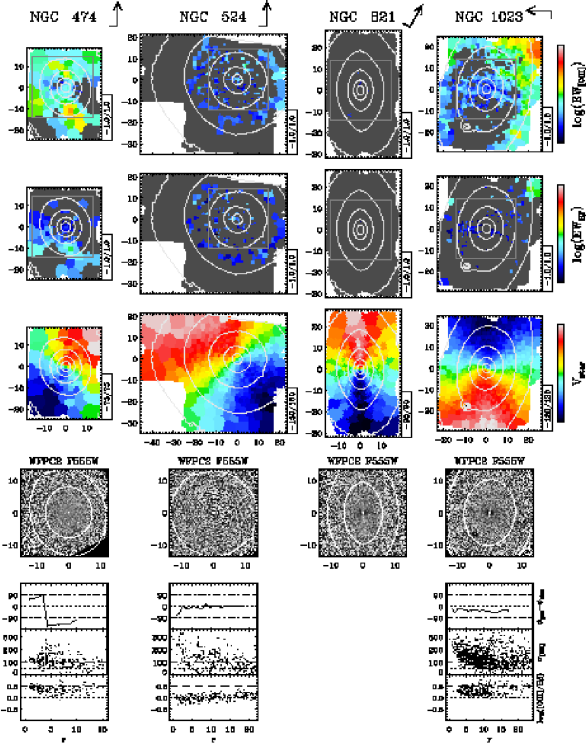
The distribution of the ionised-gas is traced by the flux maps in Figure 4a. Figure 4b also includes maps for the of the lines, which highlight structures in the emission-line distribution that are otherwise hidden in the flux maps (e.g., NGC 2974, NGC 3414). This is because the flux distribution of the lines mostly follows that of the stellar continuum, with a wide dynamic range. Small fluctuations are therefore harder to recognise in the flux maps, whereas the -maps have the variation of starlight divided out. Although structures are not directly related to the flux distribution of the lines, they show specific emission regions such as rings or spiral arms. The -maps also provide a picture of the robustness of our emission-line measurements and illustrate how close they come to the detection limit. The is indeed closely related to the ratio (Eq. 1), which sets our detection thresholds and defines the accuracy of the kinematic measurements. The -maps should be used only as supplementary tools to the flux maps when investigating the gas distribution. Overall, by complementing the flux maps with the -maps, a better picture of the ionised-gas distribution emerges.
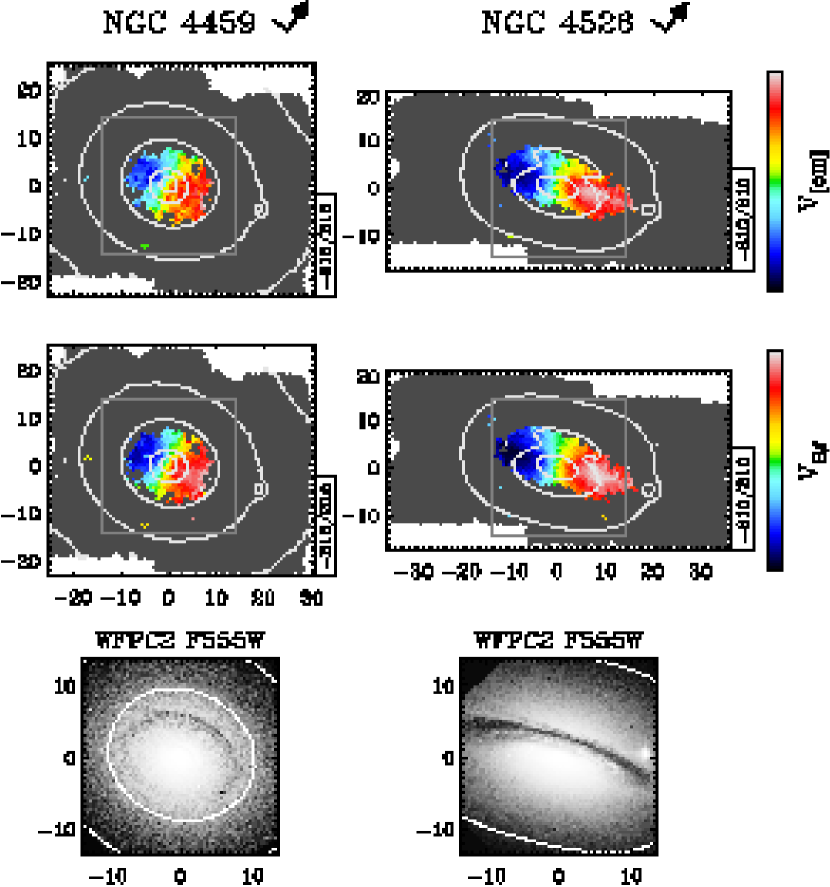
The simplest case is that of an extended distribution consistent with a disk of gas. NGC 524, NGC 4459, NGC 4526, NGC 5838 belong to this category, as do the polar-ring galaxies NGC 2685 and NGC 2768 where the gas distribution is perpendicular to the stellar body. Additional spiral or ring features are found in NGC 2974, NGC 3414, NGC 4550, and possibly in NGC 3608. In some other galaxies (NGC 5198, NGC 5846, NGC 5982) an elongated structure extends from a central disk. A very distinct class of objects is formed by galaxies where a loosely-wound spiral feature, similar to an integral sign, is superimposed on a more diffuse component (e.g., NGC 474, NGC 3377, NGC 4262, NGC 4278, NGC 4546). Among more complex distributions are NGC 3156 and NGC 3489, which exhibit a central ring and filamentary structures, and objects characterised by outer emission-line regions that are strongly misaligned with the main body of the galaxy (NGC 1023, NGC 2549, NGC 7332, NGC 7457). Finally, there are giant ellipticals where the gas distribution is mainly confined to lanes across the galaxy (NGC 4374, NGC 5813) or in filaments (NGC 4486).
We note that planetary nebulae (PNe) could be responsible for many of the isolated patches of [O iii] emission observed in our sample galaxies. For instance, the typical observed fluxes of the PNe in NGC 3379 ( for a narrow-band magnitude , Ciardullo et al., 1989) would correspond to equivalent widths well above our sensitivity limit, except in the very central region (within 5″) and for the largest outer bins. The detection of PNe in NGC 3379 is discussed in Appendix B.
3.3 Ionised-Gas Kinematics
3.3.1 Velocities
A number of galaxies clearly show very regular gas velocity fields consistent with circular gas motions in a disk (e.g., NGC 524, NGC 4459, NGC 4526). Yet, the majority of the objects appear to deviate from this simple situation, showing gradual twisting of the overall velocity field (NGC 2974, NGC 3377, NGC 3414, NGC 4278), more complex leading or trailing features (e.g., NGC 2768, NGC 4550), and sometimes both (NGC 3489, NGC 4374). More mundanely, heavy spatial binning or weak emission leads to more noisy velocity fields (e.g., NGC 4150). In some objects the radial variation of the gas angular momentum is more abrupt. NGC 474 is the clearest example of this behaviour, but also NGC 2549, NGC 7332, NGC 7457, and possibly NGC 1023, show kinematics that are distinct in the inner and outer regions. Overall across our sample the gas kinematics are never irregular, the only exception being NGC 4486.
We note that regular motions occurs preferentially in objects with a regular disk distribution, while a more complex kinematic behaviour follows the presence of additional features in the gas distribution, such as integral-sign and spiral structures. In particular, all objects with relatively strong, misaligned emission in their outer parts (e.g., NGC 2549), also show strongly decoupled external and internal gas motions, with the innermost system being more likely settled onto the equatorial plane.
3.3.2 Velocity Dispersions
The accuracy of the measurements is more sensitive to the impact of weak emission than for the measurements. This is exhibited as an increasing fluctuation in in regions with barely detected [O iii] emission (e.g., NGC 4374). At low the width of the lines also tends to be overestimated, due to template mismatch and correlation in the random fluctuations in the spectra (see §A.3 and §A.5).
The -maps appear more uniform than the and maps, and are characterised by little variation of over large regions and by the presence of a central gradient. Both the typical width of the lines in the outer regions and the magnitude of their central increase can vary considerably. This is evident when the -values are plotted against their distance from the centre (Figure 4b). In some cases the intrinsic dispersion of the lines remains as high as 100 in the outer parts (e.g., NGC 4278, NGC 4546) while in other falls to 50 (e.g., NGC 3489, NGC 3156). Central values of reach 200 (e.g., NGC 2974, NGC 3414). In other cases remains constant (NGC 3489). The morphology of the central peaks can vary, from sharp (e.g., NGC 3377) to very extended (e.g., NGC 2974), elongated (e.g., NGC 2768, NGC 3414), and even asymmetric (e.g., NGC 4262, NGC 4278, NGC 4546). Finally, some objects show peculiar -features (e.g., NGC 474 and NGC 2685).
Except for asymmetric -peaks that occur in objects with integral-sign -patterns, the most significant characteristics of the -maps do not appear to correlate with the morphology of the gas distribution and velocity field. In the central regions, however, the observed velocities are important to understand whether the -gradients are due to unresolved rotation, an AGN, or a genuine increase of . Detailed models are needed to address this issue, but we expect the effects of purely unresolved rotation to be rather limited and confined to the seeing-dominated regions. The strongest and most extended -gradients therefore suggest an intrinsic rise of (e.g., NGC 2974, Krajnović et al., 2005). On the other hand, the case for unresolved rotation is particularly strong for sharp peaks that are elongated along the direction of the zero-velocity curve (e.g., NGC 2768, NGC 3414).
We note that always exceeds the expected value from thermal broadening () and is generally smaller than the stellar velocity dispersion . In some cases, however, , either only in the central regions (e.g., NGC 2974, NGC 3414, NGC 5813) or over most of the field (e.g., NGC 3156). This suggests the presence of additional turbulence in the gas clouds or that the latter do not follow perfectly circular orbits. A stronger dynamical support for the gas motions (Bertola et al., 1995) may be required to explain cases where .
3.4 [O iii]/H ratios
The maps for the relative strength of the [O iii] and H lines in Figure 4a can be used to identify regions where emission could be powered by young stars and to trace variations of the ionisation mechanism within single galaxies. Low [O iii]/H ratios tend to characterise star forming H ii-regions, whereas other mechanisms are in general responsible for emission with high [O iii]/H ratios. Only 20% of the emission-line nuclei with [O iii]/H are classified as H ii nuclei, while this class of objects represent 85% of the nuclei with [O iii]/H (Ho et al., 1997c). On the other hand, [O iii] lines stronger than H can arise also in H ii-regions if the metallicity of the gas is sufficiently low (e.g., Veilleux & Osterbrock, 1987). The metallicity of the interstellar medium can vary between different objects (e.g., if the gas has an external origin) but it is unlikely to change abruptly across different regions of a galaxy. Large fluctuations of the [O iii]/H ratio within a galaxy suggest a variation of the ionising mechanism rather than a change in the gas metallicity alone.
| NGC | Type | Environment | Emission | [N i] | Dust | ||||||
|---|---|---|---|---|---|---|---|---|---|---|---|
| x2 (1) | (2) | (3) | (4) | (5) | (6) | (7) | (8) | (9) | (10) | (11) | (12) |
| 474 | S00(s) | Field | 32.50 | -20.42 | 0.19 | yes | no | no | -14.09 | 39.44 | 4.821 |
| 524 | S0+(rs) | Field | 32.58 | -21.40 | 0.01 | yes | no | yes | -14.57 | 39.00 | 4.373 |
| 821 | E6? | Field | 31.86 | -20.44 | 0.32 | no | no | no | – | – | – |
| 1023 | SB0-(rs) | Field | 30.06 | -20.42 | 0.56 | yes | no | no | -14.10 | 38.46 | 3.835 |
| 2549 | S00(r)sp | Field | 31.12 | -19.36 | 0.68 | yes | no | no | -14.18 | 38.80 | 4.179 |
| 2685 | (R)SB0+pec | Field | 30.79 | -19.05 | 0.51 | yes | yes | yes | -13.48 | 39.37 | 4.747 |
| 2695 | SAB00(s) | Field | 31.83 | -19.38 | 0.27 | no | no | – | – | – | – |
| 2699 | E: | Field | 31.83 | -18.85 | 0.06 | yes | no | yes | -15.25 | 38.02 | 3.393 |
| 2768 | E6: | Field | 31.66 | -21.15 | 0.42 | yes | yes | yes | -13.55 | 39.65 | 5.025 |
| 2974 | E4 | Field | 31.93 | -20.32 | 0.39 | yes | yes | yes | -13.35 | 39.96 | 5.333 |
| 3032 | SAB00(r) | Field | 31.68 | -18.77 | 0.11 | yes | yes | yes | -13.79 | 39.42 | 4.793 |
| 3156 | S0: | Field | 30.90 | -18.08 | 0.38 | yes | no | yes | -13.71 | 39.18 | 4.561 |
| 3377 | E5-6 | Leo I group | 30.14 | -19.24 | 0.39 | yes | no | yes | -13.63 | 38.96 | 4.337 |
| 3379 | E1 | Leo I group | 30.14 | -20.16 | 0.08 | yes | no | yes | -14.41 | 38.18 | 3.557 |
| 3384 | SB0-(s): | Leo I group | 30.14 | -19.56 | 0.49 | yes | no | yes | -14.67 | 37.92 | 3.297 |
| 3414 | S0 pec | Field | 31.52 | -19.78 | 0.17 | yes | yes | yes | -13.42 | 39.72 | 5.099 |
| 3489 | SAB0+(rs) | Leo I group | 30.14 | -19.32 | 0.38 | yes | no | yes | -12.95 | 39.64 | 5.017 |
| 3608 | E2 | Field | 30.96 | -19.54 | 0.21 | yes | no | no | -14.77 | 38.15 | 3.525 |
| 4150 | S00(r)? | Coma I cloud | 30.68 | -18.48 | 0.30 | yes | no | yes | -13.90 | 38.91 | 4.283 |
| 4262 | SB0-(s) | Virgo cluster | 31.06 | -18.88 | 0.09 | yes | no | – | -13.55 | 39.41 | 4.785 |
| 4270 | S0 | Virgo cluster | 31.06 | -18.28 | 0.53 | traces | no | no | – | – | – |
| 4278 | E1-2 | Coma I cloud | 30.68 | -19.93 | 0.06 | yes | yes | yes | -12.86 | 39.95 | 5.323 |
| 4374 | E1 | Virgo cluster | 31.06 | -21.23 | 0.12 | yes | yes | yes | -13.66 | 39.30 | 4.675 |
| 4382 | S0+(s)pec | Virgo cluster | 31.06 | -21.28 | 0.22 | weak [OIII] | no | no | – | – | – |
| 4387 | E | Virgo cluster | 31.06 | -18.34 | 0.34 | no | no | no | – | – | – |
| 4458 | E0-1 | Virgo cluster | 31.06 | -18.42 | 0.06 | traces | no | no | – | – | – |
| 4459 | S0+(r) | Virgo cluster | 31.06 | -19.99 | 0.23 | yes | no | yes | -14.07 | 38.89 | 4.265 |
| 4473 | E5 | Virgo cluster | 31.06 | -20.26 | 0.38 | traces | no | no | – | – | – |
| 4477 | SB0(s):? | Virgo cluster | 31.06 | -19.96 | 0.09 | yes | no | yes | -13.54 | 39.42 | 4.795 |
| 4486 | E0-1+pec | Virgo cluster | 31.06 | -21.79 | 0.30 | yes | yes | yes | -13.26 | 39.70 | 5.075 |
| 4526 | SAB00(s) | Virgo cluster | 31.06 | -20.68 | 0.63 | yes | yes | yes | -13.74 | 39.22 | 4.595 |
| 4546 | SB0-(s): | Virgo cluster | 31.06 | -19.98 | 0.50 | yes | yes | yes | -13.22 | 39.74 | 5.115 |
| 4550 | SB00:sp | Virgo cluster | 31.06 | -18.83 | 0.71 | yes | no | yes | -13.67 | 39.29 | 4.665 |
| 4552 | E0-1 | Virgo cluster | 31.06 | -20.58 | 0.09 | yes | no | yes | -14.27 | 38.69 | 4.065 |
| 4564 | E | Virgo cluster | 31.06 | -19.39 | 0.45 | no | no | no | – | – | – |
| 4570 | S0 sp | Virgo cluster | 31.06 | -19.54 | 0.68 | yes | no | no | -16.02 | 36.94 | 2.315 |
| 4621 | E5 | Virgo cluster | 31.06 | -20.64 | 0.24 | traces | no | no | – | – | – |
| 4660 | E | Virgo cluster | 31.06 | -19.22 | 0.21 | traces | no | no | – | – | – |
| 5198 | E1-2: | Field | 32.80 | -20.38 | 0.14 | yes | no | no | -14.52 | 39.13 | 4.511 |
| 5308 | S0- sp | Field | 32.26 | -20.27 | 0.82 | no | no | no | – | – | – |
| 5813 | E1-2 | Field | 32.10 | -20.99 | 0.24 | yes | yes | yes | -14.01 | 39.36 | 4.741 |
| 5831 | E3 | Field | 31.79 | -19.73 | 0.13 | yes | no | no | -15.06 | 38.19 | 3.567 |
| 5838 | S0- | Field | 31.36 | -19.87 | 0.59 | yes | yes | yes | -14.29 | 38.79 | 4.165 |
| 5845 | E: | Field | 31.69 | -18.58 | 0.32 | weak [OIII] | no | yes | – | – | – |
| 5846 | E0-1 | Field | 31.98 | -21.24 | 0.06 | yes | yes | yes | -13.85 | 39.48 | 4.853 |
| 5982 | E3 | Field | 33.11 | -21.46 | 0.30 | yes | no | no | -14.79 | 38.99 | 4.365 |
| 7332 | S0 pec sp | Field | 31.42 | -19.93 | 0.73 | yes | no | yes | -13.43 | 39.67 | 5.049 |
| 7457 | S0-(rs)? | Field | 30.46 | -18.81 | 0.41 | yes | no | no | -14.49 | 38.23 | 3.605 |
Notes: (1) NGC number. (2) Hubble type (RC3: de Vaucouleurs et al. 1991). (3)–(5) Galactic Environment, distance modulus in mag, and absolute -band magnitude, from Paper II. (6) Ellipticity of the 25 -band mag arcsec-2 isophote (LEDA). (7) Presence of H or [O iii]4959,5007 emission. (8) Presence of [N i]5198,5200 lines. (9) Presence of dust features in the HST images. (10) – (12) Estimated (see text) total H flux, H luminosity and mass of the ionised gas in , , and , respectively, for objects with clearly detected emission.
The great variety of [O iii]/H values found both across our sample and within single objects (Figure 4a) therefore suggests either that different ionising sources could be at work in early-type galaxies or that the metallicity of the interstellar medium is very heterogeneous from galaxy to galaxy. The radial profiles of Fig4b show that more than half of the objects have average [O iii]/H values between 1 and 3. Many galaxies (e.g., NGC 3377, NGC 3489) display emission with [O iii]/H , but such a strong level of excitation (typical of Seyfert nuclei) never dominates the entire field (except for NGC 7332). On the other hand, [O iii]/H ratios characterise most of the emission observed in NGC 524, NGC 3032, NGC 4459 and NGC 4526. The radial profiles for the [O iii]/H ratios also emphasise the presence of central gradients. Towards the centre, with few exceptions, [O iii]/H always ranges between 1 and 3.
The ionisation structure we observe links to the gas distribution and kinematics in two classes of objects in particular. The first group includes the four galaxies with the lowest [O iii]/H ratio in our sample: NGC 524, NGC 3032, NGC 4459 and NGC 4526. These objects have clear disk-like gas distribution and kinematics, although in NGC 3032 severe binning makes it hard to judge the regularity of the velocity field. NGC 3032, NGC 4459, and NGC 4526 also share the same radial trend for the [O iii]/H ratio, with a minimum in a circumnuclear region and stronger [O iii]/H ratios toward the centre and the edge of the gas disk. Emission in NGC 524 is too weak to confirm this behaviour. The second class is composed of NGC 4262, NGC 4278, and NGC 4546, which show [O iii]/H-maps that are not symmetric around their centre despite the corresponding [O iii] and H distributions being fairly similar. These objects also display an integral-sign feature in their gas distribution. By contrast, NGC 3377, another object with this signature, has a fairly symmetric [O iii]/H distribution.
We note that many of the brightest elliptical galaxies in our sample show rather uniform [O iii]/H-maps for relatively intermediate values of [O iii]/H1-2.
3.5 H and [O iii] kinematics
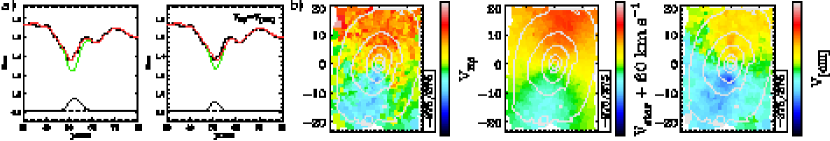
As clouds ionised by different sources need not share the same kinematics, here we seek evidence for systematic differences between the kinematics of clouds that emit more efficiently H photons than [O iii]. We measured the H and [O iii] kinematics independently in the galaxies with the strongest emission, and checked if the H measurements were subject to the systematics described in §2.1 by comparing the H velocity field with the stellar one (see Figure 2). The [N i] lines were still fitted using the [O iii] kinematics. Independent H and [O iii] kinematics could be measured over most of the region where emission is observed only in 10 galaxies. The most significant result from this experiment, shown in full in Appendix C, is that in objects with very regular gas distribution and kinematics, such as NGC 4459 and NGC 4526, the H velocities are higher than the [O iii] velocities, by up to 100 (Figure 5). This suggests that H is a better tracer than [O iii] for the circular velocity in the equatorial plane.
In other cases the differences between the velocities are more limited () and show less clear patterns, except for the central regions of NGC 3414 and NGC 4278 where a faster [O iii] component is observed. In general the width of the H lines tend to be smaller than that of the [O iii] lines, in particular towards the centre.
We note that even when the difference between the H and [O iii] kinematics is extreme (100 ), the flux of the H lines fitted independently and of those measured with the [O iii] kinematics differ by less than 20%. In terms of equivalent width the constrained fit can lead, in the most extreme cases, to an overestimation of H by up to 0.2Å.
4 Dust and Gas
Dust in early-type galaxies is almost always associated with gas emission (e.g., Tomita et al., 2000; Tran et al., 2001). With SAURON we can correlate the presence and spatial morphology of the dust not only with the ionised-gas distribution but also with its two-dimensional kinematics.
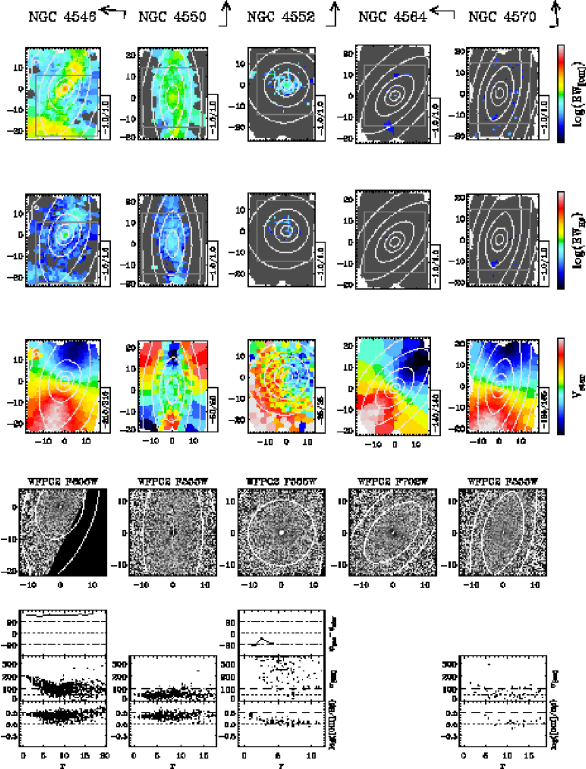
To highlight the presence of dust we constructed unsharp-masked maps using both the SAURON reconstructed intensity maps and archival HST images, the latter being available for 45/48 objects. This was done by dividing each image by a smoothed version of itself, using a Gaussian kernel with a FWHM of 03 and 08 for the HST and SAURON images, respectively. Figure 4b shows for each galaxy the HST or SAURON unsharp-masked image. The unsharp-masked images reveal different dust morphologies, such as perfect disks (NGC 524, NGC 3032, NGC 3379, NGC 4459, NGC 4526, NGC 5838), less defined coplanar distributions, (e.g., NGC 2974, NGC 3489, NGC 4550), well defined lanes (e.g., NGC 2685, NGC 3377, NGC 4374) or more complex filamentary (e.g, NGC 4486, NGC 5813, NGC 5846) and patchy (e.g., NGC 4552) structures. Whenever dust is present we also find emission, although very weak in NGC 5845. The converse does not always hold, which is expected as dust is harder to detect in close to face-on configurations. Still, it is puzzling to see that in some cases (e.g., NGC 5198, NGC 5982) dust is not detected despite the observed high gas velocities, which are hard to reconcile with motions in a face-on disk.
Consistent with previous studies (e.g., Goudfrooij et al., 1994), the dust generally follows the ionised-gas distribution, even if it is not always possible to connect features in the flux and -maps with ones in the unsharp-masked images. In some objects, however, specific H-emitting regions have dusty counterparts. Perfect examples are the circumnuclear H-dominated regions of NGC 4459 and NGC 4526 that correspond to the strongest absorption features in the unsharp-masked images.
Regular dust distributions trace well regular velocity fields, consistent with Ho et al. (2002). All galaxies with perfect dusty disks have indeed very regular gas kinematics, with NGC 3032 the only possible exception. On the other hand, the absence of regular dust lanes does not imply irregular kinematics, as very coherent gas motions correspond also to less defined dust morphologies (e.g., NGC 2974, NGC 4278), and even to quite complex ones (e.g., NGC 4150, NGC 5846).
The unsharp-masked maps also highlight the presence of separate stellar components, such as nuclear disks (e.g., NGC 821, NGC 5308), peanut-shaped bulges (NGC 2549), and bilobate structures reminiscent of a bar (NGC 2699, NGC 4262). Interestingly, nuclear disks are a common feature in galaxies with no or only weak emission.
5 Kinematic Misalignment Between Gas and Stars
The distribution and kinematics of the ionised gas in early-type galaxies have long been known to be often decoupled from that of the stars (see Bertola & Corsini, 1999, for a review). Figure 4b includes the stellar velocity fields from Paper III to facilitate the comparison between the [O iii] and stellar kinematics, and shows that our sample galaxies are not an exception in this respect. The velocity maps show that the motion of gas is often decoupled from that of the stars, and that the angular momenta of the gas and stars have the same orientation in only a few cases.
A number of studies have used the distribution of the misalignment between the spatial distributions (e.g., Martel et al., 2004) and angular momenta (e.g., Kannappan & Fabricant, 2001) of gas and stars to constrain the origin of the ionised gas in early-type galaxies. The orientation of the dust relative to that of the stars has also served this purpose (e.g., van Dokkum & Franx, 1995; Tran et al., 2001). With 48 representative E and S0 galaxies in both cluster and field environments, the SAURON sample constitutes a good basis to test simple hypotheses on the origin of the gas.
We used the velocity maps of Figure 4a- 4b to accurately measure the direction of the stellar and gaseous rotation, and compared the distribution for the kinematic misalignments between gas and stars with what is expected if the gas has either an internal or external origin. We trace the direction of maximum rotation as a function of radius, using the harmonic-expansion method for analysing two-dimensional kinematics maps of Krajnović (2004). We divided the velocity field in concentric circular annuli and fitted the first four terms of a Fourier series to the velocity angular profiles in each of the annuli. The angular phase of the first order term corresponds to the direction of maximum rotation, or . The width of the annuli increases geometrically to follow the increase in the SAURON bin size. The fit automatically stops toward the edge of the field or of the gas distribution (see Krajnović, 2004). In the lower panels of Figure 4b we plot the difference between and as a function of radius. The gas-star kinematic misalignment is always shown between 180°, and is derived only in objects with clear gas detection and where stellar rotation is observed. We further excluded galaxies without sufficiently extended emission (NGC 2699 and NGC 5831). In NGC 4570 and the external regions of NGC 7457 the emission is too fragmented for the harmonic fit to converge. The complex stellar kinematics in NGC 4550 are also hard to describe with this method.
| NGC | |||
|---|---|---|---|
| (1) | (2) | (3) | (4) |
| 474 | 74 | 16 | 3.5 |
| 524 | 1 | 22 | 20 |
| 1023 | -31 | 10 | 18 |
| 2549 | 11 | 15 | 3.5 |
| 2685 | 73 | 14 | 20 |
| 2768 | -95 | 7 | 20 |
| 2974 | 2 | 7 | 20 |
| 3032 | -151 | 22 | 11 |
| 3156 | -11 | 9 | 15 |
| 3377 | 11 | 6 | 15 |
| 3379 | 43 | 11 | 3 |
| 3384 | 13 | 11 | 5 |
| 3414 | 75 | 32 | 9 |
| 3489 | -6 | 6 | 18 |
| 3608 | 148 | 19 | 5 |
| 4150 | 21 | 12 | 2-15 |
| 4262 | -119 | 6 | 15 |
| 4278 | 29 | 19 | 22 |
| 4374 | -179 | 44 | 6 |
| 4459 | -1 | 2 | 9 |
| 4477 | -28 | 5 | 15 |
| 4526 | 6 | 5 | 10 |
| 4546 | 144 | 5 | 17 |
| 4550 | 0 | – | – |
| 4552 | -78 | 22 | 5 |
| 4570 | 0 | – | – |
| 5198 | 75 | 16 | 3 |
| 5813 | 28 | 33 | 9 |
| 5838 | 11 | 11 | 5 |
| 5846 | -156 | 30 | 10 |
| 5982 | 13 | 17 | 3 |
| 7332 | 132 | 68 | 15 |
| 7457 | -95 | 29 | 4 |
Notes: (1) NGC number. (2) Median kinematic misalignment in degrees. (3) Standard deviation for the kinematic misalignment in degrees. (4) Maximum distance from the center used to derived the values in Columns (2) and (3). For NGC 4150 we excluded also the central 2″.
From the misalignment profiles of Figure 4b we derived for each object a median value and the standard deviation, which are tabulated in Table 2. We considered NGC 4550 and NGC 4570 as perfectly co-rotating systems (see AppendixB), and used only the central gaseous systems of NGC 474 and NGC 2549, as they are more likely to be settled. For the same reason we excluded the filamentary structures extending from the central disks in NGC 5198 and NGC 5982. In NGC 3414 we considered only the central regions because of a strong decoupling in the stellar velocity field. Table 2 lists the adopted radial ranges. The values for the standard deviation of the kinematic misalignment always account for the observed twists in the gas and stellar velocity maps since the harmonic-expansion generally measures and to within a few degrees.
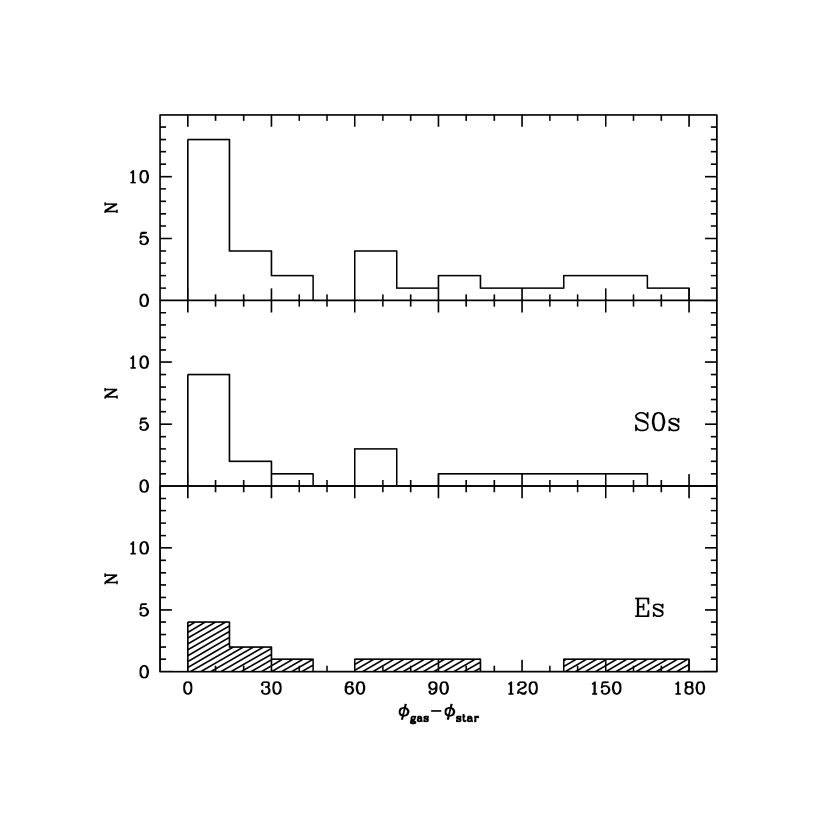
Figure 6 presents the distribution of the average values for the kinematic misalignment between gas and stars in our sample, now shown between 0° and 180°. Its principal feature is a pronounced excess of objects with gas in prograde orbits with respect to objects with gas in retrograde orbits. Figure 6 shows also that elliptical and lenticular galaxies have very similar distributions. Despite the modest number of objects, a KS-test shows that the two distributions are identical at a 1-level (). The distributions of field and cluster galaxies are also not significantly different (). The distribution of kinematic misalignments is also independent of the galaxy luminosity.
To interpret Figure 6, let us assume that the intrinsic shape of our sample galaxies is mildly triaxial (Franx et al., 1991). In this situation, stable closed orbits for the gas are allowed only in two planes: the plane containing the short and intermediate axis and the plane containing the long and intermediate axis. When gas is acquired from random directions, it will settle more often in the long-intermediate plane and the chances of settling in the short-intermediate plane will scale with the degree of triaxiality (Steiman-Cameron & Durisen, 1982).
If the origin of the gas is external, and assuming that prograde and retrograde gas settle in the same way, the distribution of the gas-star kinematic misalignments will therefore display three peaks: two of equal intensity corresponding to counter- and co-rotating gas and stars, and a weaker peak for gas in orthogonal rotation, assuming the stars rotate along the short axis. In a triaxial galaxy, however, the stellar rotation axis can lie anywhere in the plane containing the short and long axes. Since gas in equilibrium can rotate only around these two axes, intermediate values for the kinematic misalignment will also be observed. Projection effects will further dilute the distribution of the observed kinematic misalignments, but overall the resulting distribution will be symmetric around 90°, with an equal number of counter- and co-rotating gas and stellar systems.
If the origin of the gas is internal (e.g., from stellar-mass loss) the gas will rotate in the same sense as the stars, and therefore the distribution for the kinematic misalignments will be asymmetric, with values mostly between 0° and 90°.
The observed distribution in Figure 6 is inconsistent with the prediction of either of these simple scenarios. Half of the objects show a kinematic decoupling that implies an external origin for the gas, but the number of objects consistent with co-rotating gas and stars exceeds by far the number of cases with counter-rotating systems, suggesting that internal production of gas has to be important.
We note that our objects form a representative, but incomplete, sample of the local early-type galaxies population. The degree of incompleteness is known as our targets were drawn from a complete sample (Paper II). Since galaxies with prograde and retrograde gaseous systems form subsamples that are similarly representative of the local galaxy population, incompleteness does not have a significant impact on the previous discussion. Incompleteness is not responsible for the observed asymmetry in Figure 6.

5.1 The dependency on galaxy flattening and rotational support
The distribution of the average values for the kinematic misalignment between stars and gas does not depend on Hubble type, galactic environment, or galaxy luminosity. It does, however, strongly depend on the apparent large-scale flattening of galaxies. Figure 7 shows that the roundest objects in our sample () present a more symmetric distribution of kinematic misalignments than flatter galaxies, which instead host predominantly co-rotating stellar and gaseous systems. The two distributions are different at a 99% confidence level and there is a 53% probability that the distribution of rounder object was drawn from a uniform distribution. The galaxies in the two subsamples have no significantly different luminosities or Hubble types and do not live in different environments. The two samples are also equally incomplete. The flat objects showing co-rotating gas and stars are also not significantly different than the rest of the galaxies in this subsample.
Since for random orientations fairly round galaxies are likely to be almost spherical and hence supported by dynamical pressure, rather than by rotation, the degree of rotational support could also be important to explain the observed dependency on the galaxy flattening. A first distinction between slowly-rotating, rounder galaxies and fast-rotating flatter objects, can be made using the classical diagram recently revised by Binney (2005). This diagram alone, however, would fail to separate galaxies that are characterised by overall rotation from non-rotating objects with a fast rotating core, because the derivation of includes only a luminosity weighting. In Emsellem et al. (in preparation) we assess the level of rotation support in a more quantitative way, adopting a quantity that is closely related to the specific angular momentum of a galaxy, thus overcoming the limitations of the diagram. Figure 8 shows the distribution of kinematic misalignments between gas and stars in fast and slowly rotating galaxies according to the criterion of Emsellem et al. (see also McDermid et al., 2005, for an illustration of this two kind of objects). Consistent with our expectations, the two distributions are remarkably different (at a level, ), as in the case of flat and round objects (Figure. 7). In the context of our simple first-order assumptions these results suggest that external accretion of gaseous material is less important than internal production of gas in flat and fast rotating galaxies. On the other hand, the more uniform distribution of kinematic misalignments in rounder and slowly rotating objects suggests that these objects aquire their gas more often. However, it must be bear in mind that the interpretation of the misalignment distribution of rounder galaxies can be complicated by projection effects, because such objects often host kinematically decoupled core, and by the fact that gas is subject to only weak gravitational torques in almost spherical objects.

6 Discussion and Conclusions
We have measured the ionised-gas fluxes and kinematics in 48 elliptical and lenticular galaxies both in cluster and field environments, using a novel technique to measure emission lines in galactic spectra where the stellar and ionised-gas contributions to the spectrum are simultaneously described. Extensive simulations were performed to test this procedure and assess the detection limits in measuring gas emission.
The excellent quality of the SAURON data and the ability of our new method to exploit the entire spectral range allowed us to detect emission lines down to an equivalent width of 0.1Å, which is set by the current limitations in describing the spectra of early-type galaxies with synthetic and real stellar templates. Due to these limitations neither the H nor the [N ii] lines could be always measured without imposing on them the kinematics of the [O iii] doublet. In the case of H, independent fits lead to biased gas kinematics that are easily recognised across the field of a galaxy. This allowed us to identify a few galaxies where the H and [O iii] kinematics could be independently derived and compared.
Across our sample, and are on average accurate to within 14 and 20 , respectively. Errors on the flux of the [O iii] and H lines are on average 10% and 20%, respectively. Although the H and [O iii] kinematics can be different, imposing the [O iii] kinematics on the H lines does not dramatically affect our ability to measure the H fluxes. This is observed both in the simulations and in the objects where independently derived H and [O iii] kinematics could be compared. On the other hand, relying on the detection of [O iii] emission before measuring H does limit our ability to detect weak emission from H ii-regions, where the [O iii] lines are dimmer than H.
Emission is clearly detected in 36/48 of our sample galaxies (75%) and only 5 objects do not show any significant emission. The remaining 7 galaxies exhibit weak [O iii] lines only or fragmented traces of emission. Among clear detections, a mild dependence on the Hubble type and galactic environment is observed, with higher detection rates in lenticular galaxies and field objects. Emission is found in 20/24 lenticular galaxies in our sample (83%) and in 16/24 (66%) of the ellipticals. This is remarkably close to the detections rates of the imaging survey of Macchetto et al. (1996), who found H+[N ii] emission in 85% of S0 and 68% of E. The dependence on the galactic environment is similarly marginal, although when only the Virgo cluster is considered the fraction of galaxies with clearly detected emission drops to 55% (10/18), with just 3/9 ellipticals exhibiting emission lines. These 3 objects are also the brightest that we observed in this cluster. Lauer et al. (2005) also find a significantly lower incidence (33%) of galactic dust in Virgo than in the rest of the local elliptical galaxy population (47%). They also found dust only in the brightest objects of this cluster.
The observed emission comes with a variety of resolved distributions, kinematic behaviours, and [O iii]/H line ratios. It is very often, although not always, associated with dust. Two interesting classes of objects can be recognised.
The first group show settled gaseous systems where star-formation is almost certainly occurring, particularly in circumnuclear regions. The defining properties of this class, which includes the S0 galaxies NGC 524, NGC 3032, NGC 4459, NGC 4526 and NGC 5838, are a regular disk-like gas distribution and kinematics, very regular and circularly symmetric dust lanes, and the lowest [O iii]/H ratios in our sample. The kinematic signature of emission from H ii-regions in circular motion on the equatorial plane is observed in the independently derived kinematics of the H lines, which show faster rotation and smaller velocity dispersions than the [O iii] kinematics. The detection in three galaxies of CO emission from dense molecular clouds (in NGC 3032, NGC 4459 and NGC 4526 by Sage & Wrobel, 1989) further suggests star-formation activity. On the other hand, it is likely that gas clouds departing from simple rotation end up getting shocked, increasing the gas ionisation and the [O iii] emission.
The second group of galaxies, which includes NGC 474, NGC 3377, NGC 4262, NGC 4278, and NGC 4546, is characterised by an integral-sign pattern in the ionised-gas distribution and by noticeable twists in the gas velocity maps. In addition, NGC 4262, NGC 4278, and NGC 4546 display peculiar asymmetries in their and [O iii]/H maps. Since all these objects show misaligned stellar photometric and kinematic axes (although only mildly for NGC 3377, see Paper I), the observed twisting in the ionised gas distribution and kinematics is more likely tracing regions where gas accumulates while flowing in a non-axisymmetric potential rather than a warped configuration.
The presence of a triaxial structure also appears to be underscored by finding in the outer parts of a galaxy gas emission that is misaligned with respect to the main stellar body and that is kinematically decoupled from the gas kinematics in the central region, as in NGC 1023, NGC 2549, NGC 7332 and NGC 7457. NGC 1023 is indeed a well-known barred galaxy (e.g., Debattista et al., 2002), NGC 2549 shows a peanut-shape structure in the HST images, and the presence of a bar in NGC 7332 was extensively discussed by Falcón-Barroso et al. (2004). Taken together with NGC 2974, where the gas distribution observed with both SAURON and HST is consistent with the presence of nested bars (Krajnović et al. 2005; Emsellem et al. 2003), these patterns show how dramatically the gas can respond to the presence of even a modest non-axisymmetric perturbation of the gravitational potential.
Weak bars or unsettled configurations can contribute to explain why the ionised-gas kinematics is rarely consistent with simple coplanar circular motions. Yet, despite complex structures are often observed in the velocity maps, the gas almost never displays irregular kinematics and instead generally shows coherent motions with smooth variations in angular momentum. In the majority of the cases the gas kinematics is decoupled from the stellar kinematics.
We have measured the kinematic misalignment between stars and gas and derived a distribution of mean kinematic misalignment values to draw on the origin of the gas. Although half of the objects show a kinematic decoupling that implies an external origin for the gas, the distribution of the misalignment values between stellar and gaseous angular momenta is inconsistent with a purely external origin. In particular, the number of objects with co-rotating gas and stars exceeds by far the number of cases with counter-rotating systems, suggesting that internal production of gas has to be important. The distribution of the kinematic misalignment between stars and gas does not depend on the Hubble type, galactic environment, or luminosity of our sample galaxies. It does, however, strongly depend on the apparent flattening of galaxies, and their level of rotational support.
These results demonstrate that the origin of the gas in early-type galaxies is not yet a “solved problem” – more clues are needed. Measuring the metallicity of the interstellar medium can provide the needed insight. Indeed if the gas originated in stellar-mass loss its metallicity should be related to that of the surrounding stars, in contrast to what is expected if the gas has an external origin. Yet, to measure the chemical composition of the gas it is first necessary to understand the ionisation of the gas, i.e. what causes some atomic species to emit more efficiently than others.
In this respect, the SAURON [O iii]/H maps reveal a wide range a values across the sample and considerable structures within single galaxies. Despite the limitation of the [O iii]/H ratio as an emission line-diagnostic, this finding suggests either that a variety of mechanisms is responsible for the gas excitation in E and S0 galaxies or that the metallicity of the interstellar material is quite heterogeneous from galaxy to galaxy. The [O iii]/H maps always show central gradients, where the line ratios tend to values always between 1-3. Since at these [O iii]/H regimes LINERs and Transition objects are the most common class of emission-line nuclei, our measurements may be consistent with the finding that the majority of E and S0 emission-line nuclei belong to these two spectroscopic classes (Ho et al., 1997c). In the outer parts of our sample galaxies, except for the objects where star-formation is occurring, the [O iii]/H is also typically between 1-3, although with large scatter. This could also be consistent with a LINER-like classification for the extended emission of early-type galaxies, which has been observed in many cases (e.g., Phillips et al., 1986; Zeilinger et al., 1996; Goudfrooij, 1999). More emission-line diagnostics such as the [N ii]/H ratio are needed to confirm the spectral classification of the observed emission.
Excluding a central AGN as the ionising mechanism for the emission observed at kilo-parsec scales, shocks, thermal conduction, and both young and post-AGB stars are all potential sources of ionisation. Shocks are known to occur while gas flows in barred potential (e.g., Roberts et al., 1979), therefore their rôle has to be important in galaxies where the presence of non-axisymmetric perturbation of the potential is underscored by characteristic patterns in the gas distribution and kinematics as those discussed before. Conductive heating of the warm gas by hot electrons from the X-ray emitting gas is a readily available source of energy in most early-type galaxies, sufficient to power the observed nebular emission (e.g., Macchetto et al., 1996). High spatial resolution X-ray data have also shown a striking coincidence between the spatial distribution of the X-ray and ionised-gas emission (e.g., Trinchieri & Goudfrooij, 2002; Sparks et al., 2004), supporting a casual link between them. Post-AGB stars could represent the most common source of ionisation. They can provide enough ionising photons to power the observe emission (Macchetto et al., 1996) and lead to LINER-like line ratios (Binette et al., 1994; Goudfrooij, 1999). The most compelling piece of evidence supporting this scenario is the finding that the emission-line flux correlates very well with with host galaxy stellar luminosity within the emission-line region (Macchetto et al., 1996). This correlation suggests indeed that the source of ionising photons are distributed in the same way as the stellar population. The SAURON observations further support this view, since as noted in §3.2 the flux distribution of the lines closely follows that of the stellar continuum. This is shown by the smooth appearance of many EW-maps, in particular for the H line. Finally, the rôle of H ii-regions cannot be ruled out only on the basis of [O iii]/H ratios , and should be explored in more details in light of the recent claims based on GALEX data of Yi et al (2005), that a substantial fraction of nearby early-type galaxies recently underwent star-formation activity.
Complementing this survey with integral-field spectroscopic data in the H+[N ii] wavelength region will mark an important step to further understand what powers the nebular emission in early-type galaxies, with bearings on the origin of the gas in these systems.
Acknowledgements
MS is grateful to James Binney, Sadegh Khochfar, Johan Knapen, John Magorrian, and Joe Shields for the helpful discussions. The SAURON project is made possible through grants 614.13.003, 781.74.203, 614.000.301 and 614.031.015 from NWO and financial contributions from the Institut National des Sciences de l’Univers, the Université Claude Bernard Lyon I, the Universities of Durham, Leiden, and Oxford, the British Council, PPARC grant ‘Extragalactic Astronomy & Cosmology at Durham 1998–2002’, and the Netherlands Research School for Astronomy NOVA. RLD is grateful for the award of a PPARC Senior Fellowship (PPA/Y/S/1999/00854) and postdoctoral support through PPARC grant PPA/G/S/2000/00729. The PPARC Visitors grant (PPA/V/S/2002/00553) to Oxford also supported this work. MB acknowledges support from NASA through Hubble Fellowship grant HST-HF-01136.01 awarded by Space Telescope Science Institute, which is operated by the Association of Universities for Research in Astronomy, Inc., for NASA, under contract NAS 5-26555 during part of this work. MC acknowledges support from a VENI grant 639.041.203 awarded by the Netherlands Organization for Scientific Research. JFB acknowledges support from the Euro3D Research Training Network, funded by the EC under contract HPRN-CT-2002-00305. KF acknowledges support for proposal HST-GO-09782.01 provided by NASA through a grant from the Space Telescope Science Institute. This project made use of the HyperLeda and NED databases. Part of this work is based on data obtained from the ESO/ST-ECF Science Archive Facility. Finally, we wish to thank the referee, Dr. Thomas, for his suggestions.
References
- Afanasiev & Sil’chenko (2002) Afanasiev, V. L., & Sil’chenko, O. K. 2002, AJ, 124, 706
- Bacon et al. (2001) Bacon R. et al., 2001, MNRAS, 326, 23 (Paper I)
- Bertola et al. (1992) Bertola, F., Buson, L. M., & Zeilinger, W. W. 1992, ApJ, 401, L79
- Bertola et al. (1995) Bertola, F., Cinzano, P., Corsini, E. M., Rix, H., & Zeilinger, W. W. 1995, ApJ, 448, L13
- Bertola & Corsini (1999) Bertola, F., & Corsini, E. M. 1999, IAU Symp. 186: Galaxy Interactions at Low and High Redshift, 186, 149
- Binette et al. (1994) Binette, L., Magris, C. G., Stasinska, G., & Bruzual, A. G. 1994, A&A, 292, 13
- Binney (2005) Binney, J. 2005, MNRAS, 863
- Böker et al. (1999) Böker, T., et al. 1999, ApJS, 124, 95
- Burbidge & Burbidge (1959) Burbidge E. M. & Burbidge G. R., 1959, ApJ, 130, 20
- Buson et al. (1993) Buson, L. M., et al. 1993, A&A, 280, 409
- Cappellari et al. (1999) Cappellari, M., Renzini, A., Greggio, L., di Serego Alighieri, S., Buson, L. M., Burstein, D., & Bertola, F. 1999, ApJ, 519, 117
- Cappellari & Copin (2003) Cappellari M., Copin Y., 2003, MNRAS, 342, 345
- Cappellari & Emsellem (2004) Cappellari M., Emsellem E., 2004, PASP, 116, 138
- Carollo et al. (1997) Carollo, C. M., Franx, M., Illingworth, G. D., & Forbes, D. A. 1997, ApJ, 481, 710
- Caon et al. (2000) Caon, N., Macchetto, D., & Pastoriza, M. 2000, ApJS, 127, 39
- Ciardullo et al. (1989) Ciardullo, R., Jacoby, G. H., & Ford, H. C. 1989, ApJ, 344, 715
- Ciardullo et al. (1993) Ciardullo, R., Jacoby, G. H., & Dejonghe, H. B. 1993, ApJ, 414, 454
- Cinzano & van der Marel (1994) Cinzano, P., & van der Marel, R. P. 1994, MNRAS, 270, 325
- Debattista et al. (2002) Debattista, V. P., Corsini, E. M., & Aguerri, J. A. L. 2002, MNRAS, 332, 65
- de Jong et al. (1990) de Jong, T., Norgaard-Nielsen, H. U., Jorgensen, H. E., & Hansen, L. 1990, A&A, 232, 317
- de Robertis & Osterbrock (1986) de Robertis, M. M., & Osterbrock, D. E. 1986, ApJ, 301, 727
- de Vaucouleurs et al. (1991) de Vaucouleurs G., de Vaucouleurs A., Corwin H. G., Buta R. J., Paturel G., Fouque P., 1991, Volume 1-3, XII, Springer-Verlag Berlin Heidelberg New York,
- de Zeeuw et al. (2002) de Zeeuw P. T., et al., 2002, MNRAS, 329, 513 (Paper II)
- di Serego Alighieri et al. (1990) di Serego Alighieri, S., Trinchieri, G., & Brocato, E. 1990, ASSL Vol. 160: Windows on Galaxies, 301
- Dopita & Sutherland (1995) Dopita, M. A., & Sutherland, R. S. 1995, ApJ, 455, 468
- Dopita & Sutherland (1996) Dopita, M. A., & Sutherland, R. S. 1996, ApJS, 102, 161
- Emsellem et al. (2003) Emsellem, E., Goudfrooij, P., & Ferruit, P. 2003, MNRAS, 345, 1297
- Emsellem et al. (2004) Emsellem, E., et al. 2004, MNRAS, 352, 721 (Paper III)
- Eskridge et al. (1995a) Eskridge, P. B., Fabbiano, G., & Kim, D. 1995a, ApJ, 442, 523
- Eskridge et al. (1995b) Eskridge, P. B., Fabbiano, G., & Kim, D. 1995b, ApJS, 97, 141
- Fabbiano (2003) Fabbiano, G. 2003, Advances in Space Research, 32, 2013
- Faber & Gallagher (1976) Faber, S. M., & Gallagher, J. S. 1976, ApJ, 204, 365
- Falcón-Barroso et al. (2004) Falcón-Barroso, J., et al. 2004, MNRAS, 350, 35
- Ferrari et al. (1999) Ferrari, F., Pastoriza, M. G., Macchetto, F., & Caon, N. 1999, A&AS, 136, 269
- Finoguenov & Jones (2001) Finoguenov, A., & Jones, C. 2001, ApJ, 547, L107
- Filippenko & Halpern (1984) Filippenko, A. V., & Halpern, J. P. 1984, ApJ, 285, 458
- Franx et al. (1991) Franx, M., Illingworth, G., & de Zeeuw, P. T. 1991, ApJ, 383, 112
- Fried & Illingworth (1994) Fried, J. W., & Illingworth, G. D. 1994, AJ, 107, 992
- Galletta (1987) Galletta, G. 1987, ApJ, 318, 531
- Goudfrooij et al. (1994) Goudfrooij, P., Hansen, L., Jorgensen, H. E., & Norgaard-Nielsen, H. U. 1994, A&AS, 105, 341
- Goudfrooij (1999) Goudfrooij, P. 1999, ASP Conf. Ser. 163: Star Formation in Early Type Galaxies, 163, 55
- Greggio (1997) Greggio, L. 1997, MNRAS, 285, 151
- Ho et al. (1995) Ho, L. C., Filippenko, A. V., & Sargent, W. L. 1995, ApJS, 98, 477
- Ho et al. (1997a) Ho, L. C., Filippenko, A. V., & Sargent, W. L. W. 1997a, ApJS, 112, 315
- Ho et al. (1997b) Ho, L. C., Filippenko, A. V., Sargent, W. L. W., & Peng, C. Y. 1997b, ApJS, 112, 391
- Ho et al. (1997c) Ho, L. C., Filippenko, A. V., & Sargent, W. L. W. 1997c, ApJ, 487, 568
- Ho et al. (2002) Ho, L. C., Sarzi, M., Rix, H., Shields, J. C., Rudnick, G., Filippenko, A. V., & Barth, A. J. 2002, PASP, 114, 137
- Hoaglin et al. (1983) Hoaglin, D. C., Mosteller, F. & Tukey, J. W. 1983, Understanding Robust and Exploratory Data Analysis (New York: Wiley)
- Jones (1997) Jones L. A., 1997, Ph.D. thesis, Univ. North Carolina, Chapel Hill
- Kannappan & Fabricant (2001) Kannappan, S. J., & Fabricant, D. G. 2001, AJ, 121, 140
- Kim (1989) Kim, D. 1989, ApJ, 346, 653
- Krajnović (2004) Krajnović, D. 2004, Ph.D. Thesis, University of Leiden
- Krajnović & Jaffe (2004) Krajnović, D., & Jaffe, W. 2004, A&A, 428, 877
- Krajnović et al. (2005) Krajnović, D., Cappellari, M., Emsellem, E., McDermid, R. M., & de Zeeuw, P. T. 2005, MNRAS, 357, 1113
- Laing & Bridle (1987) Laing, R. A., & Bridle, A. H. 1987, MNRAS, 228, 557
- Lauer et al. (2005) Lauer, T. R., et al. 2005, AJ, 129, 2138
- Macchetto et al. (1996) Macchetto, F., Pastoriza, M., Caon, N., Sparks, W. B., Giavalisco, M., Bender, R., & Capaccioli, M. 1996, A&AS, 120, 463
- Maraston et al. (2003) Maraston, C., Greggio, L., Renzini, A., Ortolani, S., Saglia, R. P., Puzia, T. H., & Kissler-Patig, M. 2003, A&A, 400, 823
- Martel et al. (2004) Martel, A. R., et al. 2004, AJ, 128, 2758
- McDermid et al. (2005) McDermid, R. M., et al. 2005, New Astr. Rev., in press, astro-ph/0508631
- Morelli et al. (2004) Morelli, L., et al. 2004, MNRAS, 354, 753
- Osterbrock (1989) Osterbrock, D. E. 1989, Astrophysics of Gaseous Nebulae and Active Galactic Nuclei. Univ. Sc. Books, USA
- Phillips et al. (1986) Phillips, M. M., Jenkins, C. R., Dopita, M. A., Sadler, E. M., & Binette, L. 1986, AJ, 91, 1062
- Quillen et al. (2000) Quillen, A. C., Bower, G. A., Stritzinger, M. 2000, ApJS, 85, 128
- Raimond et al. (1981) Raimond, E., Faber, S. M., Gallagher, J. S., & Knapp, G. R. 1981, ApJ, 246, 708
- Ravindranath et al. (2001) Ravindranath, S., Ho, L. C., Peng, C. Y., Filippenko, A. V., & Sargent, W. L. W. 2001, AJ, 122, 653
- Rix et al. (1992) Rix, H., Franx, M., Fisher, D., & Illingworth, G. 1992, ApJ, 400, L5
- Roberts et al. (1979) Roberts, W. W., Huntley, J. M., & van Albada, G. D. 1979, ApJ, 233, 67
- Rubin et al. (1992) Rubin, V. C., Graham, J. A., & Kenney, J. D. P. 1992, ApJ, 394, L9
- Sadler & Gerhard (1985) Sadler, E. M., & Gerhard, O. E. 1985, MNRAS, 214, 177
- Sancisi et al. (1984) Sancisi, R., van Woerden, H., Davies, R. D., & Hart, L. 1984, MNRAS, 210, 497
- Sage & Wrobel (1989) Sage, L. J., & Wrobel, J. M. 1989, ApJ, 344, 204
- Shields (1992) Shields, J. C. 1992, ApJ, 399, L27
- Sil’chenko (2000) Sil’chenko, O. K. 2000, AJ, 120, 741
- Sil’chenko & Afanasiev (2004) Sil’chenko, O. K., & Afanasiev, V. L. 2004, AJ, 127, 2641
- Sparks et al. (1989) Sparks, W. B., Macchetto, F., & Golombek, D. 1989, ApJ, 345, 153
- Sparks et al. (1993) Sparks, W. B., Ford, H. C., & Kinney, A. L. 1993, ApJ, 413, 531
- Sparks et al. (2004) Sparks, W. B., Donahue, M., Jordán, A., Ferrarese, L., & Côté, P. 2004, ApJ, 607, 294
- Steiman-Cameron & Durisen (1982) Steiman-Cameron, T. Y., & Durisen, R. H. 1982, ApJ, 263, L51
- Storey & Zeippen (2000) Storey, P. J., & Zeippen, C. J. 2000, MNRAS, 312, 813
- Thomas et al. (2005) Thomas, D., Maraston, C., Bender, R., & de Oliveira, C. M. 2005, ApJ, 621, 673
- Tomita et al. (2000) Tomita, A., Aoki, K., Watanabe, M., Takata, T., & Ichikawa, S. 2000, AJ, 120, 123
- Trager et al. (2000) Trager, S. C., Faber, S. M., Worthey, G., & González, J. J. 2000, AJ, 120, 165
- Tran et al. (2001) Tran, H. D., Tsvetanov, Z., Ford, H. C., Davies, J., Jaffe, W., van den Bosch, F. C., & Rest, A. 2001, AJ, 121, 2928
- Trinchieri & Goudfrooij (2002) Trinchieri, G., & Goudfrooij, P. 2002, A&A, 386, 472
- Turnbull et al. (1999) Turnbull, A. J., Bridges, T. J., & Carter, D. 1999, MNRAS, 307, 967
- van den Bosch et al. (1994) van den Bosch, F. C., Ferrarese, L., Jaffe, W., Ford, H. C., & O’Connell, R. W. 1994, AJ, 108, 1579
- van den Bosch et al. (1998) van den Bosch, F. C., Jaffe, W., & van der Marel, R. P. 1998, MNRAS, 293, 343
- van Dokkum & Franx (1995) van Dokkum, P. G., & Franx, M. 1995, AJ, 110, 2027
- Vazdekis (1999) Vazdekis, A. 1999, ApJ, 513, 224
- Veilleux & Osterbrock (1987) Veilleux, S., & Osterbrock, D. E. 1987, ApJS, 63, 295
- Wagner, Bender & Moellenhoff (1988) Wagner S. J., Bender R., Moellenhoff C., 1988, A&A, 195, L5
- Wiklind & Henkel (2001) Wiklind, T., & Henkel, C. 2001, A&A, 375, 797
- Worthey et al. (1992) Worthey, G., Faber, S. M., & Gonzalez, J. J. 1992, ApJ, 398, 69
- Yi et al. (2005) Yi, S. K., et al. 2005, ApJ, 619, L111
- Young (2002) Young, L. M. 2002, AJ, 124, 788
- Zeilinger et al. (1996) Zeilinger, W. W., et al. 1996, A&AS, 120, 257
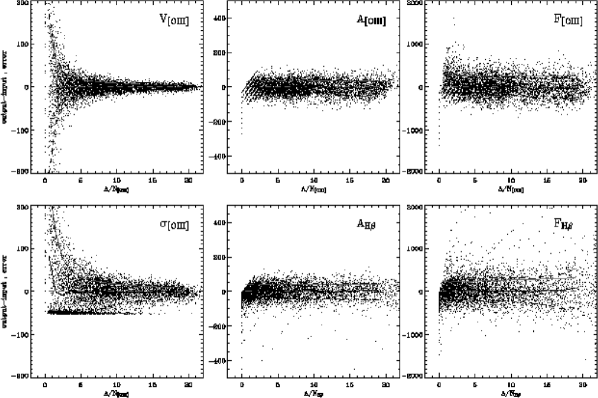
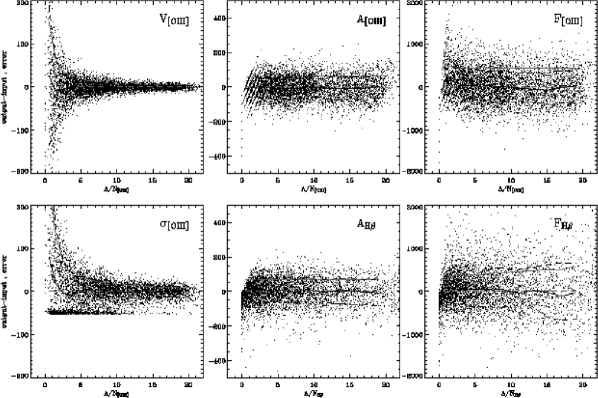
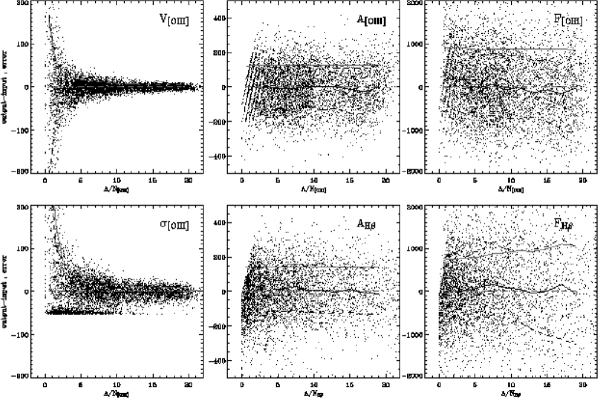
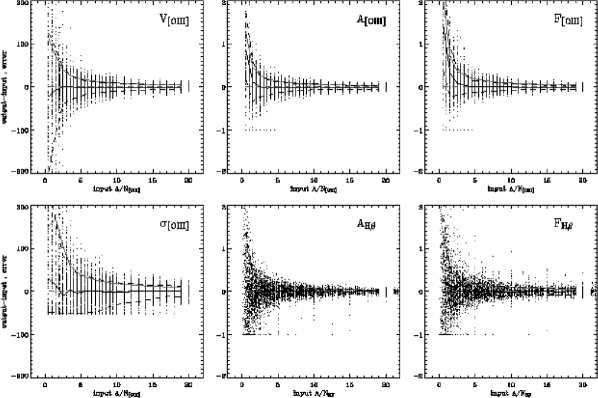
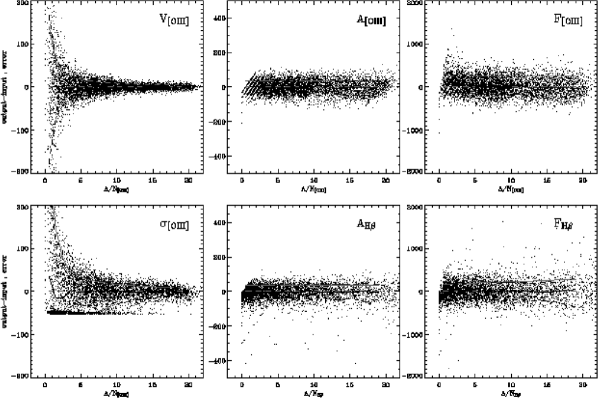
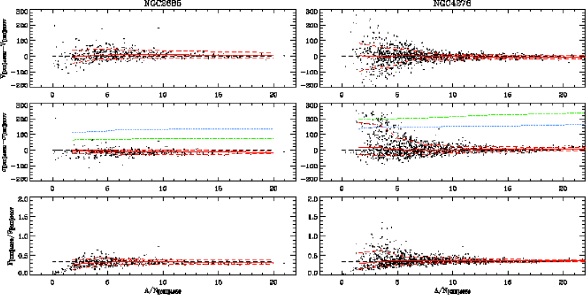
Appendix A Tests on the emission-line measurements
In this appendix, we attempt through a number of experiments to establish how accurately the position, width, amplitude, and flux of an emission line can be measured as a function of its relative strength with respect to both the statistical and systematic deviations from the fit to the stellar continuum.
A.1 The synthetic data
To simulate the typical situation in the SAURON spectra, we constructed a large number of synthetic spectra, adding to an old stellar population varying amounts of H and [O iii] emission and statistical noise. Specifically we used a 10-Gyr-old solar-metallicity template from the Vazdekis library, to which we added [O iii] emission lines with ranging from 0.5 to 20, and H emission ranging from 1/10 to 10 times the [O iii] emission. No [N i] emission was added. We included Poisson noise to simulate spectra with a in the stellar continuum of 200, 100, and 60, the latter value being typical of the spectra in the outer parts of our sample galaxies. The stellar spectra were all broadened by the same line-of-sight velocity distribution, in this case a simple Gaussian with centred at zero. The velocity of the [O iii] lines ranged from -250 to 250 , with a constant intrinsic width of . Since the stellar spectra are kept at their rest frame, the gas velocities are effectively relative to the stellar ones. We imposed the same kinematics on all emission lines.
Overall, we created 15390 synthetic spectra, which were analysed following exactly the same procedure as for the real data (§2.1). As the stellar kinematics can be measured very accurately at the considered and values, we always adopted the correct and values while matching the stellar continuum.
A.2 General Results
Figures A9a-A9c show how the measured position, width, amplitudes, and fluxes of the lines deviate from their input values as a function of the measured and for different values.
The recovery accuracy of the position and width of the lines is a strong function of the measured while the amplitudes do not seem to depend on it. The quality of the data, as quantified by the values, does not seem to affect the and measurements, while it is dominant in determining how well the amplitudes are estimated. The accuracy in measuring the amplitudes of the lines is indeed limited only by the level of statistical noise associated to the spectra.
The precision in estimating the emission-line fluxes turned out to be dominated by how well the amplitudes are measured, as it also scales mostly with instead of . A dependency on is introduced through the impact of the line-widths in the flux measurements, although only to a lower extent. For the [O iii] lines this is visible as a weak modulation in the flux recovery accuracy with , which indeed does not exactly parallel the small variations in the amplitude estimation. The effect on the H line is more obvious and is illustrated by a loss of accuracy in measuring the fluxes for stronger lines. This is due to synthetic spectra where the H line is much stronger than quite weak [O iii] lines, so that the measured width of the lines is subject to larger fluctuations. As the [O iii] kinematics is imposed on the H lines while fitting them, this can result in an error on the flux measurements that gets worse the stronger the H emission, which is exactly what is observed in the simulations. Fortunately, this situation rarely occurs in our sample galaxy, since when the [O iii] lines are weaker than H generally both lines are quite strong. We note that for weak H lines the accuracy with which the fluxes are recovered becomes again dominated by the error in estimating the line amplitudes.
Figures A9a-A9c also show how the formal uncertainties on the measured parameters closely parallel the standard deviations of the measured values from the input ones, demonstrating that our error estimates are reliable. Only in the case of the line fluxes, our formal error estimates systematically over and underestimate by % the observed fluctuations for the [O iii] and H lines, respectively.
A.3 Loss of reliability at low values
Figures A9a-A9c show that as the emission-lines get weaker our measurements become less reliable and also start to be dominated by systematic effects.
In the case of the line velocities, there is little evidence for a systematic bias, whereas below the line widths start to be overestimated. Two opposite biases are at work in this case. As the lines become weaker, their width can either be overestimated as their wings are increasingly lost in the noise level, or underestimated as it becomes more likely that the fit just converges on pixel-scale random fluctuations. In the latter case the returned intrinsic width will always be near zero, which explains the horizontal stripe of points in the bottom left panels of Figures A9a-A9c. This last behaviour is seldom observed in real data, as some correlation between pixels is introduced during the data reduction. As a result, the width of the lines tends to be overestimated at low regimes. In §A.5 it will be shown that template-mismatch can also work in this direction.
Finally, both amplitudes and fluxes tend to be overestimated at low regimes. However, except for the fluxes of the [O iii] lines that can be already biased for , this problem is not always visible in Figures A9a-A9c since the measured values are themselves overestimated at this level. This is shown in the central panels of Figures A9a-A9c by the skewed stripes of points at very low , which correspond to synthetic spectra with lines of the same amplitude. To highlight this bias, in Figure A10 we show the recovery accuracy of the line parameters against the input values, clearly not accessible quantities in the real data. In this figure both the input-output deviations and the formal uncertainties on the amplitudes and fluxes of the lines are shown relative to the input values. This illustrates how accurate these measurements can be in principle, as even for an input and a , the flux and amplitudes of both lines are recovered to a 30% level, and are biased by less than 10%. The H fluxes are less biased than the [O iii] fluxes at low regimes (Figure A10), as effectively the fit to the H line involves a lower number of degrees of freedom.
A.4 Assessing the sensitivity to template mismatch: simulations
In real spectra our ability to match the stellar continuum is more limited, as the range in metallicities and abundances in our template library do not match what is observed in early-type galaxies. This problem can considerably affect our emission-line measurement, and it is difficult to simulate. Yet, we can understand which line is more sensitive to template mismatch by running a second set of simulations. Here only the input template is used to match the stellar continuum, as opposed to our standard procedure, where the whole template library is used. The comparison of these simulations with the previous set, will tell us if systematics are already introduced by allowing the full freedom in our library even in fitting spectra that can be matched by our templates and to which noise and emission lines have been added.
Figure A11 shows the result of this experiment. As expected the fit to the [O iii] lines is not affected by using either the whole library of templates or only the true one, while the estimation of the H line amplitudes and fluxes is more sensitive in this respect. The accuracy in estimating the fluxes of the H lines is on average 30% worse when allowing the full freedom in the template library, with very little dependence on either or , even though the models could perfectly account for the stellar continuum,
When fitting real spectra we can expect that intrinsic limitations in our templates will make things even worse, although it is likely that the impact on the [O iii] measurements will remain more limited.
A.5 Assessing the sensitivity to template mismatch: [O iii] and [O iii] independent fits
The [O iii] doublet provides a natural testbed to assess the impact of template-mismatch on our emission-line measurements using real data. When fitted independently, the [O iii] lines must indeed return the same velocity and velocity dispersion, and their relative fluxes should be consistent with theoretical predictions (e.g., Storey & Zeippen, 2000).
The previous simulations have demonstrated that the accuracy with which the position and the width of the lines are recovered scales as . The weaker [O iii] line will therefore display much larger deviations from the real gas velocity and velocity dispersion than the [O iii] line. The [O iii] deviations will dominate the observed scatter between the velocities and velocity dispersions derived from each of the [O iii] lines. Hence, as long as the [O iii] line is sufficiently strong, we can use it to trace the gas LOSVD parameters, and use the results of the [O iii] fit to study how these parameters are recovered as a function of in this particular spectral region.
Figure A4 shows the results of this experiment for two representative galaxies in our sample. Plotted against the of the [O iii] line are, from top to bottom, the differences between the gas velocities and observed velocity dispersions measured from the two lines in the [O iii] doublet, and their flux ratio. These measurements correspond only to fits where the of [O iii] was greater than 5. The most striking feature in Figure A12 is the difference between the behaviours observed in the two galaxies. Whereas for NGC 2685 the [O iii] lines show position, widths, and fluxes that are consistent with our expectations even for very weak [O iii] lines, in NGC 4278 the scatter between the independently measured LOSVD parameters strongly depends on the of the [O iii] line. Furthermore, as emission becomes weaker, an increasing fraction of the fits return systematically broader [O iii] widths, particularly for .
The observed behaviour is due to template-mismatch. As shown by the green lines in Figure A12, NGC 4278 has much larger stellar velocity dispersions than NGC 2685. On the other hand, the [O iii] lines have similar widths in both cases. A larger stellar velocity dispersion exacerbates the impact of template mismatch on the emission-line measurements in two ways. First, more massive galaxies have stellar populations with higher metallicities and enhanced abundances of their -elements (e.g., Worthey et al., 1992; Greggio, 1997; Trager et al., 2000; Maraston et al., 2003; Thomas et al., 2005), which are more difficult to match with the templates in our library. Second, for a given strength of the template-mismatch features affecting the emission-line measurements, in galaxies with larger the mismatch features are themselves broader and therefore induce a positive bias on the line-widths.
A.6 Concluding Remarks
The previous simulations have shown that the accuracy with which the position and width of an emission line can be measured scales only with the relative strength of the line with respect to the deviations from the fit to the stellar continuum. On the other hand the accuracy in measuring amplitudes and fluxes is dominated by the entity of this same residual noise, which itself depends on the quality of the spectra and the limitations of the template library.
The mild dependence of the flux estimates on the precision with which the emission-line kinematics is measured is reassuring in light of fact that in real galaxies the [O iii] and H lines do not necessarily share the same kinematics. Fortunately, the loss of accuracy in measuring the flux of the strongest H lines due to a poorly estimated kinematics from weak [O iii] lines is not an issue for our sample.
At low regimes the emission-line measurements become dominated by systematics effects and should not be deemed reliable. Even in the framework of ideal simulations the accuracy in recovering the H fluxes is hampered by template-mismatch systematics. By independently fitting the lines of the [O iii] doublet we have further investigated in real spectra the impact of template-mismatch in the [O iii] spectral region. Template-mismatch is more important in the presence of larger stellar velocity dispersions and can induce to overestimated line-widths.
For completeness we report that simulations carried out by measuring independently the position and width of the H and [O iii] lines show, unsurprisingly, that the H kinematics is subject to larger biases than in the case of the [O iii] lines. For instance, to achieve the same accuracy in recovering the [O iii] kinematics for , an for H is needed.
Appendix B Description of individual galaxies
Here we describe the main structures observed in the SAURON maps for the ionised-gas distribution and kinematics of each of the galaxies in the E/S0 sample presented in this paper. We also comment on the observed dust distribution, the connection to the stellar kinematics, the [O iii]/H ratios, and refer to previous narrow-band imaging and long-slit spectroscopic work. We implicitly refer to Figure 4a-4b when describing these structures.
- NGC 474:
-
This well-known shell galaxy (Turnbull et al., 1999) displays a peculiar ionised gas distribution and kinematics. The [O iii] distribution follows a twisted pattern, along which the [O iii] lines are stronger at the northern side of the galaxy between 5″ and 7″ whereas they become stronger at the southern end at larger radii. Although the H lines are much fainter than the [O iii] lines, they seem to follow a similar spatial distribution and indeed escape detection on the northern side beyond 7″. The gas velocity field is characterised by a central and an outer component with almost opposite angular momenta. In both cases the gas kinematics is decoupled from the stellar one. The width of the lines appear to peak in the transition region between the inner and outer gas velocity components, which can be explained as a bias introduced by fitting a single Gaussian to what in fact in some spectra looks like a superposition of two separate components with different velocities. The absence of strong absorption features is surprising given the considerable amount of gas emission.
- NGC 524:
-
This galaxy displays a disk of gas in very regular rotation, in the same sense of the stars, consistent with the IFS observations of Sil’chenko (2000). The emission is close to our detection limit, however, which explains the patchy appearance of the maps. A similarly fragmented distribution is shown by the H+[N ii] narrow-band images of Macchetto et al. (1996). The gas distribution is also matched by an extremely regular distribution of the dust, organised in concentric circular lanes. The strength of the H and the [O iii] emission are comparable, although at the edge of the disk the [O iii] lines become stronger.
- NGC 821:
-
No significant emission is detected in this close to edge-on galaxy. The HST unsharp-masking image reveals a nuclear disk structure but no dust, consistent with Ravindranath et al. (2001).
- NGC 1023:
-
This galaxy displays [O iii] emission that remains strong in the outer regions, with a distribution that appears to be skewed with respect the galaxy major axis. Yet, the gas shows a coherent, though not perfectly regular, velocity field with a reasonably defined zero-velocity curve, which indicates a mild kinematic misalignment between gas and stars. The approaching south-eastern arm indicates that the angular momentum of the gas may vary in the outermost parts of the galaxy. This would be consistent with the complex neutral hydrogen morphology and kinematics found by Sancisi et al. (1984), suggesting an interaction with three nearby companion galaxies. No noticeable absorption feature is visible in the HST image, which also in this case reveals the presence of a nuclear stellar disk.
- NGC 2549:
-
Another object with strong and misaligned emission in its outer parts, where the gas kinematics is misaligned with respect to the stellar kinematics. Towards the centre, however, the angular momentum of the gas quickly aligns itself behind the stellar angular momentum and along the galaxy minor axis, suggesting the presence of a gaseous system well settled on the galaxy equatorial plane. Also in this case no dust is observed, although the unsharp-masked image reveals the clear peanut-shape signature of a boxy bulge.
- NGC 2685:
-
Also known as the Helix galaxy (Burbidge & Burbidge, 1959), this famous peculiar object shows a gas distribution almost perpendicular to the galaxy major axis. A spiral-like structure is evident in the flux maps, in particular on the north-eastern side of the galaxy. This feature could also be regarded as a warped configuration where gas is settling on the galaxy equatorial plane towards the central regions. The gas kinematics is also strongly misaligned with respect to the stellar kinematics, on average by 75°, and shows a complex velocity field, with a zero-velocity curve that is skewed with respect to the direction along which the most extreme velocities are observed. Figure 4b also shows that towards the centre the gas angular momentum is aligning itself behind the stellar one. Near IR narrow-band HST images suggest the presence of a nuclear P disk aligned with the galaxy major axis (Böker et al., 1999), which would confirm the presence of a settled central gaseous system. The velocity dispersion map also shows peculiar features away from the centre along the minor axis, where increases up to 150 . No strong evidence for complex line profiles is found. The unsharp-masked image reveal a nuclear disk and almost perpendicular dust lanes both across the centre and towards the north-eastern side of the galaxy, where also the H emission is stronger than the [O iii]. Elsewhere the distribution of the [O iii]/H ratio is complex.
- NGC 2695:
-
No emission is detected in this galaxy, and no HST image is available. The SAURON unsharp-masked image does not show peculiar features, besides highlighting a twisting of the inner isophotes.
- NGC 2699:
-
This object shows emission only in the central regions, making it difficult to judge the gas kinematics. The HST image reveals a bilobate structure underscoring the presence of a nuclear bar, and a very small nuclear dust disk that was noticed also by Tran et al. (2001).
- NGC 2768:
-
This galaxy is known for hosting a central dust lane along the minor axis (Kim, 1989) and for showing a kinematic decoupling between stars and gas (Bertola et al., 1992) that was later interpreted as the result of a gaseous polar-disk structure (Fried & Illingworth, 1994). The SAURON maps further reveal remarkably different distributions for the [O iii] and H emission. The [O iii] lines follow a twisted pattern that is misaligned by 45° from the direction of the dust lanes, while the H distribution appears to be rounder. HST narrow-band images by Martel et al. (2004) show that the H+[N ii] emission in the central arcsecond also follows an integral-sign pattern that is decoupled from the orientation of the dust. The [O iii] velocity field is well defined, showing peculiar and almost symmetric twists at 10″ from the centre. Overall, the gas motions are almost perpendicular to the stellar ones. The -map shows an elongated peak parallel to the zero-velocity curve, consistent with the observations of Bertola et al. (1995), and possibly also a rise of corresponding to the peculiar twists in the velocity field. The crisscross appearance of the [O iii]/H maps can be interpreted in light of the different shape of [O iii] and H distributions.
- NGC 2974:
-
SAURON observations for this galaxy were previously discussed in detail in Krajnović et al. (2005). Here we note how the -maps highlights the presence of a nuclear bar surrounded by a ring and of two spiral arms connecting to the outer parts of the field where emission remains strong. The presence of nested bars within this galaxy is discussed in the light of the SAURON and HST observations by Krajnović et al. and Emsellem et al. (2003). The inner bar is responsible in particular for the observed twist within the central 4″ in the velocity field, which is otherwise very regular. The velocity dispersion of the gas rises up to 250 and remains moderately high (100 ) also in the rest of the map. The possibility of a dynamical support for the gas motions was first investigated by Cinzano & van der Marel (1994) and recently also by Krajnović et al. Although not perfectly regular, the dust distribution appears to trace the general orientation of the gaseous disk, following in particular part of the -ring.
- NGC 3032:
-
Although heavy binning limits our ability to judge the regularity of the gas distribution and kinematics in this galaxy, overall the gas appears to be consistent with a disk of gas in circular rotation, in almost the opposite sense than the stars. The presence of very regular dust-lanes and of a more regular H kinematics (Figure C13c) further suggest a disk distribution for the gas. This dusty galaxy features the strongest H emission in our sample, and the lowest values for the [O iii]/H ratios. The relative strength of the H line compared to the [O iii] line shows a clear radial pattern: from twice as bright at the edge of the disk, to ten times stronger at 4″, and finally giving way to the [O iii] lines very sharply in the central 2″. The detection of molecular gas by Sage & Wrobel (1989) further suggest ongoing star formation activity.
- NGC 3156:
-
This dusty galaxy shows a complex distribution for the [O iii] emission, with filamentary structures extending perpendicularly to the galaxy major axis. On the other hand, the H emission follows more closely the stellar distribution and forms a nuclear ring corresponding to the location of the central absorption features visible in the HST images. Despite the peculiar features in the [O iii] distribution the gas kinematics show rather coherent motions and very small line widths. The [O iii]/H map displays very large fluctuations, with high [O iii]/H ratios () corresponding to the main [O iii] structures and lower values corresponding to the nuclear H ring.
- NGC 3377:
-
SAURON observations for the ionised-gas distribution and kinematics of NGC 3377 were previously presented in Paper I. Here we note how the ionised-gas distribution displays an integral-sign shaped pattern that is parallelled by a similar twist in the gas velocity field. Along this pattern the emission-line fluxes display a much milder decrease with galactocentric distance than the stellar continuum, resulting in decreasing EW values towards the centre where the weaker H emission eventually escapes detection. The single dust filaments visible on the northern side of the galaxy was also recognised by Tran et al. (2001).
- NGC 3379:
-
The largest member of the Leo Group, this galaxy displays a central disk of gas and a number of isolated sources of emission. The direction of maximum rotation of the central disk is consistent with the orientation of the nuclear dusty ring visible in the HST images, and indicates a 45° kinematic misalignment between gas and stars. The impact of template-mismatch in biasing the measurements towards overestimated values (§3.3.2) is visible at the edge of the central disk, where the strength of the emission lines approaches the detection limit. On the other hand, all isolated sources show very narrow [O iii] lines and undetected H emission, consistent with large [O iii]/H ratios. These characteristics suggest that these sources are in fact PNe. The two sources with the largest EW values 20″ south and south-west from the centre, have positions and velocities consistent with the PNe #4 and #7 of Ciardullo et al. (1993), respectively.
- NGC 3384:
-
This galaxy shows weak [O iii] and H emission close to our detection limit. The unsharp-masked image suggests the presence of two, nested, disk structures. Ravindranath et al. (2001) noticed the same features in near-IR HST images.
- NGC 3414:
-
This peculiar S0 galaxy (Arp 162) shows a spiral pattern in the distribution of the gas, which is more evident in the EW maps and is accompanied by a 90° twist of the velocity field. In the central regions the gas rotates almost perpendicularly with respect to the stars, as noticed by Sil’chenko & Afanasiev (2004). The -map show a very sharp peak, which is elongated in the same direction of the zero-velocity curve, as in the case of NGC 2768. Weak filamentary absorption features are visible in the southern part of this galaxy, consistent with Tran et al. (2001).
- NGC 3489:
-
Similarly to NGC 3156, also this dusty galaxy features a complex [O iii] distribution with filamentary structures and, despite that, a fairly regular velocity field and very narrow lines. It also shows a more uniform distribution for the H emission, which explains the resemblance between the maps for the [O iii]/H ratio and the EW of the [O iii] line.
- NGC 3608:
-
As in NGC 3414, this galaxy shows a spiral pattern in the ionised-gas distribution. In this case, however, the emission lines are much weaker and no gas is detected between the arms. Furthermore both NGC 3414 and NGC 3608 show little overall stellar rotation except in the central regions, where the kinematics of gas and stars are strongly decoupled. No clear absorption features are visible in the HST image, although Tomita et al. (2000) claim to detect a dusty disk.
- NGC 4150:
-
This object displays a extremely smooth EW-maps, exemplifying how closely the gas emission can follow the stellar continuum in early-type galaxies. Despite heavy binning the - and -maps suggest fairly regular gas motions in a dynamically cold disk. A complex dust structure in the central 3″corresponds to the region where the stellar kinematics reveal counter-rotating structure (Paper III) and to a minimum in the [O iii]/H distribution. Outside these central features, the gas and stellar kinematics are mildly misaligned by 20°.
- NGC 4262:
-
Like NGC 3377, this strongly barred galaxy shows an integral-sign pattern in the gas distribution and a twisted -field. In addition, this object shows peculiar asymmetric distributions for the central values of and for the [O iii]/H ratio. The gas and stellar kinematics are strongly decoupled. The unsharp-masked SAURON image shows a bilobated structure reminiscent of that observed at smaller scales in NGC 2699.
- NGC 4270:
-
This galaxy shows only fragmented traces of emission and no evidence for significant absorption features.
- NGC 4278:
-
This galaxy shows the strongest emission, in terms of the EW of the lines, in our sample, allowing to appreciate in detail the peculiar distribution and kinematics of the gas. As in previous objects, the ionised gas displays an integral-sign pattern, a twisted -field, and an asymmetric central peak and distribution of the [O iii]/H ratio. Dust absorption features are visible only on the north-western side of the galaxy. Their morphology suggests an orientation similar to that of the integral-sign pattern. The gaseous and stellar kinematics are misaligned by increasingly wider angles, as the stellar and gaseous velocity fields twist in opposite direction towards the outer parts of the field. This object also hosts an outer H i ring (Raimond et al., 1981) that may be physically connected with the ionised gas given the similar orientation of the two gaseous systems (Goudfrooij et al., 1994).
- NGC 4374:
-
Known for its low-luminosity radio jet (e.g., Laing & Bridle, 1987), also this galaxy shows intense ionised-gas emission. This is confined along a lane running across the galaxy from east to west, which broadens up in the north-south direction at large radii. The central dust lane also runs across the nucleus in the same direction of the ionised-gas, and perpendicular to the radio jet. The gas kinematics indicate a coherent rotation, except in the eastern direction where the initially approaching gas gradually reverse its angular momentum and eventually, beyond 15″ is fully receding. Clear stellar rotation is observed only in the central 3″, in almost opposite direction with respect to the gas. The [O iii]/H-map shows rather uniform values, between 1-2. We note that Chandra observations reveal an H-shaped distribution for the soft X-ray emission (Finoguenov & Jones, 2001) that is broadly consistent with the ionised-gas distribution.
- NGC 4382:
-
Only weak [O iii] emission is detected in this galaxy, mostly towards the centre. The HST unsharp-masked image suggests the presence of a dust lane running across the nucleus along the minor axis direction. However, Lauer et al. (2005) show the absence of dust reddening in the centre and find that NGC 4382 displays a central minimum in its surface brightness distribution.
- NGC 4387:
-
This galaxy shows only marginally detectable emission in few spectra, corresponding to isolated sources, possibly PNe.
- NGC 4458:
-
This galaxy displays only fragmented traces of emission, in particular close to the centre. The HST unsharp-image reveals a nuclear disk (Morelli et al., 2004), consistent with the presence of a central fast-rotating component in the stellar velocity field.
- NGC 4459:
-
This S0 galaxy shows an extremely well-defined dust distribution and regular gas kinematics. The H emission peaks in a circumnuclear ring, corresponding to the region where the dust distribution appears the most circularly symmetric and flocculent. On the other hand, the [O iii] emission very closely follows the stellar continuum. The values of [O iii]/H ratio therefore show a very similar radial pattern to NGC 3032, with a minimum in a circumnuclear region and stronger [O iii]/H ratios toward the centre and the edge of the gas disk. The independently derived H kinematics show faster rotation and smaller velocity dispersions than the [O iii] kinematics, suggesting that the H line is tracing better than the [O iii] doublet a kinematically colder component of gas, which is currently forming stars. The detection of molecular gas by Sage & Wrobel (1989) supports this picture.
- NGC 4473:
-
Also this galaxy displays scattered traces of emission, mostly from the [O iii] doublet. [N ii]+H emission was found by Macchetto et al. (1996) but not by Goudfrooij et al. (1994). The HST unsharp-masked image highlights the presence of a nuclear disk, already noticed by van den Bosch et al. (1994). No dust is visible, contrary to the findings of Ferrari et al. (1999) but consistent with van Dokkum & Franx (1995).
- NGC 4477:
-
Ionised-gas emission in this object is very concentrated toward the centre whereas it decreases more gently than the stellar continuum at outer radii. The gas kinematics is rather regular, and misaligned with respect to the stellar kinematics by 30°. H and [O iii] emission have comparable strengths over most of the field except in the central 5″ where the [O iii]/H ratio rises to values 3. Beside the evident central absorption features, weak dust lanes are visible 7″ to the south.
- NGC 4486:
-
The central member of the Virgo cluster, M87 displays the most complicated gas structures in our sample. The ionised-gas distribution features several filamentary structures and a very bright central component, consistent with previous narrow-band observations (e.g., Sparks et al., 1993). In the central 2″ the emission lines have complex profiles that are poorly matched by single Gaussians, which explains the large central values for . No [O iii] emission is detected along the radio jet, whereas we found H emission when this line is fitted independently. The gas velocities show extreme variations across the field, particularly along the main filamentary structures to the east of the nucleus. The ionised gas is outflowing from the centre to the north, decelerating at larger radii. The main features of the -map are remarkably consistent with the long-slit observations of Sparks et al. (1993). Most of the observed emission comes with rather intermediate values for the [O iii]/H ratio, between 1 and 2, except in the south-eastern filament and on the closer end of bright patch 30″south-east from the centre.
- NGC 4526:
-
Another prototypical example of an early-type galaxy with a perfect dust disk, very regular gas kinematics, a circumnuclear region where H emission is particularly strong, and an independently derived H kinematics indicating faster rotation and smaller velocity dispersions than the [O iii] kinematics. As in NGC 3032 and NGC 4459 molecular gas was detected by Sage & Wrobel (1989).
- NGC 4546:
-
Another galaxy showing an integral-shape pattern in ionised-gas distribution, along which the emission is stronger on the western side of the galaxy 10″ from the centre, and on the eastern side beyond 15″. As in NGC 4262 and NGC 4278 we observe a strong twisting of the gas kinematics, and an asymmetric distribution for the central values and for the [O iii]/H ratios. The gaseous and stellar motions are strongly decoupled, with almost opposite angular momenta (Galletta, 1987). Absorption features are found only close to the centre.
- NGC 4550:
-
Known for hosting two counter-rotating stellar disks (Rubin et al., 1992; Rix et al., 1992), the ionised-gas distribution and kinematics of this peculiar object, together with the observed dust morphology, is consistent with gas moving in a fairly inclined and dynamically cold disk. A spiral arm extending to the south is evident in the EW maps. Wiklind & Henkel (2001) note a similarly lopsided distribution for the molecular gas they detect. Consistent with the measurements of Rubin et al. and Rix et al., the ionised-gas rotates against the stars in the disk dominating the stellar kinematics along the major axis beyond 10″. On the other hand, the gas rotates in the same sense of the stars in the main body of the galaxy. Since this implies that the gas does not necessarily have an external origin, we decided to adopt a value of zero for the kinematic misalignment between gas and stars in NGC 4550 for the purpose of the analysis of §5. Independently derived maps for the [O iii] distribution and kinematics were presented by Afanasiev & Sil’chenko (2002).
- NGC 4552:
-
Ionised-gas emission, mostly from the [O iii] doublet, is clearly detected in the central regions of this object although template-mismatch severely affects the measured values of . In the central 4″ the gas kinematics is strongly decoupled from the stellar kinematics, confirming that the observed emission is not purely an template-mismatch artifact. H+[N ii] emission was detected also by Macchetto et al. (1996). Nuclear [O iii] emission was found also by Cappellari et al. (1999). Patchy absorption features are visible on the north-western side of the centre and 8″ to the north-east. Upon closer inspection, the HST image shows the presence of a very small ring of dust () surrounding the nucleus, consistent with the analysis of Carollo et al. (1997).
- NGC 4564:
-
No significant emission is detected in this galaxy.
- NGC 4570:
-
This object displays several scattered sources of emission. The observed emission is characterised by narrow lines, which appear to trace gas clouds coherently rotating in the same sense of the stars. We found no traces of dust in the HST image, where the nuclear disk studied by van den Bosch et al. (1998) is clearly visible.
- NGC 4621:
-
Emission in this galaxy is found the centre and in a number of isolated sources. Also in this case the scattered sources broadly follow the main stellar stream. As in NGC 4552 template mismatch affects the central measurements, but in this case the gas velocities do not show significant rotation and instead appear to be offset from the central stellar velocities, which are close to zero. The presence of nuclear emission should therefore be confirmed. No H+[N ii] emission was detected by Goudfrooij et al. (1994)
- NGC 4660:
-
This galaxy shows clearly detected [O iii] emission, possibly originating from PNe, in a few spectra, in particular from the southern part of the galaxy. A nuclear disk is visible in the HST image, as recognised also by Lauer et al. (2005)
- NGC 5198:
-
The ionised-gas distribution in this object is characterised by a central component and a filamentary structure extending from it to the north. Near the centre the gas rotates rapidly and almost perpendicularly with respect to the stars in the kinematically decoupled core (Paper III). No coherent pattern for the gas motions in the filaments is recognised, except that the gas moves relatively slowly. No evidence for dust is found, consistent with Tran et al. (2001).
- NGC 5308:
-
No emission is detected in this galaxy, which is almost certainly seen edge-on given the extreme inclination of its nuclear stellar disk (Krajnović & Jaffe, 2004)
- NGC 5813:
-
The ionised-gas distribution in this object is confined within a lane running along the galaxy minor axis. The observed gas kinematics is rather complex outside the central ″, but in the central regions the gas show coherent rotation in approximately the same sense of the stars. The present -map is consistent with the measurements shown in Paper II, once the effect of spatial binning is accounted for. Dust features take the form of filaments running towards the centre from the south and the east. Absorption is also strong on the north-western side of the nucleus. The emission-line fluxes have a similar distribution near the centre. In particular the flux distribution is lopsided along the major-axis direction. Noteworthy are also the strong central peak and the rather uniform distribution of intermediate values for the [O iii]/H ratio.
- NGC 5831:
-
This galaxy shows emission only close to the centre, making it hard to comment on the gas kinematics. No trace of dust absorption features is found.
- NGC 5838:
-
Another S0 galaxy with a very regular dust disk. Considering the small scale of the disk and the effects of atmospheric blurring, the observed gas distribution and kinematics is remarkably similar to that of NGC 4459 and NGC 4526.
- NGC 5845:
-
Only weak [O iii] emission is detected towards the centre of this galaxy. The HST image shows a nuclear stellar disk with an inner dust ring, as noticed by Tran et al. (2001).
- NGC 5846:
-
Ionised-gas in this galaxy is found within 10″and along a filament running to the north-east. Although characterised by large fluctuations in some places, the field clearly indicates a nearly cylindrical rotation for the gas, in the opposite sense of the stars. Remarkably, the zero-velocity curve runs across the north-eastern filament, suggesting this is not a separate component from the gas closer to the centre. The HST image shows dust along an almost parabolic lane swinging around the nucleus. Upon closer inspection, the emission-line fluxes follow very closely the dust distribution, in particular from H. Relatively intermediate [O iii]/H values are observed across most of the field.
- NGC 5982:
-
As in NGC 5198, the gas in this bright elliptical is found in a rapidly rotating central component and in a filament extending from it, in this case to the south. In NGC 5982, however, the motions along the filament are remarkably coherent. The gas velocities seem to suggest that the gas, initially approaching the observer from the southern end of the filament, progressively decelerates and plunges back toward the centre following a curved trajectory. The gas in the centre rotates in the same sense as the stars in the well-known kinematically decoupled core (Wagner, Bender & Moellenhoff, 1988). Absorption features are neither found in the V-band unsharp-masked image nor in the V-H colour image of Quillen et al. (2000).
- NGC 7332:
-
SAURON maps for the ionised-gas distribution and kinematics for this SB0 galaxy were already presented by Falcón-Barroso et al. (2004). Here we note how, like in NGC 2549 and NGC 1023, the gas emission remains relatively strong in the outer parts of the galaxy, where the gas distribution is misaligned with respect to the galaxy major axis and the gas kinematics is decoupled from that observed in the inner regions. We also note the large variations in the [O iii]/H values, and the presence of dust in the HST-WFPC image.
- NGC 7457:
-
Another galaxy with strong and misaligned emission in its outer parts. Near the centre the gas rotates in the opposite sense to the gas in the outer parts and also against the motion of the bulk of the stars in this object. No dust is found in the HST unsharp-masked image.
Appendix C Maps for independently derived [O iii] and H kinematics
In this appendix we show for 10 galaxies maps for independently derived velocity and intrinsic velocity dispersion of the [O iii] and H lines. These objects are the only ones in our sample for which, over most of the regions where emission is observed, the measured H kinematics do not suffer from the template-mismatch effects described in §2.1. This was ensured by comparing the H velocity maps to the stellar velocity maps and by further noticing that spurious H emission lines tend to be considerably broader than the [O iii] lines.
Figures C13a-C13c show the independently derived [O iii] and H velocity and intrinsic velocity dispersion of these 10 galaxies. Since among them, 3 are giant ellipticals and 4 show regular and concentric dust lanes, Figure C13a shows first the maps for the remaining 3 galaxies, while figures C13b and C13c shows maps for these two groups. In addition, Figure C13a shows again the case of NGC 3489, to highlight the main characteristics of an unreliable H kinematics.