Formation of Magnetically Supported Disks During Hard-to-Soft Transition in Black Hole Accretion Flows
Abstract
We carried out three-dimensional global resistive magnetohydrodynamic (MHD) simulations of the cooling instability in optically thin hot black hole accretion flows by assuming bremsstrahlung cooling. General relativistic effects are simulated by using the pseudo-Newtonian potential. Cooling instability grows when the density of the accretion disk becomes sufficiently large. We found that as the instability grows the accretion flow changes from an optically thin, hot, gas pressure-supported state (low/hard state) to a cooler, magnetically supported, quasi-steady state. During this transition, magnetic pressure exceeds the gas pressure because the disk shrinks in the vertical direction almost conserving the toroidal magnetic flux. Since further vertical contraction of the disk is suppressed by magnetic pressure, the cool disk stays in an optically thin, spectrally hard state. In the magnetically supported disk, the heating rate balances with the radiative cooling rate. The magnetically supported disk exists for time scale much longer than the thermal time scale and comparable to the accretion time scale.
We examined the stability of the magnetically supported disk analytically, assuming that the toroidal magnetic flux is conserved, and found it thermally and secularly stable. Our findings may explain why black hole candidates stay in luminous, X-ray hard state even when their luminosity exceeds the threshold for the onset of the cooling instability.
1 Introduction
State transitions between a low/hard state and a high/soft state are observed in Galactic black hole candidates such as Cyg X-1 (e.g., Holt et al. (1975); Oda (1977); Zdziarski et al. (2002)), GS 1124-68 (e.g., Kitamoto et al. (1992); Ebisawa et al. (1994)), GRS 1915+105 (e.g., Belloni et al. (2000); Ueda et al. (2002)) and GX 339-4 (e.g., Miyamoto et al. (1991), 1995; Zdziarski et al. (2004); Homan et al. (2005)). Recent RXTE observations of state transitions in binary black hole candidates and their relation to jet ejections are reviewed by Fender, Belloni & Gallo (2004) and Remillard (2005). The low/hard state is characterized by violent X-ray fluctuations and absence of the soft blackbody component in its spectrum. In this state, mass accretes to the black hole as an optically thin, advection dominated accretion flow (e.g., Ichimaru (1977); Narayan & Yi (1994), 1995). The spectrum of a high/soft state is dominated by blackbody-like component emitted from an optically thick, geometrically thin disk (e.g., Shakura & Sunyaev (1973)). Recent X-ray observations of outbursts of GX 339-4 indicate that the source stays in the spectrally hard and luminous intermediate state during the transition from low/hard state to the high/soft state (Homan et al. (2005); Remillard (2005)). It has been suggested that relativistic ballistic ejections occur during the transition from this intermediate state to the optically thick, soft state (Fender et al., 2004).
Outbursts of black hole candidates are triggered by the increase of the mass accretion rate from the outer radius (Mineshige & Wheeler, 1989). In the early stage of an outburst, since a hot, optically thin, hard X-ray emitting disk is formed around the black hole, the black hole candidate is observed as staying in the low/hard state. The X-ray luminosity of the disk increases as the accretion rate increases. Abramowicz et al. (1995) obtained thermal equilibrium curves of optically thin accretion disks including both the bremsstrahlung cooling and advective cooling (see also Kato et al. (1998)). They showed that when the mass accretion rate (and, hence, surface density) exceeds some limit, optically thin disks cannot be in thermal equilibrium because the radiative cooling overwhelms the heating. When this limit is reached, therefore, a thermal instability is triggered so that the disk should cool and shrink in the vertical direction (Mineshige (1996); Lasota, Narayan, & Yi 1996).
During this vertical contraction of the disk, magnetic fields in the turbulent disk will be amplified due to flux conservation or will be dissipated by magnetic reconnection. In the former case, strongly magnetized disk will be formed. The possible existence of such low- () disk was pointed out by Shibata, Tajima & Matsumoto (1990). Although magnetic flux can buoyantly escape from the disk by the Parker instability (Parker, 1966), once low- disk is formed, the disk stays in the low- state because magnetic tension prevents the growth of the Parker instability. They called such disks as magnetic cataclysmic disks because explosive events will take place when the magnetic energy stored in the disk is released. Mineshige, Kusunose & Matsumoto (1995) suggested that low- disks may correspond to the low/hard state. Recently Pariev, Blackman and Boldyrev (2003) constructed a model of an optically thick, low- disk based on -prescription of viscosity. However, they did not show how the low- disks are created. Three-dimensional resistive MHD simulations can answer this question.
Global 3D MHD simulations of radiatively inefficient accretion disks have been carried out by several authors (e.g., Matsumoto (1999); Hawley (2000),2001; Machida et al. (2000); Armitage & Reynolds (2003); Machida & Matsumoto (2003); Igmenshchev et al. (2003); Kato et al. (2004)). It has been shown that the MHD turbulence driven by magneto-rotational instability (MRI) enhances the angular momentum transport rate and enables mass accretion. Initially weak magnetic fields are amplified due to the MRI, and saturates when the plasma- is about . Machida, Nakamura & Matsumoto (2004) showed that the radial structure of its innermost region (, where is the Schwarzschild radius) agrees well with that of one-dimensional steady transonic solutions, in which the radial advection and the radial dependence of are both taken into account. As the accretion rate increases, the surface density of the disk increases. Numerical solutions follow the evolution track expected from conventional theory of optically thin, advection dominated hot accretion flows (e.g., Abramowicz et al. (1995)).
The purpose of this paper is to study the growth of the thermal instability which takes place when the density of the optically thin disk becomes sufficiently large. We first simulated the formation of an optically thin, turbulent disk without including the radiative cooling. Subsequently, we simulated the growth of the thermal instability by including the radiative cooling term.
2 Numerical Model
2.1 Basic Equations
We solved the following resistive MHD equations in a cylindrical coordinate system ;
| (1) |
| (2) |
| (3) |
| (4) |
where , , , , , , , and are the density, pressure, gravitational potential, velocity, magnetic field, current density, resistivity, temperature and specific entropy, respectively. The specific entropy is expressed as where is the specific heat capacity and is the specific heat ratio. The Joule heating term and the radiative cooling term are included in the energy equation. We assume the anomalous resistivity (Yokoyama & Shibata, 1998) where is the electron-ion drift speed and is the threshold above which anomalous resistivity sets in. We assume bremsstrahlung cooling .
General relativistic effects are simulated by using the pseudo-Newtonian potential (Paczyński & Wiita, 1980), where is the gravitational constant, is the mass of the black hole, and . We neglect the self gravity of the disk.
2.2 Numerical Methods and Boundary Conditions
We solved the resistive MHD equations in a cylindrical coordinate system by using a modified Lax-Wendroff scheme (Rubin & Burstein, 1967) with an artificial viscosity (Richtmyer & Morton, 1967).
For normalization, we use units listed in table 1. The units of length and velocity are Schwarzschild radius and the light speed . For unit density, we adopt , where is the electron scattering opacity. The unit time is . The unit temperature is given by , where is the proton mass and is the Boltzmann constant. The accretion rate is normalized by , where is the Eddington luminosity.
In the energy equation, we use the normalized cooling rate
| (5) |
Here, is ion temperature and is a parameter depending on the electron-ion coupling and inverse Compton amplification. In this paper, we assume single temperature plasma and adopt .
We solved the energy equation transformed to the conservation form;
| (6) |
where and ′ denotes the normalized quantities. In the following, we omit ′ from the symbols for simplicity except the radiative cooling term. In this formulation of the energy equation, the numerically dissipated kinetic energy and magnetic energy are captured as the thermal energy (Hirose et al., 2005). Shock heating is also incorporated self-consistently. When magnetic turbulence develops in the disk, the disk plasma is heated more efficiently than expected from the Joule heating. However, in the early stage of the simulation when the disk is still laminar, since we did not include the explicit heating term except the Joule heating, the disk heating is insufficient to balance with the cooling term. Thus, we include the radiative cooling term after a quasi-steady turbulent accretion disk is formed through accretion from the initial torus.
The number of grids is . The grid size is for , and otherwise increases with and . The grid size in azimuthal direction is . We simulated only the upper half space by applying a symmetric boundary condition at the equatorial plane . The outer boundaries at and at are free boundaries where waves can be transmitted. We included the full circle in the simulation region, and applied periodic boundary conditions in the azimuthal direction. An absorbing boundary condition is imposed at by introducing a damping parameter;
| (7) |
Physical quantities inside are re-evaluated by
| (8) |
which means that the deviation from initial values is artificially reduced with damping rate . Waves propagating inside are absorbed in the transition region ().
2.3 Initial Model
The initial state of our simulation is an equilibrium torus threaded by weak toroidal magnetic field (Okada et al., 1989). Initially the torus is assumed to have a constant specific angular momentum .
According to Okada et al. (1989), by using the polytropic relation at the initial state and by assuming
| (9) |
where is the initial plasma at the initial pressure maximum of the torus , and is the azimuthal magnetic field, we integrated the equation of motion into a potential form;
| (10) |
where is the sound speed, is the Alfvén speed, and . At , the rotation speed of the torus equals the Keplerian velocity. By using equation (10), we obtain the density distribution as
| (11) |
where is the density at . Outside the torus, we assumed a hot, isothermal () spherical halo. The density distribution of the halo is given by , where is the gravitational potential at . We assume that the radiative cooling is negligible in the coronal region where the density is lower than .
In this paper, we adopted model parameters , , , , , , , and . The inner and outer radii of the initial torus are , and , respectively.
3 Numerical Results
3.1 Evolution of a Thermally Unstable Accretion Disk
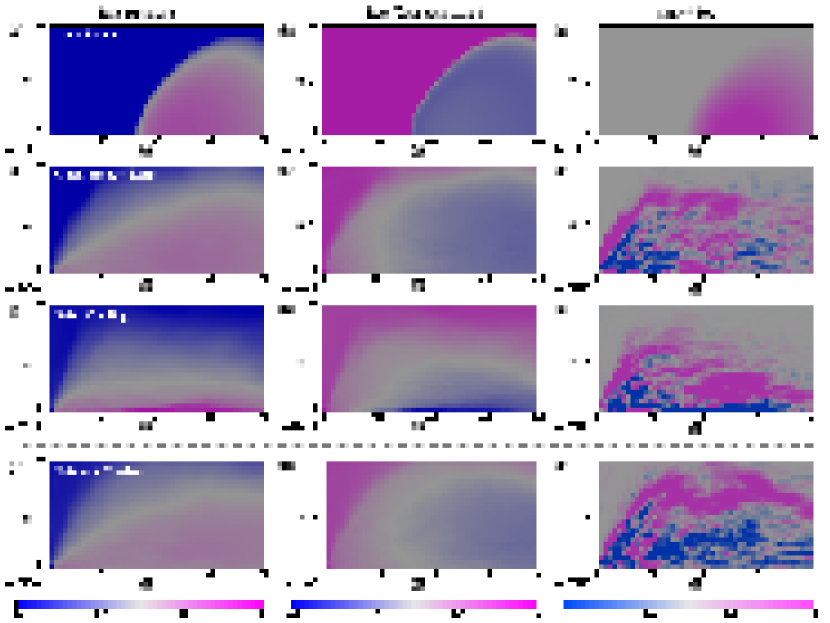
Here we present the results of the numerical simulation for a model with . Figure 1 shows the time evolution of azimuthally averaged density , temperature and azimuthal component of magnetic fields. The top panels show the initial state. Figure 1d, 1e and 1f show the stage just before the cooling term is switched on. The initial torus deforms itself into an accretion disk by transporting angular momentum through Maxwell stress. Azimuthal magnetic fields are not completely random but show sector structures.
We switched on the radiative cooling term at when the disk becomes quasi-steady. At this stage, the Thomson optical thickness of the disk is . Here, the surface density is computed by vertically integrating the azimuthally averaged density from to , where is the half thickness of the disk, which we take . The disk is thick for Thomson scattering () but effectively optically thin (see e.g., Kato et al. (1998)). This state corresponds to the low/hard state observed in black hole candidates.
The third panels from top in figure 1 show the stage after the onset of the cooling instability. Geometrically thin, cool, dense disk is created in . Magnetic fields in the equatorial region of the vertically shrinking cool disk become almost toroidal and well-ordered. In the inner region (), the disk still stays in the hot state.
For comparison, in the bottom panels in figure 1, we show the numerical results at for a model without including the radiative cooling term. The disk continues to stay in the hot, magnetically turbulent state. Between and , the disk structure does not change significantly.
We also confirmed that even when we included the cooling term, if the initial density of the torus is small enough (), the whole disk stays in optically thin hot state throughout the simulation .
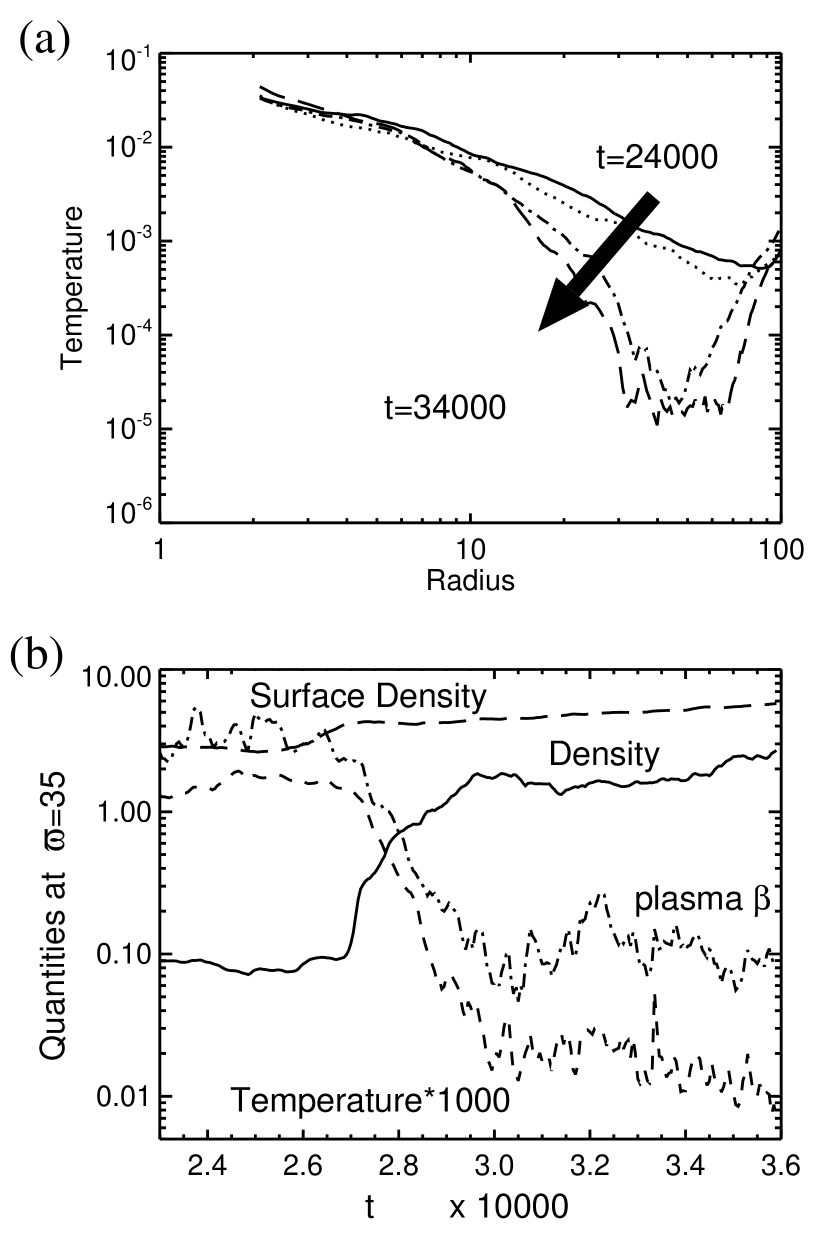
Figure 2a shows the radial distribution of the temperature averaged in the azimuthal direction and in the vertical direction (). Curves show the temperature at , , , and from top to bottom. This figure indicates that cooling front propagates inward. The temperature in the cool region decreases down to ( in physical units). The region stays in the hot state throughout the simulation. The inner region stays in the hot state because the accretion rate is not large enough to trigger the thermal instability in this region. Note that in conventional models of optically thin, hot accretion flows including bremsstrahlung cooling, the critical accretion rate for the onset of the cooling instability increases with decreasing the radius (Figure 2 in Abramowicz et al. (1995)).
Figure 2b shows the time evolution of azimuthally averaged surface density, equatorial density, equatorial temperature and equatorial plasma at . Here, surface density is integrated in . Numerical results indicate that after the inclusion of radiative cooling, the disk evolves quasi-steadily until . Subsequently, the disk shrinks in the vertical direction due to the cooling instability. As the cooling instability grows, plasma decreases and the disk becomes dominated by magnetic pressure (i.e. ).
Let us compare the cooling time scale with other time scales. Before the onset of the cooling instability, since [ in physical units] and [ g ], the cooling time scale is [ sec in physical units] at . This time scale is comparable to the rotation time scale where is the dynamical time scale at . Here is the rotation angular speed. The accretion time scale is an order of magnitude larger than the thermal time scale. Numerical results indicate that the temperature of the disk decreases from to in . This time scale () is consistent with the time scale for the growth of the thermal instability.
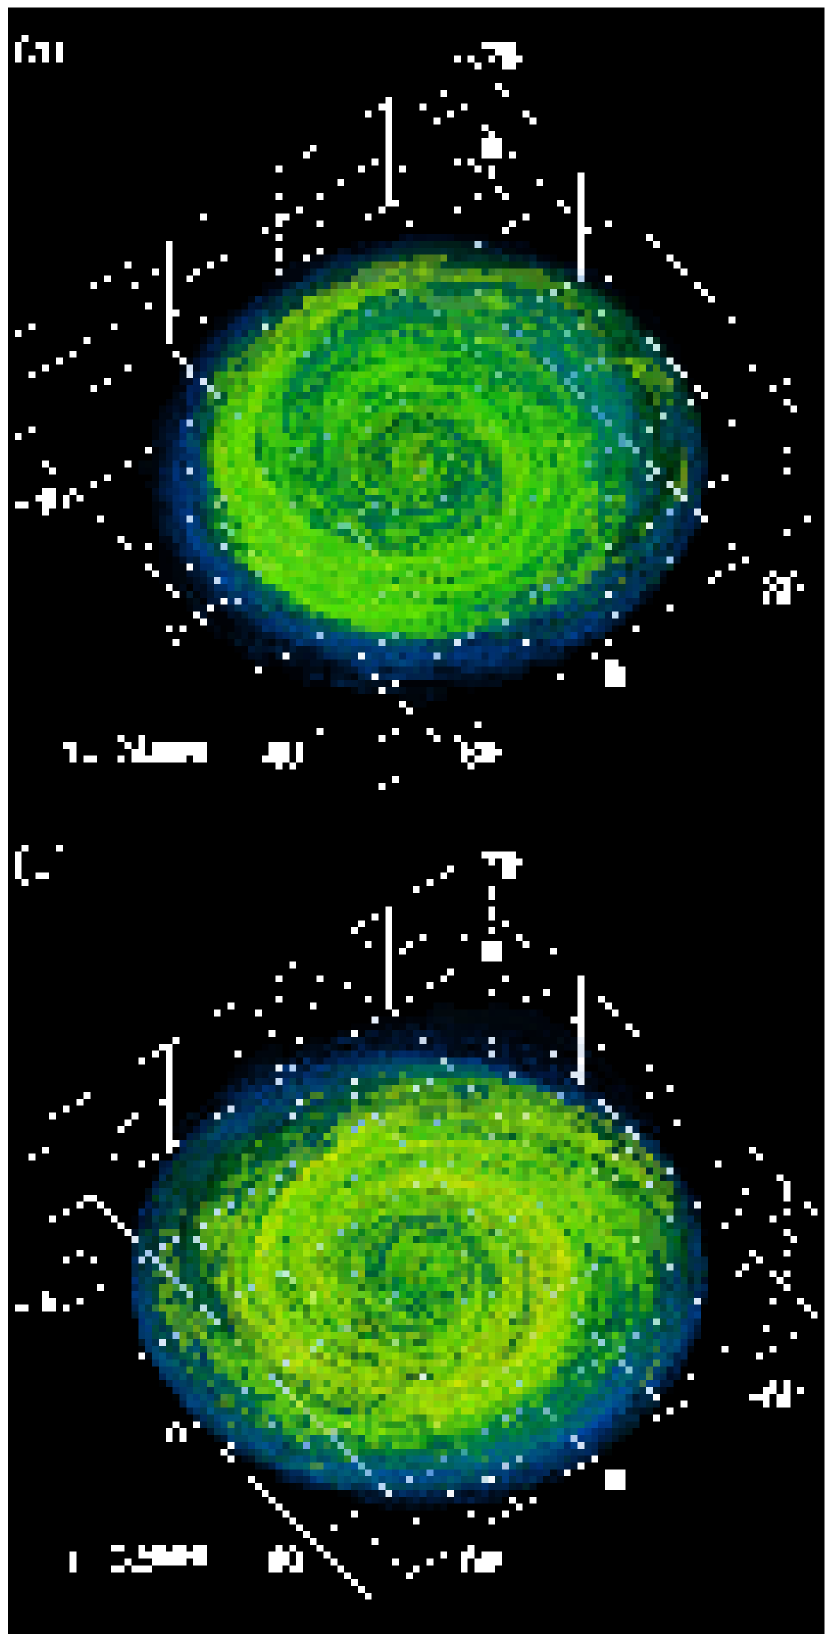
Figure 3 shows the isosurface of the plasma at and . The blue, green, and yellow surfaces show , , and , respectively. Before the cooling term is switched on, low- regions () occupy only a small fraction of the disk. However, after the onset of the transition, the low- regions fill the disk. The filling factor of the low- region in increases from to during the transition.
3.2 Structure of Global Magnetic Fields
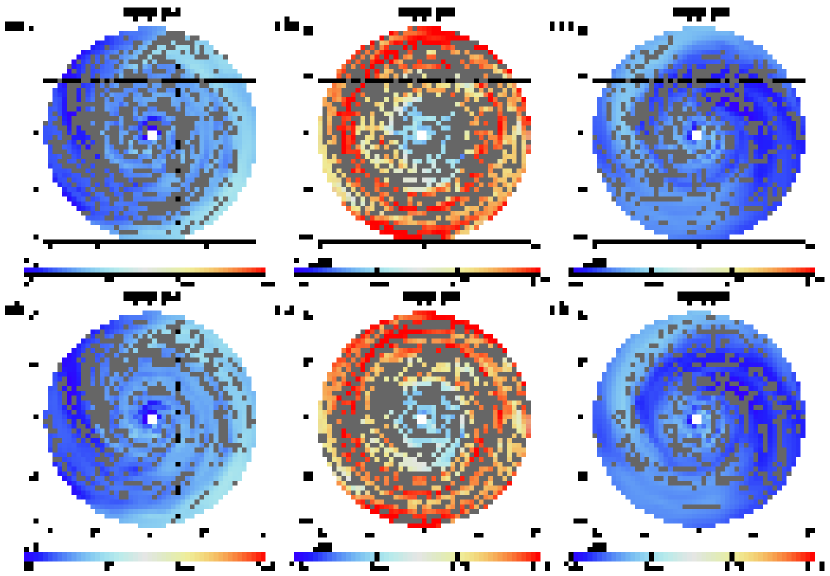
Top panels of figure 4 show the equatorial logarithmic density (color) and magnetic field lines projected onto the equatorial plane (gray curves). Before the cooling instability grows (figure 4a), magnetic field lines show loosely wound global spiral structure superposed by turbulent components. As the disk cools, magnetic fields turn into a tightly wound spiral (figure 4b). The equatorial density increases in the outer region (), where cooling instability grows. Figure 4c shows the equatorial density and magnetic field lines at for a model without radiative cooling. In this model, the equatorial density remains small and the magnetic fields show large amplitude fluctuations.
In low- disks, turbulent magnetic fields become smaller than those in hot, gas pressure dominated disks because magnetic tension suppresses the motion with short azimuthal wave length. In order to show this more clearly, we decomposed magnetic fields to mean magnetic field and turbulent magnetic field where the mean magnetic field is computed by averaging the magnetic field in the region grids in and directions and grids in azimuthal direction. The bottom panels in figure 4 show the equatorial density and magnetic field lines depicted by the mean magnetic fields . Figure 4e shows that as the disk cools, magnetic fields turn into a tightly wound spiral with well ordered mean magnetic fields.
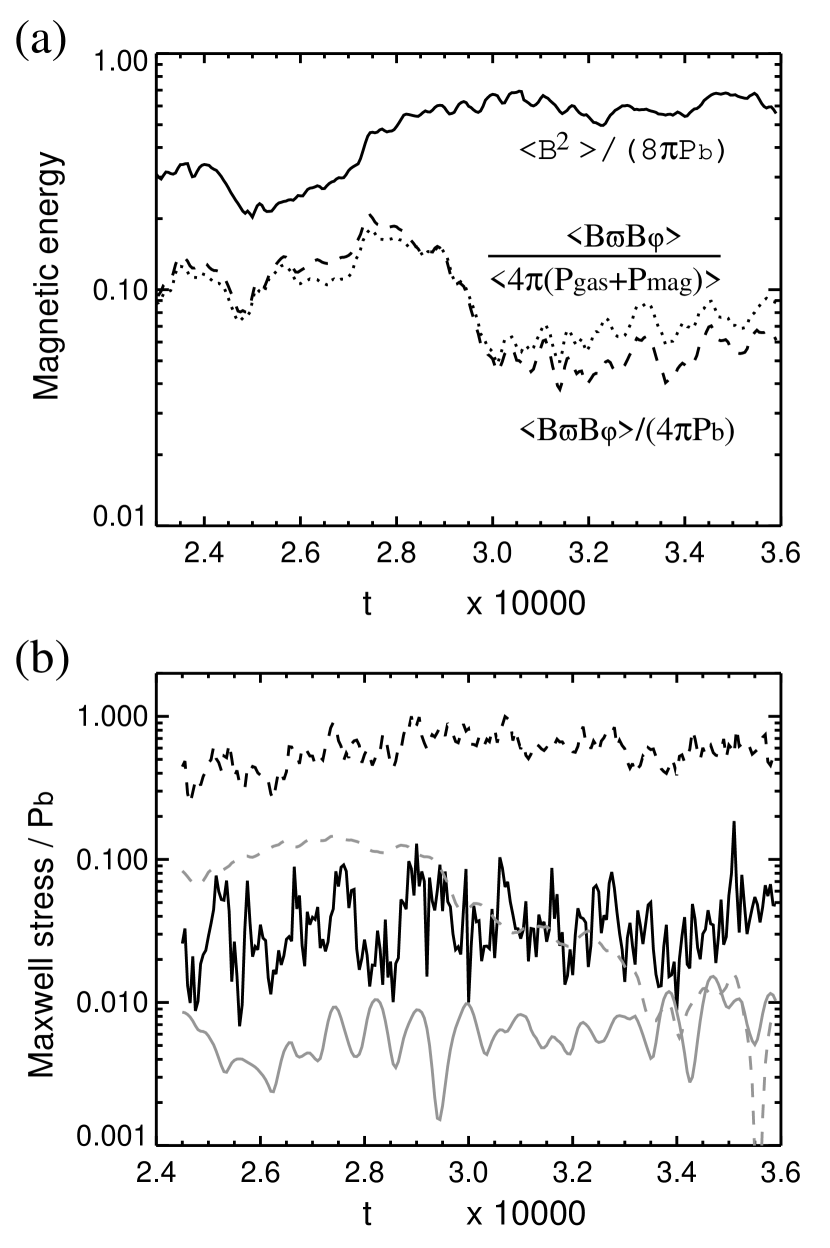
Figure 5a shows the time evolution of the magnetic pressure and Maxwell stress at . The solid and dashed curves show the magnetic pressure and Maxwell stress normalized by the initial gas pressure averaged in the azimuthal direction and in the vertical direction (). The magnetic pressure increases as the disk shrinks in the vertical direction by cooling instability. The average ratio of Maxwell stress to the total pressure slightly decreases but stays around .
Although the magnetic energy increases when low- disk is formed, Maxwell stress does not increase because the fluctuating radial magnetic field decreases. Inside the low- disk, azimuthal component of magnetic field dominates the fluctuating radial magnetic field. Figure 5b shows the time evolution of the Maxwell stress normalized by the initial gas pressure, averaged in azimuthal direction, in radial direction, and in vertical direction . Black curves show the Maxwell stress averaged in the inner region (), and gray curves show that averaged in the outer region (). The solid curves and the dashed curves show the time variation of the Maxwell stress computed from the mean magnetic field and that computed from the fluctuating magnetic field . In the inner region where the disk still stays in the hot state, the angular momentum transport is mainly due to the fluctuating component. In the outer region, the angular momentum transport by fluctuating field decreases with time and becomes comparable to that by mean magnetic fields. This figure indicates that the magnetic turbulence is suppressed inside the magnetically supported disk but the angular momentum is still transported by the Maxwell stress of mean magnetic fields.
3.3 Increase of Luminosity
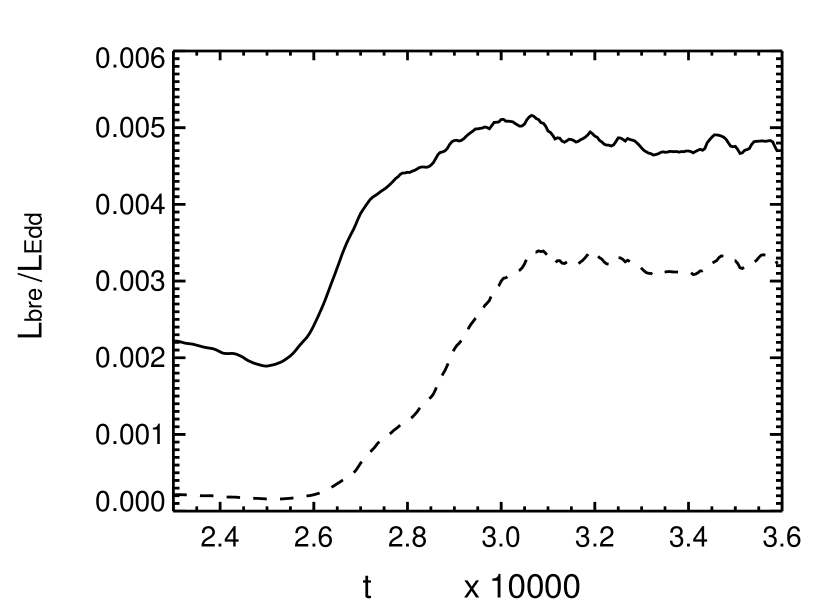
Figure 6 shows the time variation of the X-ray luminosity computed by integrating the optically thin bremsstrahlung cooling term in , (solid curve) and in , (dashed curve) when . This luminosity is normalized by the Eddington luminosity. X-ray luminosity increases during the growth of the thermal instability because the equatorial density increases 10 times while the temperature decreases 100 times. Thus the cooling rate in becomes 10 times higher than that before the transition. In this stage, the effective optical depth in the low- region is about . Thus the disk still stays in an optically thin state. The increase of the X-ray luminosity saturates because the mass accretion rate from the outer region saturates. In our simulations, the mass accretion rate in is when . Since the energy conversion rate from the rest mass energy to radiation is in accretion disks around a Schwarzschild black hole, when . The disk luminosity shown in figure 6 is an order of magnitude smaller than this limit because the innermost region () still stays in radiatively inefficient optically thin, hot state. The saturation level of the luminosity will increase if we start simulation with larger because the maximum accretion rate from the outer torus increases as the initial density of the torus increases. When the accretion rate further increases, the conversion rate from rest mass energy to radiation will also increase because the inner region of the disk undergoes a transition to radiatively efficient cool disk. In this paper, we only included the bremsstrahlung cooling. It should be noted that in optically thin, hot, magnetized disks, synchrotron Compton cooling may also contribute to increase the X-ray luminosity.
4 Discussion
4.1 Evolution of Optically Thin Accretion Disks
In this paper, we have shown by direct numerical simulations without assuming -viscosity that magnetically supported disk is created during the transition from a low/hard state to a high/soft state in black hole accretion flows.
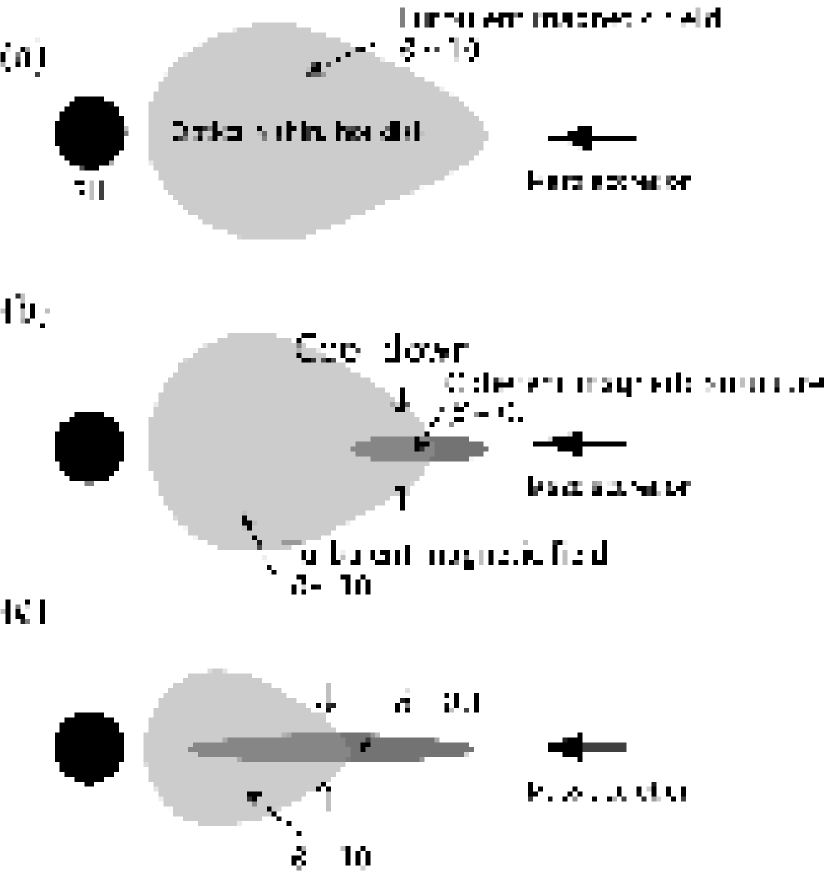
Figure 7 schematically shows the evolution of an optically thin accretion disk. As the accretion rate from the outer disk increases (figure 7a), the density of the inner accretion disk increases. When the density of the disk exceeds the critical density for the onset of the cooling instability at some radius, the disk cools and thus shrinks in the vertical direction (figure 7b). In such regions, magnetic pressure dominates the gas pressure because (1) gas pressure decreases due to cooling, while (2) the azimuthal magnetic field increases as the disk shrinks in the vertical direction. The latter is due to the formation of sector structures in azimuthal magnetic fields. If the magnetic fields in turbulent accretion disks are purely random, they will be dissipated by magnetic reconnection, when the disk shrinks in the vertical direction. If magnetic fields have coherent structures such that the azimuthal component has the same sign in some regions, however, they can survive during the contraction due to cooling. Moreover, the field strength increases as the region shrinks conserving the toroidal magnetic flux.
Since magnetic pressure supports the disk even when temperature decreases, the disk stops shrinking in the vertical direction and approaches a new equilibrium state. The magnetically supported disk emits power-law hard X-rays because the disk still stays in optically thin state. Since the critical surface density for the onset of the cooling instability in the inner radius is larger than that in the outer radius when bremsstrahlung cooling is assumed (Abramowicz et al., 1995), the inward propagation of the cooling front stops and the innermost region stays in the hot state. We expect that when the accretion rate from the outer disk further increases, the transition radius between the hot, gas pressure dominated region and the cool, magnetic pressure dominated region will move inward (figure 7c).
The evolution of the innermost region of optically thin disks will depend on the cooling mechanism. When the synchrotron and/or Compton cooling were included, transition to the magnetically supported disk may start from the inner region because the cooling rate in the innermost region of the disk will be enhanced.
4.2 Thermal Equilibrium Curves of low- Disks
Numerical results revealed that as the cooling instability grows, the disk approaches to a quasi-steady state when a low- disk is formed. The cooling time scale is , here represents the average of a quantity over a range of . Figure 2b shows that the equatorial temperature stays at least for time scale of . This indicates that in this state, heating balances with cooling. Since the dissipative heating rate of turbulent accretion disks is comparable to (Hirose et al., 2005), the heating time scale can be estimated by , where . Before the thermal instability grows, since the disk is dominated by gas pressure, and (see figure 5a), . After the cooling instability grows, the disk evolved toward a magnetic pressure dominated state in which . Thus, the heating time scale at this stage is at . This time scale is comparable to the cooling time scale.
Numerical results indicate that steady equilibrium solutions of optically thin, low- disks exist. Thermal equilibrium curves of accretion disks can be obtained by equating the heating rate and radiative cooling rate or advective cooling rate , assuming -viscosity (Abramowicz et al. (1995); see also Kato et al. (1998)). When magnetic pressure is dominant, the vertically integrated pressure can be evaluated by , where is the half thickness of the disk. The vertical hydrostatic balance requires . Based on the numerical results, we assume at a fixed radius, where is the azimuthal magnetic flux per unit radius. Thus . By equating this equation with , we obtain . So we obtain the heating rate
| (12) |
Since , .
The radiative cooling rate is expressed as
| (13) |
By equating and , we obtain
| (14) |
When we adopt and according to the results of our numerical simulation at and , we obtain
| (15) |
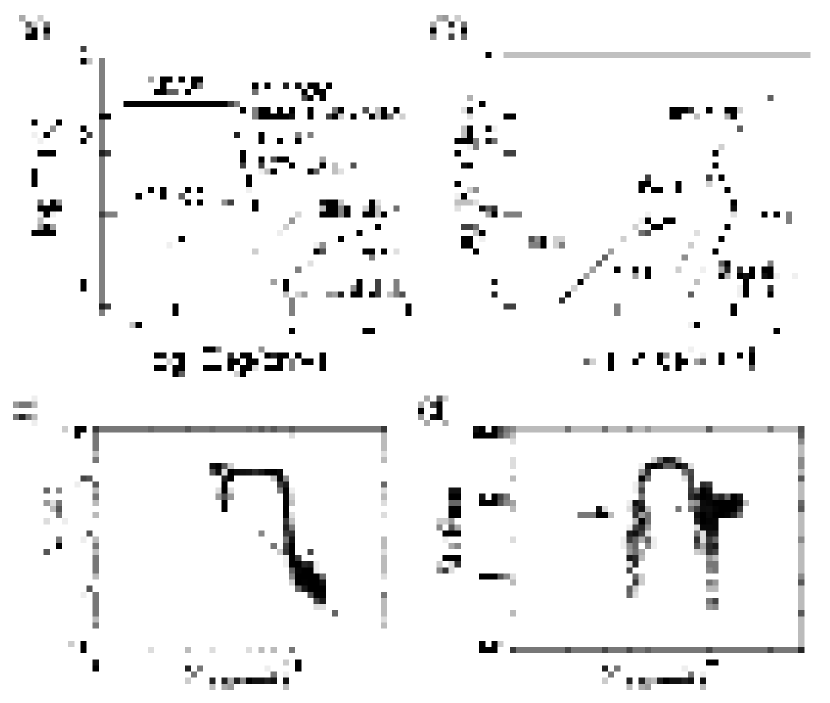
Figure 8a and 8b show the thermal equilibrium curves of accretion disks. Thin curves show the equilibrium curves of conventional accretion disks (Abramowicz et al. (1995); see also Kato et al. (1998)). Thick solid curves show the optically thin low- branch depicted by using equation (15) and . These curves should be connected to the optically thin, gas pressure dominated branch as indicated by the thick dotted curves. The connection between the hot gas pressure dominated branch and the magnetic pressure dominated cool branch should be studied including the advective cooling and will be presented in a separate paper (Oda et al. 2006 in preparation).
Let us discuss the thermal stability of the low- branch. Since (equation (12)) and (equation (13)), and ,
| (16) |
This indicates that the low- branch is thermally stable (e.g., Pringle (1981)). The low- branch is also secularly stable because at a fixed radius, thus the criterion for the secular stability (e.g., Pringle (1981)),
| (17) |
is satisfied.
Figure 8c shows the relation between and obtained from our numerical simulation. Here, is the equatorial temperature. The symbols show the surface density and mass accretion rate at averaged in azimuthal direction and integrated in . The time range plotted is . An arrow indicates the time () when we included the radiative cooling. The dashed line shows the relation expected from the above theory. Figure 8d shows the relation between and . As the disk approaches the quasi-steady low- state, it follows the theoretically expected relation .
4.3 Dependence on Initial Magnetic Field Configuration
We would like to discuss the dependence of numerical results on the initial configuration of magnetic fields. Since the growth rate of MRI is larger when the initial magnetic field has poloidal component than the case with purely toroidal magnetic field (e.g., Hawley (2001); Kato et al. (2004)), the accretion from the initial torus proceeds faster in models with initially poloidal magnetic field. In the nonlinear stage, however, the structure and strength of magnetic fields do not depend significantly on the initial configuration of magnetic fields so long as the initial magnetic field is weak and confined inside the disk. In simulations starting from weak poloidal magnetic fields embedded inside the disk (e.g., Hawley (2001); Kato et al. (2004)), the amplification of magnetic field saturates when . The magnetic field strength at this stage and the ratio of poloidal magnetic field to toroidal magnetic field are comparable to that for purely azimuthal magnetic fields. Our simulation results also show significant mass outflows in the coronal region, consistent with the results starting from weak poloidal magnetic fields. Thus, when radiative cooling is included after a magnetically turbulent accretion disk is formed, subsequent evolution of the disk will not be sensitive to the initial configuration of magnetic fields.
4.4 Comparison with Observations
Let us compare our numerical results with observations of black hole transients. Homan et al. (2005) pointed out that during the transition from the low/hard state to the high/soft state, GX 339-4 shows a sub-transition from hard intermediate state dominated by power-law X-ray radiation to soft intermediated state dominated by radiation from optically thick disk. The X-ray luminosity of the hard intermediate state is 1-10% of the Eddington luminosity in GX339-4 (Remillard, 2005). This luminosity is much higher than the critical luminosity above which the optically thin, hot gas pressure dominated disk becomes thermally unstable. In our simulations, the critical luminosity for this transition is about 0.2% of the Eddington luminosity (see figure 6). The magnetic pressure dominated disk shows hard X-ray spectrum because it is still optically thin. Thus, numerical results suggest that the luminous disk in the luminous hard state stays in the thermally stable low- branch.
The X-ray luminosity in our simulation results saturated at about 0.5% of the Eddington luminosity because the mass accretion rate from the outer torus saturated at about (figure 8b). We expect that when the mass accretion rate from the outer region continues to increase, the transition radius between the inner hot flow and the outer cool low- disk will move inward and the X-ray luminosity will continue to increase. Such simulations will be possible by starting simulations from a torus initially located at larger radius.
Since the low- disk is supported by magnetic pressure, the transition to the optically thick (soft intermediate) state needs the dissipation or expulsion of magnetic fields supporting the disk. Recently, Fender et al. (2004) pointed out that in galactic black hole candidates, relativistically moving blobs are ejected during the transition from a low/hard state to a high/soft state. Our numerical results suggest that such ejections originate from the releases of magnetic energy stored in the low- disk. When magnetic flux inside the disk is ejected by such explosive events, the disk will again be supported by gas pressure and will be able to shrink further in the vertical direction. Extraction of magnetic flux from the low- disk enables the disk to complete the transition to the optically thick, high/soft state.
Synchrotron and/or Compton scattering are not included in the present study. If included, magnetically supported disks are expected to emit enhanced radiation from the inner parts of the disk. It may resolve the issue of overproduction of bremsstrahlung from the outer parts of the low luminosity MHD flow (see Ohsuga et al. (2005) for discussion).
In this paper, we assumed single temperature plasma. In optically thin, hot accretion disks, electron temperature can be lower than the ion temperature. Such two temperature global disk models including radial advection were studied by Nakamura et al. (1997; see also Manmoto et al. (1997)). To fit the observational spectra, two-temperature nature of accretion flow should be considered in the simulations. Works are now in progress to extend our simulation code to two temperature plasmas.
We are grateful to S. Mineshige, R.A. Remillard, M.A. Abramowicz, D. Meier, S. Hirose and Y. Kato for discussion. Part of this work was carried out when M.M. and R.M. attended the KITP program on ”Physics of Astrophysical Outflows and Accretion Disks” at UCSB. Numerical computations were carried out by VPP5000 at NAOJ (P.I. MM). This work is supported in part by Japan Society for the Promotion of Science (JSPS) Research Fellowships for Young Scientists (MM: 16-1907, 17-1907), Grant-in-Aid for Scientific Research of the Ministry of Education, Culture, Sports, Science and Technology (RM: 15037202, 16340052, 17030003), ACT-JST of Japan Science and Technology corporation, and by the National Science Foundation under Grant No. PHY99-07949.
References
- Abramowicz et al. (1995) Abramowicz, M. A., Chen, X., Kato, S., Lasota, J.-P. & Regev, O. 1995, ApJ, 438, L37
- Armitage & Reynolds (2003) Armitage, P. J., & Reynolds, C. S. 2003, MNRAS, 341, 1041
- Belloni et al. (2000) Belloni, T., Klein-Wolt, M., Méndez, M., van der Klis, M., & van Paradijs, J. 2000, A&A, 355, 271
- Ebisawa et al. (1994) Ebisawa, K. et al. 1994, PASJ, 46, 375
- Fender et al. (2004) Fender, R. P., Belloni, T. M., Gallo, E. 2004, MNRAS, 355, 1105
- Hawley (2000) Hawley, J. F. 2000, ApJ, 528, 462
- Hawley (2001) Hawley, J. F. 2001, ApJ, 554, 534
- Hirose et al. (2005) Hirose, S., Krolik, J. H., & Stone, J. M. 2005, ApJ in press
- Holt et al. (1975) Holt, S. S., Boldt, E. A., Kaluzienski, L. J., & Serlemitsos, P. J. 1975, Nature, 256, 108
- Homan et al. (2005) Homan, J., Buxton, M., Markoff, S., Bailyn, C. D., Nespoli, E. & Belloni, T. 2005, ApJ, 624, 295
- Ichimaru (1977) Ichimaru, S. 1977, ApJ, 214, 840
- Igmenshchev et al. (2003) Igmenshchev, I. V., Narayan, R., & Abramowicz, M.,A. 2003, ApJ, 592, 1042
- Kato et al. (1998) Kato, S., Mineshige, S., & Fukue, J. 1998, Black Hole Accretion Disks (Kyoto: Kyoto University Press)
- Kato et al. (2004) Kato, Y., Mineshige, S., & Shibata, K. 2004, ApJ, 605, 307
- Kitamoto et al. (1992) Kitamoto, S., Tsunemi, H., Miyamoto, S., & Hayashida, K. 1992, ApJ, 394, 609
- Lasota et al. (1996) Lasota, J.-P., Narayan, R., & Yi, I. 1996, A&A, 314, 813
- Machida et al. (2000) Machida, M., Hayashi, M. R., & Matsumoto, R. 2000, ApJ, 532, L67
- Machida & Matsumoto (2003) Machida, M., & Matsumoto, R. 2003, ApJ, 585, 429
- Machida et al. (2004) Machida, M., Nakamura, K. E., & Matsumoto, R. 2004, PASJ, 56, 671
- Manmoto et al. (1997) Manmoto, T., Mineshige, S., & Kusunose, M. 1997 ApJ, 489, 791
- Matsumoto (1999) Matsumoto, R. 1999, in Numerical Astrophysics, ed. S. M. Miyama, T. Tomisaka, & T. Hanawa, (Amsterdam: Kluwer Academic Publishers), 195
- Mineshige & Wheeler (1989) Mineshige, S., & Wheeler, J. C. 1989, ApJ, 343, 241
- Mineshige et al. (1995) Mineshige, S., Kusunose, M., & Matsumoto, R. 1995, ApJ, 445, L43
- Mineshige (1996) Mineshige, S. 1996, PASJ, 48, 93
- Miyamoto et al. (1991) Miyamoto, S., Kimura, K., Kitamoto, S., Dotani, T., & Ebisawa, K. 1991, ApJ, 383, 784
- Miyamoto et al. (1995) Miyamoto, S., Kitamoto, S., Hayashida, K., & Egoshi, W. 1995, ApJ, 442, L13
- Nakamura et al. (1997) Nakamura, K. E., Matsumoto, R., Kusunose, M., & Kato, S. 1997, PASJ, 49, 503
- Narayan & Yi (1994) Narayan, R., & Yi, I. 1994, ApJ, 428, L13
- Narayan & Yi (1995) Narayan, R., & Yi, I. 1995, ApJ, 444, 231
- Oda (1977) Oda, M. 1977, Space Sci. Rev., 20, 757
- Ohsuga et al. (2005) Ohsuga, K., Kato, Y., & Mineshige, S. 2005, ApJ, 627, 782
- Okada et al. (1989) Okada, R., Fukue, J., & Matsumoto, R. 1989, PASJ, 41, 133
- Paczyński & Wiita (1980) Paczyński, B., & Wiita, P. J. 1980, A&A, 88, 23
- Pariev et al. (2003) Pariev, V., I., Blackman, E. G., & Boldyrev, S. A. 2003, A&A, 407, 403
- Parker (1966) Parker, E. N. 1966, ApJ, 145, 811
- Pringle (1981) Pringle, J. E. 1981, ARA&A, 19, 137
- Remillard (2005) Remillard, R. A. 2005, astro_ph./0504129
- Richtmyer & Morton (1967) Richtmyer, R. D., & Morton, K. W. 1967, Difference Methods for Initial-Value Problems, 2nd ed. (New York: Interscience Publishers)
- Rubin & Burstein (1967) Rubin, E., & Burstein, S. Z. 1967, J. Comp. Phys., 2, 178
- Shakura & Sunyaev (1973) Shakura, N., & Sunyaev, R. 1973, A&A, 24, 337
- Shibata et al. (1990) Shibata, K., Tajima, T., & Matsumoto, R. 1990, ApJ, 350, 295
- Ueda et al. (2002) Ueda, Y. et al. 2002, ApJ, 571, 918
- Yokoyama & Shibata (1998) Yokoyama, T., & Shibata, K. 1998, ApJ, 494, L113
- Zdziarski et al. (2002) Zdziarski, A. A., Poutanen, J., Pasiesas, W. S., & Wen, L. 2002, ApJ, 578, 357
- Zdziarski et al. (2004) Zdziarski, A. A., Gierliński, M., Mikolajewska, J., Wardziński, G., Smith, D. M., Alan Horman, B., & Kitamoto, S. 2004, MNRAS, 351, 791
| Numerical Unit | Physical Unit | |
|---|---|---|
| length | cm | |
| velocity | cm | |
| time | sec | |
| density | g | |
| temperature | K | |
| luminosity | erg |