Accretion and nuclear activity of quiescent supermassive black holes. I: X-ray study
Abstract
We have studied the nuclear activity in a sample of six quiescent early-type galaxies, with new Chandra data and archival HST optical images. Their nuclear sources have X-ray luminosities – erg s-1 (–), and colors or spectra consistent with accreting supermassive black holes (SMBHs)—except for the nucleus of NGC 4486B, which is softer than typical AGN spectra. In a few cases, the X-ray morphology of the nuclear sources shows hints of marginally extended structures, in addition to the surrounding diffuse thermal emission from hot gas, which is detectable on scales kpc. In one case (NGC 5845), a dusty disk may partially obstruct our direct view of the SMBH. We have estimated the temperature and density of the hot interstellar medium, which is one major source of fuel for the accreting SMBH; typical central densities are cm-3. Assuming that the hot gas is captured by the SMBH at the Bondi rate, we show that the observed X-ray luminosities are too faint to be consistent with standard disk accretion, but brighter than predicted by radiatively-inefficient solutions (e.g., advection-dominated acretion flows, ADAF). In total, there are galaxies for which SMBH mass, hot gas density, and nuclear X-ray luminosity are simultaneously known. In some cases, the nuclear sources are brighter than predicted by the ADAF model; in other cases, they are consistent or fainter. We discuss the apparent lack of correlations between Bondi rate and X-ray luminosity, and suggest that, in order to understand the observed distribution, we need to know two additional parameters: the amount of gas supplied by the stellar population inside the accretion radius, and the fraction (possibly ) of the total gas available that is accreted by the SMBH. We leave a detailed study of these issues to a subsequent paper.
Subject headings:
accretion, accretion disks — galaxies: nuclei — galaxies: individual (NGC 821 (catalog ), NGC 3377 (catalog ) NGC 4486B (catalog ), NGC 4564 (catalog ), NGC 4697 (catalog ), NGC 5845 (catalog )) — galaxies: structure — X-ray: galaxies1. Introduction
There is strong evidence that all massive galaxies (not including dwarfs) with a spheroidal component (ellipticals, lenticulars, and early-type spirals with bulges) host supermassive black holes (SMBHs) in their nuclei (Richstone et al. 1998). For a few dozen galaxies, there exist direct determinations of their nuclear masses, either from measurements of spatially-resolved stellar or gas kinematics (for quiescent nuclei) or from ”reverberation mapping” of their broad-line regions (for active nuclei) (Gebhardt et al. 2003; Ferrarese et al. 2001; Ho 2002; Onken et al. 2004; Peterson et al. 2004). The masses of SMBHs correlate well with fundamental properties of their host galaxies: bulge mass (Magorrian et al. 1998), central velocity dispersion (Ferrarese & Merritt 2000, Gebhardt et al. 2000), central light concentration (Graham et al. 2001) and mass of the dark-matter halo (Ferrarese 2002). However, this is not the case for the accreting luminosities of SMBHs: while a few are active (AGN), sometimes with bolometric luminosities close to or above their Eddington limits (Collin et al. 2002; Wang & Netzer 2003), the majority are not. X-ray observations of these “silent” SMBHs have revealed faint sources with X-ray luminosities as low as (Fabbiano & Juda 1997; Ho 1999; Ho et al. 2001; Pellegrini et al. 2003a; Pellegrini 2005; Fabbiano et al. 2003, 2004).
The bolometric luminosity can be expressed as , where is the mass accretion rate and is the efficiency of conversion of gravitational energy into radiation. It is still not clear whether the extremely low luminosity of most SMBHs is primarily due to a low accretion rate, or to a low radiative efficiency (i.e., ); see Narayan (2002) for a review. If it is due to a low accretion rate, we need to determine whether this is caused by a lack of gas available in the inner few pc, or is instead the result of other phenomena (for example accretion disk winds or jets) that may prevent the gas from accreting onto the SMBH.
The most likely explanation appears to be that both low and low play a part. It has become clear that a lack of fuel cannot be a general explanation: many elliptical galaxies do have large supplies of cold/warm interstellar gas at their centers (Caon, Macchetto & Pastoriza 2000; Macchetto et al. 1996). Fabian & Canizares (1988) pointed out that the accretion rate of the hot interstellar medium (ISM) expected from the standard Bondi (1952) model would still be high enough to produce X-ray luminosities at least two orders of magnitude higher than observed in the nuclei of most ellipticals, if accretion occurs efficiently (). Recent high-resolution Chandra observations have led to the measurement of both the nuclear X-ray emission and of the physical parameters of the surrounding hot ISM, greatly strengthening this conclusion (e.g., Pellegrini 2005 and references therein).
Advection of energy into the SMBH (e.g., Narayan & Yi 1994, 1995) is a plausible mechanism for low radiative efficiency, and may be the explanation for many extremely sub-Eddington sources. However, it cannot be the only explanation for all sources, either. For example, advective accretion cannot be invoked to explain some very under-luminous stellar-mass compact objects in our Galaxy (Perna et al. 2003). Low in addition to low has also been suggested as the major reason for the overall faintness of Sgr A* (Bower et al. 2003; Quataert 2003).
Hence, there is now considerable observational evidence that quiescent or very faint SMBHs are at least partly due to low radiative efficiency, and partly to accretion rates onto the compact object lower than predicted from the amount of gas available. However, the physical processes responsible for this reduced accretion rate are still not well understood, and various competing models have been proposed. Hydrodynamical simulations (e.g., Perna et al. 2003, their Sect. 2.3 and references therein) have shown that disk winds and outflows may prevent most of the inflowing gas from reaching the compact object, so that only a small fraction of the available mass is accreted. Another possibility is that convection sets up a barrier to accretion, by increasing the pressure and preventing the gas from falling in supersonically (Narayan, Igumenshchev, & Abramowicz 2000). Alternatively, Tan & Blackman (2005) speculated that efficient cooling inside the Bondi radius causes the infalling gas to condense into stars in a gravitationally unstable disk, instead of sinking into the SMBH.
Another promising scenario is that most of the accretion power is not radiated, but is instead carried away by a steady, relativistic jet, with bulk kinetic luminosity . In some cases (e.g., M 87: di Matteo et al. 2003, IC 4296: Pellegrini et al. 2003b; IC 1459: Fabbiano et al. 2003), it has indeed been shown that including the kinetic energy of the jet reconciles the observed energy budget with the expected accretion rate. If a relativistic jet is present, synchrotron radio emission is also expected. The “fundamental-plane” relation (Merloni, Heinz, & Di Matteo 2003) between the observed radio luminosities, X-ray luminosities, and BH masses supports the hypothesis that inactive SMBHs have low accretion rates as well as low radiative efficiency (), and that most of the accretion power is carried outwards by a steady jet. However, in other cases (e.g., NGC 821: Fabbiano et al. 2004) it is more likely that the accretion power is released in intermittent, short-lived outbursts (Binney & Tabor 1995; Ciotti & Ostriker 2001; Jones et al. 2002; Omma et al. 2004); if that is the case, the relative fraction of SMBHs observed in an active or quiescent state would depend on the duration of the duty cycle. Alternatively, in a few cases the X-ray emission from the SMBH may be absorbed by dust (often found in the inner pc of elliptical galaxies: Rest et al. 2001) and re-emitted in the infrared (IR). Finally, it is still possible that a few luminous elliptical galaxies with partially depleted stellar cores may not have large gas supplies to feed the SMBH. Determining which of these physical processes are at play in quiescent SMBHs will also help us understand and quantify the SMBH feedback onto its host galaxy.
For a sample of 18 nearby galaxies with nuclear X-ray luminosity and Bondi mass accretion rate of hot gas estimated from Chandra data, Pellegrini (2005) found that can vary by orders of magnitude and shows a large scatter when plotted against BH mass or Bondi rate. While in some cases the observed luminosities are consistent with the prediction of advective models, for other nuclear sources the observed luminosities are much lower, and therefore scenarios including outflows or convection are needed. A scenario with feedback from accretion on the surrounding gas was considered the most promising.
1.1. Objectives and targets of our study
To test these scenarios, we chose a further sample of six nearby, quiescent elliptical galaxies with direct SMBH mass determinations, from Gebhardt et al. (2003) and Kormendy et al. (1997). Stringent upper limits on AGN activity exist for all these SMBHs, from radio, optical (Balmer emission lines), and previous X-ray studies (Ho 2002), and from a lack of UV bumps. Our goal is to explore the most extreme cases of sub-Eddington nuclear activity, so we only focused on galaxies with SMBH masses and X-ray luminosity erg s-1. We also excluded galaxies more distant than 30 Mpc.
In five of the six galaxies, the SMBH mass has been accurately determined with three-integral models (Gebhardt et al. 2003)111In three of those five nuclei, the dynamical sphere of influence of the SMBH has been resolved by HST (Merritt & Ferrarese 2001; Ho 2002), making the mass determination more reliable; in the remaining two cases, NGC 821 and NGC 3377, the sphere of influence is not resolved.. The only exception is NGC 4486B, whose mass estimate was based on two-integral models (Kormendy et al. 1997) and is therefore much more uncertain. For example, a revised error range in Kormendy & Gebhardt (2001) allows for masses between and . A mass was quoted as a preliminary result of an ongoing study by Gebhardt (2005, priv. comm.). As a corollary of our study, we have obtained an alternative (indirect) SMBH mass determination for NGC 4486B (Soria et al. 2005 = Paper II), using the –velocity dispersion (Tremaine et al. 2002) and –Sérsic index (Graham et al. 2003, 2005 in prep.) relations. We are aware that the larger mass uncertainty, and its peculiar morphological type, make NGC 4486B somewhat different from the rest of our Chandra targets, among which it was included for historical reasons. Classified as a compact elliptical (cE) galaxy, NGC 4486B may have originated as the bulge of a much larger, tidally stripped disk galaxy (Jerjen & Binggeli 1997; see also Graham 2002).
Our main objective is to determine the energy and mass budget for the nuclear regions of our sample galaxies, and for a few others for which SMBH mass and luminosity are available in the literature. We want to answer three fundamental questions: how much gas is available for accretion? how much energy is radiated by the SMBH? where does the rest of the mass and energy go? Moreover, this may also help to explain why most of the SMBHs in the local universe are very faint or quiescent.
We begin by using Chandra data to investigate the spatial and spectral properties of the nuclear X-ray emission. By comparing the observed X-ray luminosity of the SMBH with the temperature and density of the surrounding gas, we can constrain some of the accretion parameters. In particular, if we could precisely determine the mass accretion rate onto the SMBH, we would find the efficiency. However, a direct measurement of the accretion rate is still beyond today’s observational capabilities, given the characteristic size of SMBH event horizons ( pc). So, we need to turn the problem around. We shall use model predictions for the radiative and non-radiative efficiency (e.g., standard disks, or advective accretion) and compare them with the observed luminosity and gas density available inside the SMBH accretion radii (characteristic size pc). From this, we will infer what fraction of the gas available is really accreted. In Paper I, we shall use Chandra to estimate the hot gas component to the accretion flow; we shall look for correlations between the classical Bondi inflow rate from the hot ISM, and the observed SMBH luminosity. In Paper II, we shall use optical data to determine whether additional sources of fuel (e.g., warm gas from stellar winds) may have been missed by the X-ray study. We shall then discuss the correlation between the total gas accretion rate and the observed SMBH luminosities. Finally, we shall discuss how to balance the mass and energy budget, taking into account total gas injection, accretion onto the SMBH, and outflows.
| Galaxy | Type | d | Obs. Date | Obs. ID | Exp. time | ||
|---|---|---|---|---|---|---|---|
| (Mpc) | (mag) | () | (ks) | ||||
| (1) | (2) | (3) | (4) | (5) | (6) | (7) | (8) |
| NGC 821 | E6 | 2002/11/26 | 4408 | 25.3 | |||
| 2002/12/01 | 4006 | 13.7 | |||||
| NGC 3377 | E5-6 | 2003/01/06 | 2934 | 39.6 | |||
| NGC 4486B | cE0 | 2003/11/21 | 4007 | 36.2 | |||
| NGC 4564 | E6/S0 | 2003/11/21 | 4008 | 17.9 | |||
| NGC 4697 | E6 | 2000/01/15 | 784 | 39.3 | |||
| 2003/12/26 | 4727 | 39.9 | |||||
| 2004/01/06 | 4728 | 35.7 | |||||
| 2004/02/12 | 4729 | 38.1 | |||||
| NGC 5845 | E3 | 2003/01/03 | 4009 | 30.0 |
Note. — Col.(1): see Fabbiano et al. (2004) for a detailed study of NGC 821, and Sarazin, Irwin & Bregman (2001) for the analysis of the first observation of NGC 4697. Col.(2): from the NASA/IPAC Extragalactic Database (NED). Col.(3): from Tonry et al. (2001), except for NGC 4486B, from Neilsen & Tsvetanov (2000). Col.(4): from NED, adopting the distances in Col.(3). Col.(5): from Gebhardt et al. (2003), except for NGC 821 (Richstone et al. 2004), and for NGC 4486B. The latter has two alternative values. The higher mass (in square brackets) is from Kormendy et al. (1997), using a two-integral model. A similar result () was obtained with the same method by Kormendy & Gebhardt (2001). However, the reliability of this value is questionable, both because of the method on which it is based, and because it is uniquely discrepant from the BH mass inferred from all indirect indicators (i.e., the global correlations with stellar velocity dispersion, Sérsic index, bulge mass). The alternative, indirect mass determination was obtained in our Paper II (Soria et al. 2005), from the global correlation between Sérsic index in the optical brightness profile and BH mass (Graham et al. 2003, 2005 in prep.).
2. X-ray Observations and Data analysis
The six elliptical galaxies that are the object of our study (Table 1) were observed with Chandra (Weisskopf et al. 2000) ACIS-S, centered on chip 7 (i.e., ACIS-S3). For one of the galaxies, NGC 4697, we used all 4 observations currently available in the public archive. We analysed the data with the CIAO v3.2 software222http://cxc.harvard.edu/ciao/ for NGC 4697, and with CIAO v3.1 for the other targets; we checked that the difference between the two CIAO versions is negligible for the purposes of this work. We downloaded the bias files for each observations, and built new bad-pixel files333Thread at http://cxc.harvard.edu/ciao/threads/acishotpixels/. We then built new level=1 and level=2 event files with the CIAO script acis_process_events, which includes the application of a time-dependent gain correction to the data. (The time-dependent gain adjustment was not applied to the 2000 observation of NGC 4697, because it was taken with a focal plane temperature different from the normal C). We also improved the astrometric accuracy by calculating and removing the (negligible) aspect offsets, using the CIAO Aspect Calculator444Thread at http://cxc.harvard.edu/ciao/threads/arcsec_correction/. No significant background flares were observed in these data, so no time filtering was necessary. The background level was generally very low except for the observation of NGC 4486B. The energy range was filtered to – keV, with the CIAO task dmcopy. We identified the point sources with the wavdetect task, and for the brightest of them, we extracted their spectra with psextract (which also builds response and auxiliary response files, with the mkrmf/mkarf tasks). After subtracting the discrete sources, we used the CIAO script acisspec to extract the spectra of diffuse emission from extended regions, together with their weighted response files and backgrounds. We then used XSPEC 11.3.1 (Arnaud 1996) for the spectral fitting of point-like and extended sources555http://heasarc.gsfc.nasa.gov/lheasoft/xanadu/xspec/.
3. Results
We focus in particular on the new results for NGC 3377, NGC 4486B, NGC 4564 and NGC 5845. The remaining two galaxies have already been studied in detail (NGC 821: Fabbiano et al. 2004; NGC 4697: Sarazin et al. 2001): here we re-analyse and discuss their nuclear X-ray properties in the context of our new sample of massive, quiescent elliptical galaxies. In particular, for NGC 4697 we use both the 2000 Chandra observation that was studied by Sarazin et al. (2001), and three more recent observations that became public in early 2005.
| Galaxy | ACIS-S Net Counts | ACIS-S Count Rates ( s-1) | ||||||
|---|---|---|---|---|---|---|---|---|
| – keV | – keV | – keV | – keV | – keV | – keV | – keV | – keV | |
| NGC 821 (core) | not detected | |||||||
| NGC 821 (“jet”) | ||||||||
| NGC 3377 | ||||||||
| NGC 4486B | ||||||||
| NGC 4564 | ||||||||
| NGC 4697 (1) | ||||||||
| NGC 4697 (2) | ||||||||
| NGC 5845 | ||||||||
Note. — The values for NGC 821 are from the combined 2002 Nov/Dec observations; see Fabbiano et al. (2004) for details on the definition of the jet-like nuclear feature as opposed to a point-like (non-detected) core. The first line for NGC 4697 is from the 2000 Jan observation, and the second is for the combined 2003 Dec–2004 Feb observations; the reduction in count rate is due to the degraded performance of ACIS-S.
3.1. Morphology of the nuclear X-ray sources
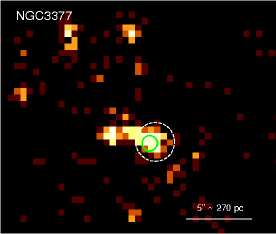
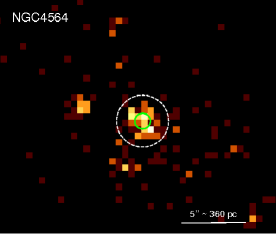
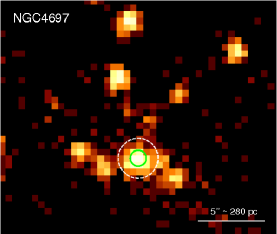
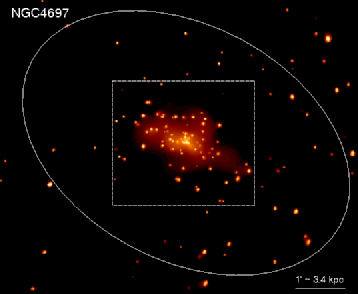
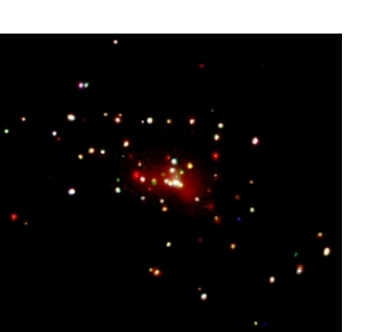
In all six galaxies we detect X-ray emission at and around the nuclear position. In five cases (all except NGC 821, see Fabbiano et al. 2004), the centroid of the nuclear X-ray source coincides with the optical/IR nucleus identified in the Two-Micron All Sky Survey (2MASS) and United States Naval Observatory (USNO) Catalogues, within the astrometric accuracy of Chandra (the uncertainty circle has a radius of ). For NGC 4697, relative astrometry with an accuracy better than can be obtained, because a few non-nuclear X-ray sources have point-like optical counterparts (globular clusters).
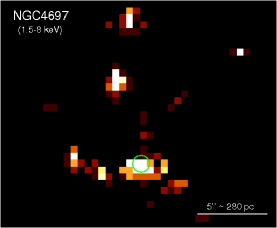
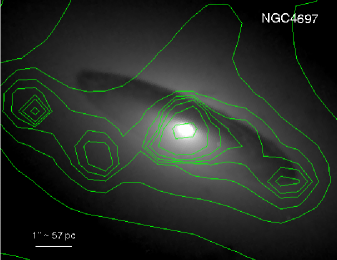
Firstly, we analyzed the morphology of the nuclear X-ray sources to determine whether they are consistent with point-like emission from the SMBH or are instead extended. From the theoretical ACIS-S3 point spread function and from our fitting of other point sources detected in the central region of the chip, we expect a Gaussian FWHM for a point-like source in the – keV energy band. The (weak) nuclear source of NGC 4486B is consistent with being point-like (FWHM ), implying a size pc; it is also well isolated: no other X-ray sources are detected in that galaxy. The nuclear source in NGC 4697 (Figure 1, bottom left) is also point-like (size pc) but is located in a region with high source density, with at least another 5 point-like sources detected within a radius of pc. Their spatial distribution around the nuclear source is probably a chance grouping of X-ray binaries in the galactic bulge.
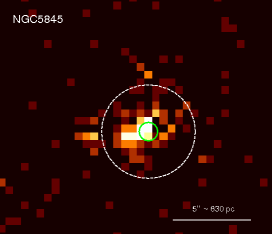
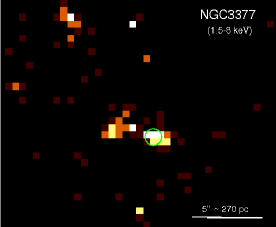
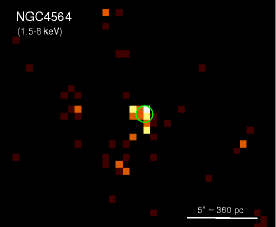
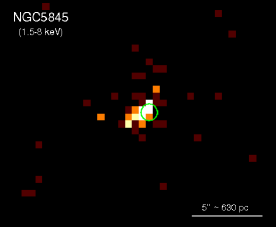
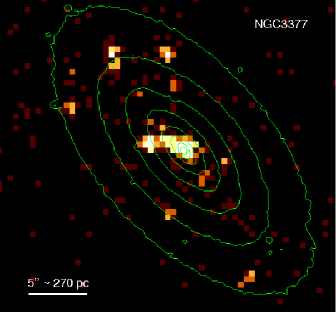
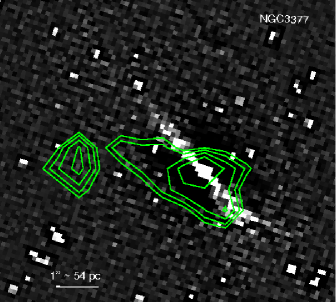
The nuclear source of NGC 4564 (Figure 1, top right) has a FWHM pc in the – keV band; therefore, it is probably extended. In the remaining three galaxies, NGC 3377, NGC 5845 and NGC 821, structure in the nuclear region is more clearly visible. In NGC 5845 (Figure 1, bottom right), the nuclear emission has an irregular, “fuzzy” appearance over a region pc across. In the other two galaxies, NGC 821 and NGC 3377, the emission has instead an elongated, “jet-like” appearance. In NGC 3377 (Figure 1, top left), an elongated feature seems to link the nuclear source with another, fainter source located pc to the East. For a discussion of the elongated substructure in the nucleus of NGC 821, see Fabbiano et al. (2004). Limiting our imaging study to the – keV band (Figure 2), we still find some extended structure in NGC 5845.
3.2. X-ray colors and spectra of the nuclear sources
We extracted X-ray spectra of the nuclear sources, using the extraction regions plotted in Figure 1 (dashed white circles); the background regions were chosen as annuli around the nuclear sources, and we took care of excluding nearby sources. For NGC 4697, we extracted separate spectra for the four observations. For some tasks, it is possible and convenient to coadd the 2003 Dec–2004 Feb observations and study them together; however, the analysis of the first dataset (2000 Jan) has to be carried out separately because of the ACIS-S sensitivity degradation, particularly at lower energies, over those four years.
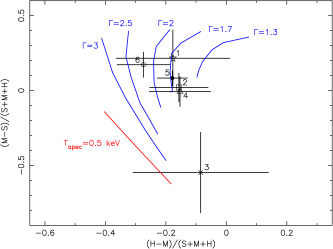
Firstly, we compared the broad-band X-ray colors (Table 2), before introducing any spectral modelling. In five of the six nuclear sources, the X-ray colors are consistent with typical AGN spectra, a power-law spectrum of index – (Figure 3). The only exception is NGC 4486B, which has softer colors, with most of the counts detected below 1 keV, although the errors are large because of the relatively high background level and the small number of counts.
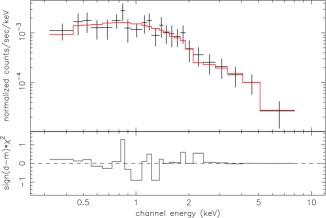
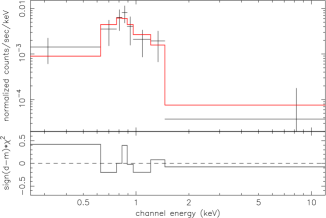
We then estimated the emitted fluxes and luminosities by assuming an absorption column density equal to the Galactic line-of-sight (Table 3; from Dickey & Lockman 1990). The color-color diagram (Figure 3) and the X-ray spectra (at least for the nuclear sources with enough counts) justify this assumption, suggesting that the total column density is not much higher than the Galactic value; hence, we are only slightly underestimating the emitted luminosities. We fitted the (ungrouped) spectra with an absorbed power-law (Table 3), using the Cash statistic (Cash 1979)666This statistic can be used in the same way as the statistic to find confidence intervals. One finds the parameter values that give C Cmin N, where N is the same number that gives the required confidence for the number of interesting parameters as for the case (Arnaud 1996). See the XSPEC manual for details.. We also grouped the same spectra to achieve a minimum signal-to-noise ratio of in each spectral bin, and fitted them with the statistics (Table 3). For sources with a very limited number of counts, we consider the results based on the Cash statistic to be more reliable. For NGC 4697, we increased the signal-to-noise ratio by coadding the spectra from 2000 and 2003–2004, using the algorithm of Page, Davis & Salvi (2003), which generates a count-weighted average of their response matrices (Figure 4). From a power-law fit (Table 3) we calculate an emitted luminosity erg s-1 in the – keV band; we also checked that there are no significant spectral or luminosity changes between the two epochs. The emitted luminosities of the nuclear sources in the other five galaxies are between and erg s-1, in the same band (Table 3).
For NGC 4486B, we have also tried fitting the nuclear source with a thermal-plasma model, to account for the possibility that it is a very compact patch of thermal emission from the ISM. We obtain a best-fit keV, but the fit is statistically worse (C-statistics ) than for the power-law model (C-statistics ). Henceforth, we shall assume for this work that most of the X-ray emission comes from the SMBH.
| Galaxy | Galactic aafrom Dickey & Lockman 1990. | Photon index | Normalization at 1 keV | /dof | bbEmitted luminosity inferred from the spectral fit. |
|---|---|---|---|---|---|
| ( cm-2) | ( ph. keV-1 cm-2 s-1) | ( erg s-1) | |||
| NGC 821 (“jet”) | |||||
| NGC 3377 | |||||
| NGC 4486BccFitted with Cash statistics only. | |||||
| NGC 4564 | |||||
| NGC 4697ddFitted with the statistics. | |||||
| NGC 5845 | |||||
3.3. Scattering and obscuration of the nuclear SMBH?
The nuclear X-ray source in NGC 5845 appears extended on the scale of a few hundred pc, larger than the FWHM of the Chandra/ACIS PSF for a point source (Section 3.1). The count rate is insufficient to map the X-ray colors or the spectral properties across the nuclear region. However, we can at least say that the “fuzzy” emission around the nuclear position is not significantly softer than a typical AGN-like power-law spectrum: the emission is extended even in the hard band (– keV). The simplest explanation is that the emission is due to a few faint, unresolved LMXBs in the inner region. If that was the case, the true luminosity of the SMBH in NGC 5845 would be a few times lower than estimated in Table 3.
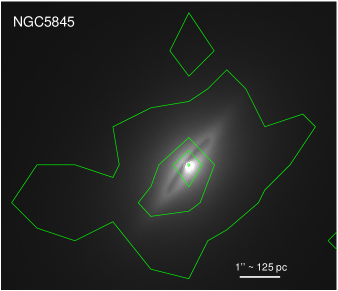
Alternatively, we note that the X-ray morphology is reminiscent of the extended X-ray emission associated with obscured Seyfert nuclei (for NGC 4151: Elvis, Briel & Henry 1983; Elvis et al. 1990; Ogle et al. 2000; for NGC 1068: Ogle et al. 2003), which is understood as scattered nuclear emission. Dust is known to be present in the nuclear region of most ellipticals, especially those with disky isophotes (van den Bosch et al. 1994; Kormendy et al. 2005 and references therein). The nuclear region of NGC 5845 contains a dusty disk of radius pc (Quillen, Bower & Stritzinger 2000), i.e. an order of magnitude larger than the Bondi accretion radius. In fact, NGC 5845 is one of only two galaxies known for containing both a dust disk and an associated, nuclear stellar disk (the other one is NGC 4486A). It has been suggested (Kormendy et al. 2005; Kormendy et al. 1994) that, as cold gas and dust settle towards the center, they form stars and build a stellar disk.
In NGC 5845, the disk is seen almost edge-on (Figure 5). Thus, it is possible that most of the direct X-ray emission from the SMBH along our line of sight is obscured by dust, and most of the observed, extended emission comes from the surrounding photo-ionized plasma which is scattering the nuclear continuum. If this was the case, the true SMBH luminosity in NGC 5845 could instead be at least an order of magnitude higher than estimated in Table 3. Given the apparent thin-disk geometry of the dusty feature (Figure 5), we may expect that the disk/torus can intercept and re-radiate in the far-infrared a fraction – of the bolometric luminosity. If the far-infrared nuclear luminosity erg s-1, it is potentially detectable by Spitzer (flux density mJy in the Spitzer/MIPS bands). This will be investigated in a follow-up work, for which Spitzer time has already been obtained. For the present paper, we assume that the observed X-ray luminosity of the SMBH in NGC 5845 is a good approximation of the emitted luminosity.
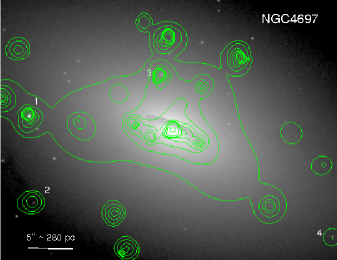
A dusty disk or torus of outer radius pc is also apparent in the nuclear region of NGC 4697 (Figure 6). However, obscuration or scattering of the central X-ray source may not be as significant as in NGC 5845 because our viewing angle is . A more detailed investigation of the physical processes at work in a dusty nuclear disk is beyond the scope of this paper.
3.4. Jet-like features
The morphologies of the X-ray emission in the nuclear regions suggest possible jet-like features in two of our target galaxies, NGC 821 and NGC 3377. The former was discussed in Fabbiano et al. (2004), who suggest that the X-ray flux is consistent with synchrotron emission in a jet, or with hot thermal plasma shocked by intermittent nuclear outbursts. For NGC 3377, we compared the Chandra image with an archival HST/WFPC2 image in the F555W filter, to determine whether the elongated feature in the X-ray image has an optical counterpart; however, we do not see any obvious distortions in the optical isophotes (Figure 7, top panel).
We then searched for possible fainter optical signatures in the nuclear region of NGC 3377. We determined the mean 2-D surface brightness distribution of the central region of NGC 3377 with the help of a boxcar pixel-smoothing technique and an isophotal fitting routine written in IRAF. Both techniques were recently employed to uncover spiral and bar structures in seemingly normal dwarf elliptical galaxies in the Virgo (Jerjen, Kalnajs & Binggeli 2000; Barazza, Binggeli & Jerjen 2002) and Coma clusters (Graham, Jerjen & Guzmán 2003). The reconstructed model galaxy is subtracted from the original, leaving just the small-scale substructures in the residual image. The result for NGC 3377 derived in this manner is shown in the bottom panel of Figure 7: we find a small, brighter stellar disk but no feature corresponding to the X-ray elongation, neither parallel not perpendicular to the disk plane.
None of the six galaxies in our sample have significant radio detections; however, five have at least reliable upper limits to their radio-core emission, from VLA observations. In NGC 821, the radio-core flux at 5 GHz is mJy (Wrobel & Heeschen 1991); in NGC 3377, NGC 4697 and NGC 5845, the radio flux at 8.4 GHz is mJy (Krajnovic & Jaffe 2002). In NGC 4564, the upper limit is mJy at 8.4 GHz (Wrobel & Herrnstein 2000); however, the core is marginally detected at the level of mJy at 1.4 GHz, in the NRAO/VLA Sky Survey. A comparison of radio and X-ray nuclear fluxes is discussed in Paper II.
4. X-ray emitting, diffuse gas
4.1. X-ray brightness profiles
Unresolved X-ray emission in elliptical galaxies is a combination of faint low-mass X-ray binaries (LMXBs) and hot gas, with – keV (Trinchieri & Fabbiano 1985; Blanton, Sarazin & Irwin 2001; Sivakoff, Sarazin & Irwin 2003; Randall, Sarazin & Irwin 2004). In this work, we focus on the nuclear BH activity and do not set out to study the X-ray source population and large-scale structure of the galaxies. However, we still need to investigate the diffuse hot gas component, because it provides a constraint to the energy budget of the nuclear BH. From the surface brightness and temperature of the diffuse emission, we can in principle estimate the density of the hot gas in the nuclear region; hence, we can obtain a lower limit to the gas density available for accretion onto the BH, which can be compared to the observed luminosity, to constrain the accretion efficiency.
To obtain the surface brightness of the unresolved emission (and, in particular, the thermal gas component), firstly we filtered the event files to remove the point sources detected with wavdetect. In the case of NGC 4697, we combined all four observations to reach a deeper detection limit for the point sources; then we analysed the unresolved emission separately for the 2000 and 2003–2004 datasets. For each galaxy, we created a stack of concentric annular regions extending up to from the nucleus, and a background annulus outside this region. We used the CIAO task dmextract to obtain the background-subtracted radial profiles. Since we are only interested here in the diffuse gas contribution, we restricted the energy range to – keV, where the hot thermal plasma component is relatively stronger, compared with the unresolved LMXB contributions. Above keV, the hot gas component is, instead, negligible, and the unresolved emission is dominated by the power-law LMXB component.
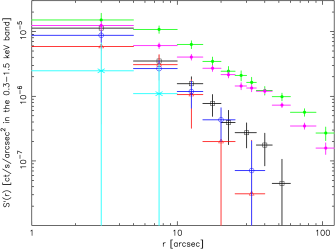
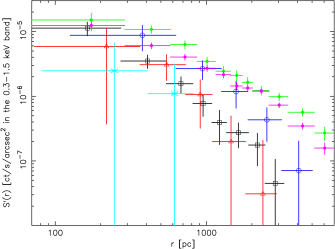
To determine the physical properties of the extended X-ray emission, we need to measure the radial profiles of the gas surface brightness , and the central surface brightness (a distance-invariant quantity). The surface brightness does not come directly from the observations: what we have instead is the surface density of the count rates in the - kev band, for the total unresolved emission, including contributions from both the interstellar gas and faint LMXBs. We show for five of the six galaxies in our sample (Figures 8, 9). The strongest emission is found in NGC 4697 (Figure 10; see also Sarazin et al. 2001). On the other end, no unresolved emission is detected in NGC 4486B, though the relatively higher background level of that observation makes it more difficult to obtain a tight upper limit. To calculate the density of the hot gas, we need to convert the observed count rates into physical flux units, and to estimate what fraction of the unresolved emission is due to diffuse gas. This requires a spectral analysis.
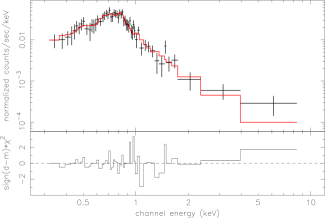
Only two galaxies (NGC 4697 and NGC 3377) have enough detected counts in the unresolved X-ray emission to allow for spectral fitting. After excluding the discrete sources found by wavdetect, we used the CIAO script acisspec to extract the spectrum of the unresolved emission from a circle, taking an annulus between and as background region. For NGC 4697, we extracted separate spectra (with their respective response files) for the 2000 and 2003–2004 observations; we then combined the two spectra using the algorithm of Page et al. (2003). We fitted the spectra in XSPEC, assuming an absorbed power-law plus a single-temperature thermal plasma model, wabs*(vapec + po). First, we fixed the absorption column density to the Galactic value, the metal abundance of all elements to the solar value, and the photon index of the power-law component to (average value for LMXBs), to reduce the number of free parameters (Tables 4, 5). This already produces a good fit () As previously noted (ROSAT study: Pellegrini & Fabbiano 1994; Chandra study: Sarazin et al. 2001), the interstellar gas in NGC 4697 is cooler ( keV) than is usually found in X-ray bright ellipticals; this may be the consequence of a shallow gravitational potential. We further improved the fit by varying the metal abundances of the main elements: we find that an overabundance of C and N over the elements by a factor of – significantly reduces the below 1 keV. No significant Mg or Si lines are detected (Figure 11), an indication that the X-ray emitting gas may not be strongly metal-enriched from Type-II SNe. The gas in NGC 3377 is consistent with a higher temperature ( keV), although the uncertainty is larger, due to the limited number of detected counts (only ; Figure 12). There are not enough counts to vary the metal abundances.
By fitting a spectral model to the unresolved X-ray emission, we can estimate the conversion factors between the observed count-rate density (units of counts s-1 arcsec-2 in a specific band), and the bolometric surface brightness of the diffuse hot gas. For the spectral model fitted to NGC 3377, we obtain a conversion factor of count s-1 arcsec-2 in the – keV band erg cm-2 s-1 arcsec-2; of the unresolved counts in the – keV band are from truly diffuse emission. This is an average value over the whole extraction region; in fact, the diffuse emission may be more centrally peaked (Kim & Fabbiano 2003). For the 2000 observation of NGC 4697, count s-1 arcsec-2 erg cm-2 s-1 arcsec-2; in 2003–2004, count s-1 arcsec-2 erg cm-2 s-1 arcsec-2 (this difference is due to the decrease in sensitivity of the detector); of the unresolved counts are from hot gas. The total emitted luminosity from the hot gas is erg s-1 in NGC 3377 and erg s-1 in NGC 4697.
We can use these values to estimate the conversion factors for the other galaxies in our sample, for which we cannot do any spectral analysis. We can safely assume that the temperature of the hot ISM is in the range – keV. The relative contribution of hot gas and LMXB emission varies from galaxy to galaxy (see a discussion in Kim & Fabbiano 2003); our choice of a soft energy band (– keV) should reduce the uncertainty caused by LMXB contamination. The conversion factor between unresolved count rate and flux of the truly diffuse emission depends strongly on the detection threshold of the point sources: we used NGC 4697 to estimate this effect. When the point-source detection limit is erg s-1, we find that of the unresolved counts in the – keV band are from the ISM, as mentioned earlier; for a detection limit of erg s-1; and only for a detection limit of erg s-1. In conclusion, taking into account these arguments, we adopt a conversion factor between count-rate surface density and bolometric surface brightness of count s-1 arcsec-2 in the – keV band erg cm-2 s-1 arcsec-2 from the hot gas, for NGC 4564 and NGC 5845.
| Parameter | Model 1 | Model 2 |
| Value | Value | |
| aaFrom Dickey & Lockman (1990). | ||
| bbFixed to the typical LMXB value of 1.7. | ||
| at 1 keVccUnits of ph. keV-1 cm-2 s-1. | ||
| (keV) | ||
| ddApec/vapec model normalization , where is the angular size distance to the source (cm), is the electron density (cm-3), and is the hydrogen density (cm-3). | ||
| /dof | ||
| eeTotal unabsorbed luminosity of the unresolved emission in the – keV band; units of erg s-1. | ||
| ffTotal unabsorbed luminosity of the unresolved emission in the – keV band; units of erg s-1. | ||
| ggUnabsorbed luminosity of the diffuse thermal-plasma component in the – keV band; units of erg s-1. |
| Parameter | Value |
|---|---|
| aafixed to the Galactic line-of-sight value, units of cm-2; from Dickey & Lockman (1990). | |
| at 1 keV | |
| (keV) | |
| /dof | |
| Galaxy | Det. limit | Counts | ||||||
|---|---|---|---|---|---|---|---|---|
| (erg s-1) | (– keV) | (ct s-1 arcsec-2) | (erg cm-2 s-1 arcsec-2) | (arcsec) | (pc) | (cm-3) | ||
| N821aaSee Fabbiano et al. 2004. | Too faint for spatial analysis | |||||||
| N3377 | ||||||||
| N4486B | No significant detection of unresolved emission | |||||||
| N4564 | ||||||||
| N4697bb2000 Jan observation. | ccDetection limit for the point sources from all datasets combined. | |||||||
| N4697ddCombined 2003–2004 observations. | ccDetection limit for the point sources from all datasets combined. | |||||||
| N5845 | ||||||||
4.2. Density of the hot ISM
The gas surface brightness is the projection on the sky of the plasma emissivity where is the gas electron density and the cooling function at a gas temperature . We can obtain the gas density by de-projecting the surface brightness, if we know the radial dependence of . The problem can be simplified by assuming that the temperature is constant, and that the radial profile of the surface brightness can be parameterized with isothermal -models (Cavaliere & Fusco-Femiano 1976, 1978) of the form:
| (1) |
where the fitting parameters are (central surface brightness), (core radius) and . Physically, it can be shown that where is the stellar velocity dispersion (e.g., Ettori 2000 and references therein). In this approximation, one can derive an analytical expression for the density profile (Ettori 2000):
| (2) |
where
| (3) |
In equation 3, is the gamma function, and the central surface emissivity (luminosity per unit surface area of the emitter, units of erg s-1 cm-2) is simply related to the central surface brightness (received flux from a unit angular element on the sky, units of erg s-1 cm-2 arcsec-2) by a constant geometrical factor777To obtain this conversion factor, recall that the area of an element of sky seen under a solid angle of arcsec2 corresponds to a physical size of cm2, where is the distance to the source. The flux received from a unit angular element of sky is times the luminosity emitted from the same unit angular element, or times the luminosity emitted from a unit surface area of the source. Inverting this relation gives the numerical factor between surface emissivity and surface brightness used in the text., .
In the case of hot gas in elliptical galaxies, the gas temperature varies at most by a factor over the extent of the diffuse emission (e.g., Sivakoff, Sarazin & Carlin 2004; Sivakoff et al. 2003), while the gas density can vary by a few orders of magnitude. Hence, taking into account the limited number of detected counts, we can accept the isothermal model as a good approximation for our case. We have now all the elements to determine the radial density profile and central density from equations 1–3, in the isothermal -model approximation. For each galaxy, we use the surface brightness profile inferred from the count rates of the unresolved emission, as described earlier, together with the cooling function from Sutherland & Dopita (1993). The results are given in Table 6, and the inferred radial profiles of the electron density (equation 2) are plotted in Figure 13.
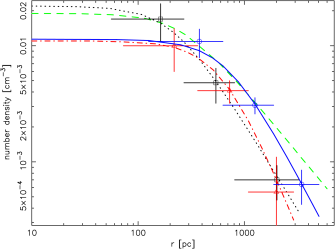
The above method for the deprojection of the surface brightness is based on the assumption of a specific analytic form for the radial profile (-model). It is also possible to obtain an estimate of the density profile without assuming any models, using an onion-skin approach888An onion-skin approach consists in dividing the observed region into concentric shells, projected as concentric annuli on the sky. The problem is solved from outside in. From the measured average temperature and luminosity of the gas in the outermost annulus, one calculates the average gas density in the outermost shell. The observed emission from the second annulus is given by emission from the second shell, plus some emission from the fraction of the outermost shell projected in front of it; the latter component is by now known, and can be subtracted. And so on, until the innermost annulus, whose emission comes from the innermost shell plus all other shells projected in front of it. together with the best-fit emission measure from the fitted spectral model in XSPEC (recalling that ). We did so for three galaxies in our sample999in NGC 4697, the diffuse emission extends to much larger distances; hence this onion-skin method would give meaningful results only by using a larger number of shells. A more detailed analysis of the radial profile of the diffuse emission in NGC 4697 is beyond the scope of this work, which focuses on the central gas density; see also Sarazin et al. (2001).: we defined three concentric shells, including the whole surface where diffuse emission is detected (i.e., to a radial distance of ), and calculated the average count rate and luminosity from each one. From the best-fit emission measure, we then inferred the average gas density in the three shells. The results are in agreement with the -model estimates (Figure 13), implying gas densities – cm-3 at pc from the SMBH.
Estimating the hot-gas density in the two remaining galaxies (NGC 821 and NGC 4486B) is more difficult, because of the limited number of photons. For NGC 821, an average density cm-3 was determined in Fabbiano et al. (2004). However, this value was estimated over a region of radius , excluding the point sources. Therefore, it underestimates the central density. By scaling this value in analogy with the density profiles inferred for the other four galaxies, we estimate that it corresponds to central densities cm-3 (i.e., ). For NGC 4486B, a central density cm-3 is the upper limit.
For the typical values of ISM temperature and density in our target galaxies, the characteristic radiative cooling timescale inside is yr, in the absence of external heating. In fact, both Type-Ia SNe and feedback from the SMBH are possible heating sources, as we shall discuss in Section 6.2. The radiative cooling timescale is much longer that the accretion timescale ( free-fall timescale), which is yr within the sphere of influence of the SMBH (defined as in Section 4.3).
4.3. Bondi inflow rate of hot gas
From the hot-gas density (determined in Section 4.2), we can estimate the accretion rate onto a point-like mass within a uniform gas, in the standard model of steady, spherically symmetric accretion (Bondi 1952; Frank, King & Raine 2002; Ruffert & Arnett 1994):
| (4) |
where is the polytropic index (), is the sound speed of the gas, is the proton mass, is the mean mass per particle of gas. We take (solar composition) and for consistency with Pellegrini (2005). For the gas temperature and density “at infinity” we take their values at the Bondi accretion radius , which defines the region inside which the gravitational pull of the SMBH dominates over the internal thermal energy of the gas. Henceforth, we shall refer to this region simply as the SMBH “sphere of influence” 101010It is also possible to define a dynamical sphere of influence, with a radius , where is the stellar velocity dispersion. In practice, the two definitions are very similar for this class of systems, because the stellar velocity dispersion thermal velocity of virialized hot gas..
A spherically-symmetric model is probably not applicable to the behaviour of the accretion flow very close to the SMBH (e.g., Frank et al. 2002; Krumholz, McKee & Klein 2005, 2006); however, we can still take the Bondi rate from equation (4) as a first-order approximation of the rate at which the hot ISM is captured by the sphere of influence of the BH, at . As we shall discuss later, not all of the inflowing, hot gas reaches the BH, and, conversely, there are other sources of gas inside .
We can more usefully express the accretion radius and Bondi rate as:
| (5) |
| (6) | |||||
The numerical values for our target galaxies are listed in Table 7, Cols. 3,4,5 For the hot gas phase, we used a temperature of keV for NGC 821 (Fabbiano et al. 2004), keV for NGC 3377, keV for NGC 4697, and keV for the other two galaxies with a detected hot-gas component.
4.4. Is the central gas density underestimated?
The hot-gas densities inferred from the deprojection of the diffuse X-ray emission in our target galaxies are comparable (though, on the lower end) with those found in Pellegrini’s (2005) sample (– cm-3) and with the hot-gas density recently estimated for NGC 3379 ( cm-3: David et al. 2005). There are only two nearby galaxies for which the accretion radius has been clearly resolved from Chandra images. For the Milky Way (), the hot gas density cm-3 (Baganoff et al. 2003; Quataert 2003; Cuadra et al. 2005). For M 87 (), the central density is cm-3 (Di Matteo et al. 2003). Four more galaxies have accretion radii : in M 31, a central density cm-3 has been estimated (Garcia et al. 2005; Dosaj et al. 2002); cm-3 in the center of NGC 5128 (Evans et al. 2004; Kraft et al. 2003); cm-3 for the Sombrero galaxy (Pellegrini et al. 2003a); and cm-3 for NGC 4649 (Soldatenkov, Vikhlinin & Pavlinsky 2003).
Our target galaxies are slightly more distant and/or less massive, and, as a result, their accretion radii are not resolved. The observed radial profiles provide a good estimate of the gas distribution at distances pc; however, we do not have any direct measurements at smaller radii (Figures 9, 13), because of a lack of spatial resolution. If we want to determine the amount of gas available for accretion inside the sphere of influence of the SMBH, we need to estimate the density at radii pc. If models are a good approximation, the presence of a core implies that the density stays approximately constant inside the inner pc, making this task easier. But we cannot a priori rule out the possibility that the gas density distribution has a cusp in the nuclear region, for example in correspondence of a massive star cluster, or because cooling gas has accumulated there. Although we cannot resolve the nuclear gas emission in the Chandra images, we know that it does not dominate the point-like nuclear sources, which have harder, AGN-like spectra (see, e.g., the X-ray colors in Figure 3). A conservative constraint is that the thermal emission inside pc has an X-ray luminosity erg s-1. For typical emissivities corresponding to temperatures – keV, this gives an order-of-magnitude constraint on the “true” central density cm-3 for the five target galaxies in which hot gas is found.
Moreover, the hot, X-ray emitting ISM may represent only a small fraction of the gas in the inner region. That can be the case in systems where gas can cool efficiently (cooling timescale accretion timescale), or, vice versa, if gas is injected into the inner regions in a cool or warm phase (for example, through stellar winds) and is accreted before it has time to virialize. Cool and warm gas would of course elude an X-ray investigation. Therefore, the Bondi inflow rate of the hot-ISM component into the sphere of influence of the SMBH represents a firm lower limit to the total gas mass available for accretion. We shall compare the SMBH luminosity expected for gas accretion at the Bondi rate, in the case of a radiatively-efficient inflow (standard disk, Shakura & Sunyaev 1973) and for radiatively inefficient solutions. Conversely, we shall also estimate the accretion rate (expressed as a fraction of the Bondi rate) required to explain the observed luminosities, if we assume a radiatively-inefficient scenario. In Paper II, we shall provide a complementary estimate of the gas injection rate into the SMBH sphere of influence, based on optical studies of the stellar population inside the accretion radius, following the example of Fabbiano et al. (2004).
5. Discussion
5.1. Accretion rates and efficiencies
Let us define a total accretion power , where is the total accretion efficiency (radiative plus mechanical), and is the rate at which matter actually accretes onto the BH. One immediate objective of our analysis is to determine whether derived from X-ray observations of hot gas is a good tracer of . The efficiency , with its exact value depending on the physics of the accretion flow as well as on the BH spin parameter; more generally, we shall talk of “efficient” accretion when . We then define a bolometric luminosity , where is the radiative efficiency. In general, it is where is the fraction of the accretion power released as radiation. In standard accretion models, e.g., for an accretion disk extended down to the innermost stable orbit around the BH, ; however, it is possible that if most of the accretion power is released, for example, in a jet. Finally, only a fraction of the bolometric luminosity is emitted in the Chandra X-ray band, – keV; for accreting SMBHs in typical AGN, (Elvis et al. 1994; Ho 1999). We shall also define a dimensionless accretion rate , so that
| (7) |
Similarly, we define .
From the Chandra observations, the X-ray luminosity of the nuclear sources in our target galaxies is extremely sub-Eddington: – (Table 7). From the estimated densities of the hot ISM, we infer dimensionless Bondi accretion rates (Table 7).
Followig the example of previous studies (e.g., Pellegrini 2005), we can compare the observed X-ray luminosities with the inferred Bondi inflow rates. For the nuclei of our target galaxies, the X-ray observations imply the following constraint:
| (8) |
(Table 7, Col. 8). Theoretical arguments and observational evidence in a variety of accreting galactic nuclei suggests that varies at most within a factor of –. The crucial problem is to constrain the other three parameters (, and ) in equation (8), to make them consistent with the observed SMBH luminosities. This will be a test for the predictions of different accretion scenarios. We shall take into account both our new sample of six galaxies, and another eighteen galaxies for which Bondi rates and SMBH luminosities have been measured or constrained (Pellegrini 2005; Garcia et al. 2005; David et al. 2005).
| Galaxy | |||||||||
|---|---|---|---|---|---|---|---|---|---|
| () | (arcsec/pc) | ( yr-1) | (erg s-1) | () | |||||
| (1) | (2) | (3) | (4) | (5) | (6) | (7) | (8) | (9) | (10) |
| N821 | |||||||||
| N3377 | |||||||||
| N4486B | |||||||||
| N4564 | |||||||||
| N4697 | |||||||||
| N5845 |
Note. — Col.(1): galaxy ID. NGC 4486B is listed twice: the first line (in square brackets) assumes the mass of Kormendy et al. (1997); the second line assumes the lower mass indirectly derived in our Paper II. Col.(2): SMBH mass, see Table 1. Col.(3): accretion radius, from equation 5. Col.(4),(5): Bondi inflow rates estimated from the density and temperature of the diffuse hot ISM. Col.(6),(7): unabsorbed X-ray luminosity of the nuclear source, in the – keV band. Col.(8): comparison between observationally-determined X-ray luminosity and bolometric luminosity expected from standard, radiatively-efficient accretion. Col.(9): prediction for the – keV luminosity for an ADAF accretion flow, with a viscosity parameter ; values were suitably rescaled from the fit of Merloni et al. (2003), using an accretion rate , as expected for an ADAF scenario. Col.(10): accretion rates required to satisfy the observed (unabsorbed) X-ray luminosities, as a fraction of the Bondi inflow rate of hot gas.
5.2. Advective solutions (ADAF)
Standard disk accretion predicts , and . This is ruled out by the observations: if the gas available were efficiently accreted at the Bondi rate, we would expect X-ray luminosities – times higher than observed in our target galaxies. Moreover, there is a theoretical reason why we expect standard accretion to be ruled out: in the limit of low accretion rates (), the accretion flow cannot cool efficiently within the infall timescale; therefore, most of the gravitational energy is carried by the ions (protons and nuclei) and advected into the BH, rather than being transferred to the electrons and radiated away. This regime is known as Advection-Dominated Accretion Flow (ADAF, Narayan & Yi 1994; Ichimaru 1977).
In the simplest, self-similar ADAF model, the luminosity (Narayan & Yi 1994), where is the dimensionless viscosity parameter, with ; a value is typically assumed for galactic SMBHs. This corresponds to a radiative efficiency . A more rigorous calculation (Merloni et al. 2003), taking into account synchrotron and inverse-Compton contributions, indicates that the X-ray luminosity . In the parameter range of our study, the two estimates agree within a factor of 3. Moreover, in the ADAF scenario, the radial inflow velocity inside the Bondi radius is only . For a fixed hot-gas density and temperature at infinity, this implies that a more accurate estimate of the accretion rate is (Narayan 2002).
Using the ADAF values of efficiency and accretion rate (from suitable rescalings of the Merloni et al. 2003 model fit), we estimated the – keV luminosity predicted by the advective model for our target galaxies (Table 7, Col. 9). Conversely, we also determined the accretion rates that would be required to reproduce the observed luminosities, at an assumed ADAF-like efficiency (Table 7, Col. 10). We find (Table 7 and Figure 14) that, at an accretion rate (as predicted by the ADAF model), the SMBH luminosities are underestimated by a factor of 10 (for NGC 4697) and by three to four orders of magnitude for the other five galaxies. Conversely, we find that accretion rates – are required to reproduce the observed luminosities, at an ADAF-like efficiency. In particular, an accretion rate suffices to explain the X-ray luminosity of NGC 4697, but rates are required for the other five galaxies. If the hot-ISM inflow was the only source of gas, such a high accretion rate would be difficult to reconcile with the ADAF prediction. We take this finding as a strong indication that, for our target galaxies, the gas available for accretion has been underestimated: there are other sources of fuel for the SMBH, such as stellar winds, that could be more significant than the Bondi inflow; this would explain why we infer . We shall discuss this scenario in detail in Paper II (see also Fabbiano et al. 2004; Pellegrini 2005).
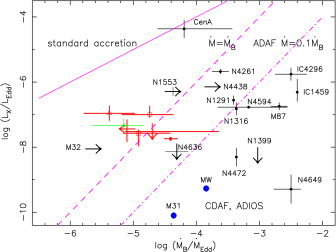
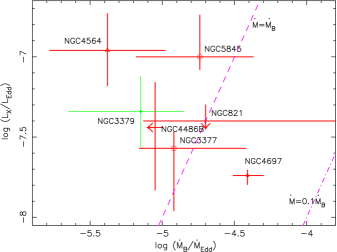
More generally, there are quiescent or very faint SMBHs for which the SMBH mass and X-ray luminosity, and the density of the surrounding hot ISM, have been estimated or constrained (Pellegrini 2005; Garcia et al. 2005; David et al. 2005). When plotted in an X-ray-luminosity versus Bondi-rate diagram (Figure 14), the distribution of the datapoints does not provide any obvious correlations between these two parameters, or between the luminosities observed and predicted by the ADAF model. (The standard disk model fares much worse, and is clearly ruled out for all but one galaxy). Some SMBHs, including those in the six galaxies of our sample, tend to be more X-ray luminous than predicted by the standard ADAF model (i.e., they lie above the predicted ADAF line in Figure 14). This seems to be the case for most galaxies with extremely low hot-ISM densities in the nuclear region ( cm-3), and therefore very low Bondi accretion rates (). On the other hand, SMBHs in galaxies with estimated Bondi accretion rates tend to lie below the ADAF line (Figure 14); that is, the ADAF model overpredicts their observed luminosities, in some cases by more than two orders of magnitude.
In the framework of inefficient accretion, we can explain the former group of galaxies by considering additional sources of gas which boost the accretion rate above the classical Bondi value, as we shall discuss in Paper II. Conversely, an additional mechanism must be at work in the latter group of galaxies, reducing the true accretion rate to values . As an aside, we note that the lack of SMBHs in the bottom left of the diagram (i.e., with and ) may be partly due to a selection effect, because both the nuclear point-like source and the diffuse hot-ISM emission would be close to or below the Chandra detection limit in those galaxies.
5.3. Convection and outflows
The original ADAF solution has subsequently been developed by taking into account two physical effects that are likely to further reduce the accretion rate, so that (see Narayan 2002 and references therein, for a review). Firstly, the inflowing gas is likely to become convectively unstable due to its inefficient cooling (Convection Dominated Accretion Flow, CDAF: Narayan et al. 2000); convective instabilities are also likely to occur when a magnetic field is frozen into the infalling gas (Igumenshchev & Narayan 2002); or when the inflowing gas has a large angular momentum (Proga & Begelman 2003) or vorticity (Krumholz, McKee & Klein 2005, 2006). Secondly, inefficient cooling causes the gas to have positive Bernoulli parameter, thus triggering large-scale winds and outflows which reduce the amount of gas reaching the BH (Advection Dominated Inflow-Outflow Solutions, ADIOS: Blandford & Begelman 1999).
Low, ADAF-like efficiencies and a reduced accretion rate with respect to the Bondi rate (–), via CDAF and/or ADIOS solutions, is a possible explanation for those galaxies in which hot-gas densities are – cm-3, and correspondingly, . They lie below the standard ADAF line in Figure 14. Among them, the SMBH in the Milky Way, for which ; an accretion rate has been suggested (Quataert 2003). The SMBH in the nucleus of M 31 also belongs to this group (Garcia et al. 2005). At higher central gas densities ( cm-3, corresponding to ), theoretical and observational arguments show that accretion will become radiatively efficient, with the formation of a standard, optically-thick, geometrically-thin accretion disk. SMBHs in this regime will appear as fully-fledged AGN.
5.4. Intermittent accretion
We have assumed so far that the accretion rate can be expressed as a constant fraction of the gas available. We also need to take into account the possibility that accretion is intermittent, so that the system may go through phases when the SMBH accretion rate is much lower than the Bondi inflow rate, and subsequent phases in which it can be much higher. The nuclear region would alternatively build up or be depleted of gas.
In one version of this scenario, it is the feedback from the nuclear X-ray source that drives and self-regulates the activity cycles: when the nuclear source is active, the surrounding ISM is radiatively heated (Ciotti & Ostriker 2001; Ostriker & Ciotti 2005), or, in the case of radiatively-inefficient accretion, is heated by the bulk kinetic energy of jets, outflows or convective motions (Binney & Tabor 1995; Omma et al. 2004), until the radial inflow is stopped and the nucleus switches off. Thus, the Bondi inflow estimated from the gas density at large radii (at the limit of the Chandra resolution) may not provide a good indication for the time-dependent accretion rate and SMBH luminosity. This is a possible explanation for the observed lack of any relation between , and (Pellegrini 2005).
Alternatively, accretion may cycle between radiatively inefficient flows (e.g., CDAF) in which gas accumulates inside the accretion radius, and a standard, radiatively-efficient accretion disk in which the stored gas is quickly accreted into the BH. However, this transition should only happen at accretion rates , much higher than estimated in our target galaxies.
Intermittent accretion may also be due to thermal-viscous ionization instabilities, triggered by an ionization front propagating inwards or outwards across an accretion disk (Siemiginowska, Czerny & Kostyunin 1996); a change of the viscosity parameter by a factor of between the two states may lead to changes in luminosity by four order of magnitudes. Again, this scenario requires that the inflowing gas can cool efficiently to form an accretion disk.
It was suggested (Fabbiano et al. 2004) that intermittent ejections may be responsible for the knotty jet-like feature in the nuclear region of NGC 821. If this emission is connected with nuclear activity, the most likely explanation would be that of thermal emission from shocks in the hot ISM resulting from a past nuclear outburst.
6. Conclusions
We have used Chandra, supported by archival HST and ground-based optical images, to study the nature, accretion power and mass budget of X-ray-faint SMBHs in elliptical/S0 galaxies. For this purpose, we have chosen a sample of six nearby galaxies with quiescent SMBHs, five of which with accurate BH mass determinations (from stellar kinematics). From the X-ray images, we found different morphologies for the X-ray emission in the nuclear region. In NGC 821, a jet-like feature has been previously suggested (Fabbiano et al. 2004). In NGC 4697, the nuclear emission is resolved into a few point-like sources (one of which is coincident with the nucleus). In other cases, (NGC 3377, NGC 4564, NGC 5845) the nuclear emission is extended on scales of a few hundred pc but its morphology remains unclear. Obscuration of the nuclear source may play a role in some cases; for example, in at least one galaxy (NGC 5845), the SMBH may be partly obscured by an edge-on disk of dust and stars, and the observed extended X-ray emission may be due to scattering in the surrounding plasma above and below the disk plane.
In five of the six galaxies, the X-ray colors of the nuclear emission are hard, consistent with an AGN spectrum. Hence, it is likely that most of the nuclear emission comes from the accreting SMBH, rather than from a central concentration of hot gas. In addition, softer X-ray emission from diffuse hot gas is detected around the nuclear region, out to kpc. We have fitted the soft X-ray brightness profiles with models to estimate central hot gas densities (typical values are cm-3). For two of our galaxies, the flux from the diffuse component is high enough to allow also for spectral fitting. NGC 4486B is the only case where the central, point-like X-ray source is soft but there is no evidence of diffuse thermal emission around it.
The Bondi accretion rate gives an estimate of the rate at which diffuse hot gas flows into the sphere of influence of the SMBH (characteristic radius pc ). Typical Bondi inflow rates vary from a few to yr-1 in our target galaxies This is a lower limit to the gas injection rate into the sphere of influence, because it does not take into account additional gas sources directly inside (for example, stellar winds or gas losses from Type-Ia supernovae).
Based on the X-ray data, we tried to answer the following (inter-related) questions: whether the observed X-ray SMBH luminosities are consistent with standard or radiatively-inefficient accretion; whether the X-ray-inferred Bondi rate is a good estimate of the true accretion rate onto the SMBH; and whether there is a correlation between Bondi rate and X-ray luminosity of the SMBH. We found that standard accretion is ruled out for all galaxies, as it would overestimate the SMBH luminosities. On the other hand, our quiescent sample of SMBHs are also brighter than what is predicted by radiatively-inefficient solutions (ADAF, ADIOS, CDAF); we interpret this as evidence that the Bondi inflow rate of the hot ISM underestimates the total gas injection rate into the sphere of influence of the SMBH. However, when we consider the other X-ray faint SMBHs for which the nuclear luminosity and the Bondi rate are known from the literature, we see that most of them are consistent with, or fainter than predicted by the ADAF model (as noted in Pellegrini 2005). In those cases, it appears that the Bondi inflow rate of hot gas is an over-estimate of the true accretion rate. Overall, there seems to be no correlation between the Bondi rate and the X-ray luminosity of the SMBH. A possible explanation suggested (Pellegrini 2005) for this lack of correlation is that accretion is intermittent, self-regulated by feedback from the BH: it may switch between a state in which (when gas builds up in the inner few pc), and one in which (as it is depleted).
In Paper II we will use optical observations to investigate additional sources of fuel for the SMBH; this will provide a better estimate of the total accretion rate, and will allow us to re-analyze its correlation with the X-ray luminosity. We shall then be able to estimate the energy and mass budget, discuss the conditions for a steady-state, and distinguish between different varieties of radiatively-inefficient models.
References
- (1) Arnaud, K. A. 1996, in Astronomical Data Analysis Software and Systems V, ASP Conference Series, Vol. 101, ed. G. H. Jacoby and J. Barnes, 17
- (2) Baganoff, F. K., et al. 2003, ApJ, 591, 891
- (3) Barazza, F. D., Binggeli, B., & Jerjen, H. 2002, A&A, 391, 823
- (4) Binney, J. J., & Tabor, G. 1995, MNRAS, 276, 663
- (5) Blandford, R. D., & Begelman, M. C. 1999, MNRAS, 303, L1
- (6) Blanton, E. L., Sarazin, C. L., & Irwin, J. A. 2001, ApJ, 552, 106
- (7) Bondi, H. 1952, MNRAS, 112, 195
- Bower et al. (2003) Bower, G. C., Wright, M. C. H., Falcke, H., & Backer, D. C. 2003, ApJ, 588, 331
- (9) Caon, N., Macchetto, D., & Pastoriza, M. 2000, ApJS, 127, 39
- (10) Cash, W. 1979, ApJ, 228, 939
- (11) Cavaliere, A., & Fusco-Femiano, R. 1976, A&A, 49, 137
- (12) Cavaliere, A., & Fusco-Femiano, R. 1978, A&A, 70, 677
- Ciotti & Ostriker (2001) Ciotti, L., & Ostriker, J. P. 2001 ApJ, 551, 131
- Collin et al. (2002) Collin, S., Boisson, C., Mouchet, M., Dumont, A.-M., Coupé, S., Porquet, D., & Rokaki, E. 2002, å, 388, 771
- (15) Cuadra, J., Nayakshin, S., Springel, V., & Di Matteo, T. 2005, MNRAS, 360, L55
- (16) David, L. P., Jones, C., Forman, W., & Murray, S. 2005, ApJ, submitted (astro-ph/0506018)
- (17) Dickey, J. M., & Lockman, F. M. 1990, ARA&A, 28, 215
- (18) Di Matteo, T., Allen, S. W., Fabian, A. C., Wilson, A. S., & Young, A. 2003, ApJ, 582, 133
- (19) Dosaj, A., Garcia, M., Forman, W., Jones, C., Kong, A. K. H., di Stefano, R., Primini, F., & Murray, S. 2002, in The High Energy Universe at Sharp Focus: Chandra Science, ASP Conference Proceedings, Vol. 262, eds. E. M. Schlegel & S. D. Vrtilek (San Francisco: Astronomical Society of the Pacific), 147
- (20) Elvis, M., Briel, U. G., & Henry, J. P. 1983, ApJ, 268, 105
- (21) Elvis, M., Fassnacht, C., Wilson, A. S., & Briel, U. 1990, ApJ, 361, 459
- (22) Elvis, M., et al. 1994, ApJS, 95, 1
- (23) Ettori, S. 2000, MNRAS, 311, 313
- (24) Evans, D. A., Kraft, R. P., Worrall, D. M., Hardcastle, M. J., Jones, C., Forman, W. R., & Murray, S. S. 2004, ApJ, 612, 786
- (25) Fabbiano, G., Baldi, A., Pellegrini, S., Siemiginowska, A., Elvis, M., Zezas, A., & McDowell, J. 2004, ApJ, 616, 730
- Fabbiano & Juda (1997) Fabbiano, G., & Juda, J. Z. 1997, ApJ, 476, 666
- (27) Fabbiano, G., et al. 2003, ApJ, 588, 175
- Fabian & Canizares (1988) Fabian, A. C., & Canizares, C. R. 1988, Nature, 333, 829
- Ferrarese (2002) Ferrarese, L. 2002, ApJ, 578, 90
- Ferrarese (2000) Ferrarese, L., & Merritt, D. 2000, ApJ, 539, L9
- (31) Ferrarese, L., Pogge, R. W., Peterson, B. M., Merritt, D., Wandel, A., & Joseph, C. L. 2001, ApJ, 555, L79
- (32) Frank, J., King, A., & Raine, D. J. 2002, Accretion Power in Astrophysics (Cambridge University Press)
- (33) Garcia, M. R., Williams, B. F., Yuan, F., Kong, A. K. H., Primini, F. A., Barmby, P., Kaaret, P., & Murray, S. S. 2005, ApJ, in press (astro-ph/0412350)
- (34) Gebhardt, K., et al. 2000, ApJ, 539, L13
- (35) Gebhardt, K., et al. 2003, ApJ, 583, 92
- Graham (2002) Graham, A. W. 2002, ApJ, 568, L13
- Graham et al. (2001) Graham, A. W., Erwin, P., Caon, N., & Trujillo, I. 2001, ApJ, 563, L11
- Graham et al. (2003) Graham, A. W., Erwin, P., Caon, N., & Trujillo, I. 2003, RMxAC, 17, 196
- (39) Graham, A. W., Jerjen, H., & Guzmán, R. 2003, AJ, 126, 1787
- Ho (1999) Ho, L. C. 1999, ApJ, 516, 672
- Ho (2002) Ho, L. C. 2002, ApJ, 564, 120
- Ho (2001) Ho, L. C., et al. 2001, ApJ, 549, L51
- (43) Ichimaru, S. 1977, ApJ, 214, 840
- (44) Igumenshchev, I. V., & Narayan, R. 2002, ApJ, 566, 137
- (45) Jerjen, H., & Binggeli, B. 1997, in The Nature of Elliptical Galaxies, 2nd Stromlo Symposium, ASP Conference Series, Vol. 116, ed. M. Arnaboldi, G. S. Da Costa, and P. Saha, 239 (astro-ph/9701221)
- (46) Jerjen, H., Kalnajs, A., & Binggeli, B. 2000, A&A, 358, 845
- (47) Jones, C., Forman, W., Vikhlinin, A., Markevitch, M., David, L., Warmflash, A., Murray, S., & Nulsen, P. E. J. 2002, ApJ, 567, L115
- (48) Kim, D. W., & Fabbiano, G. 2003, ApJ, 586, 826
- (49) Kormendy, J., Dressler, A., Byun, Y. I., Faber, S. M., Grillmair, C., Lauer, T. R., Richstone, D., & Tremaine, S. 1994, in Proc. ESO/OHP Workshop on Dwarf Galaxies, ed. G. Meylan & P. Prugniel (Garching: ESO), 147
- (50) Kormendy, J., & Gebhardt, K. 2001, 20th Texas Symposium on relativistic astrophysics, Austin, Texas, Dec 2000, AIP conference proceedings, Vol. 586, eds. J. C. Wheeler and H. Martel, 363
- (51) Kormendy, J., Gebhardt, K., Fisher, D. B., Drory, N., Macchetto, F. D., & Sparks, W. B. 2005, AJ, 129, 2636
- (52) Kormendy, J., et al. 1997, ApJ, 482, L139
- (53) Kraft, R. P., Vázquez, S. E., Forman, W. R., Jones, C., Murray, S. S., Hardcastle, M. J., Worrall, D. M., & Churazov, E. 2003, ApJ, 592, 129
- (54) Krajnović, D., & Jaffe, W. 2002, A&A, 390, 423
- (55) Krumholz, M. R., McKee, C. F., & Klein, R. I. 2005, ApJ, 618, 757
- (56) Krumholz, M. R., McKee, C. F., & Klein, R. I. 2006, ApJ, in press (astro-ph/0510410)
- (57) Macchetto, D., Pastoriza, M., Caon, N., Sparks, W. B., Giavalisco, M., Bender, R., & Capaccioli, M. 1996, A&AS, 120, 463
- Magorrian et al. (1998) Magorrian, J., et al. 1998, AJ, 115, 2285
- Merloni, Heinz & Di Matteo (2003) Merloni, A., Heinz, S., & Di Matteo, T. 2003, MNRAS, 345, 1057
- (60) Merritt, D., & Ferrarese, L. 2001, in The Central Kiloparsec of Starbursts and AGN: The La Palma Connection, ASP Conference Proceedings, Vol. 249, ed. J. H. Knapen, J. E. Beckman, I. Shlosman, and T. J. Mahoney (San Francisco: Astronomical Society of the Pacific), 335 (astro-ph/0107134)
- Narayan (2002) Narayan, R. 2002, in Lighthouses of the Universe, ed. M. Gilfanov, R. Sunyaev, & E. Churazov (New York: Springer), 405 (astro-ph/0201260)
- (62) Narayan, R., Igumenshchev, I. V., & Abramowicz, M. A. 2000, ApJ, 539, 798
- (63) Narayan, R., & Yi, I. 1994, ApJ, 428, L13
- (64) Narayan, R., & Yi, I. 1995, ApJ, 444, 231
- (65) Neilsen, E. H., & Tsvetanov, Z. I. 2000, ApJ, 536, 255
- (66) Ogle, P. M., Marshall, H. L., Lee, J. C., & Canizares, C. R. 2000, ApJ, 545, L81
- (67) Ogle, P. M., Brookings, T., Canizares, C. R., Lee, J. C., & Marshall, H. L. 2003, A&A, 402, 849
- (68) Omma, H., Binney, J., Bryan, G., & Slyz, A. 2004, MNRAS, 348, 1105
- (69) Onken, C. A., Ferrarese, L., Merritt, D., Peterson, B. M., Pogge, R. W., Vestergaard, M., & Wandel, A. 2004, ApJ, 615, 645
- (70) Ostriker, J. P., & Ciotti, L. 2005, Phil. Trans. of the Royal Soc. A, Vol. 363, Number 1828, 667 (astro-ph/0407234)
- (71) Page, M. J., Davis, S. W., & Salvi, N. J. 2003, MNRAS, 343, 1241
- (72) Pellegrini, S. 2005, ApJ, 624, 155
- (73) Pellegrini, S, Baldi, A., Fabbiano, G., & Kim, D.-W. 2003a, ApJ, 597, 175
- (74) Pellegrini, S., & Fabbiano, G. 1994, ApJ, 429, 105
- (75) Pellegrini, S., Venturi, T., Comastri, A., Fabbiano, G., Fiore, F., Vignali, C., Morganti, R., & Trinchieri, G. 2003b, ApJ, 585, 677
- Perna et al. (2003) Perna, R., Narayan, R., Rybicki, G., Stella, L., & Treves, A. 2003, ApJ, 594, 936
- (77) Peterson, B. M., et al. 2004, ApJ, 613, 682
- (78) Proga, D., & Begelman, M. C. 2003, ApJ, 592, 767
- (79) Quataert, E. 2003, in Astronomische Nachrichten, Supplementary Issue 1, Proceedings of the Galactic Center Workshop 2002–The central 300 pc of the Milky Way, 435 (astro-ph/0304099)
- (80) Quillen, A. C., Bower, G. A., & Stritzinger, M. 2000, ApJ, 128, 85
- (81) Randall, S. W., Sarazin, C. L., & Irwin, J. A. 2004, ApJ, 600, 729
- (82) Rest, A., van den Bosch, F. C., Jaffe, W., Tran, H., Tsvetanov, Z., Ford, H. C., Davies, J., & Schafer, J. 2001, AJ, 121, 2431
- Richstone et al. (1998) Richstone, D. 1998, Nature, 395, 14
- (84) Richstone, D., et al. 2004, unpubl. (astro-ph/0403257)
- (85) Ruffert, M., & Arnett, D. 1994, ApJ, 427, 351
- (86) Sarazin, C. L., Irwin, J. A., & Bregman, J. N. 2001, ApJ, 556, 533
- (87) Shakura, N. I., & Sunyaev, R. A. 1973, A&A, 24, 337
- (88) Siemiginowska, A., Czerny, B., & Kostyunin, V. 1996, ApJ, 458, 491
- (89) Sivakoff, G. R., Sarazin, C. L., & Carlin, J. L. 2004, ApJ, 617, 262
- (90) Sivakoff, G. R., Sarazin, C. L., & Irwin, J. A., 2003, ApJ, 599, 218
- (91) Soldatenkov, D. A., Vikhlinin, A. A., & Pavlinsky, M. N. 2003, AstL, 29, 298
- (92) Soria, R., Graham, A., Fabbiano, G., Baldi, A., Elvis, M., Jerjen, H., Pellegrini, S., & Siemiginowska, A. 2005, ApJ, submitted (Paper II)
- Sutherland & Dopita (1993) Sutherland, R. S., & Dopita, M. A. 1993, ApJS, 88, 253
- (94) Tan, J. C., & Blackman, E. G. 2005, MNRAS, in press (astro-ph/0409413)
- (95) Tonry, J. L., Dressler, A., Blakeslee, J. P., Ajhar, E. A., Fletcher, A. B., Luppino, G. A., Metzger, M. R., & Moore, C. B. 2001, ApJ, 546, 681
- (96) Trinchieri, G., & Fabbiano, G. 1985, ApJ, 296, 447
- (97) van den Bosch, F. C., Ferrarese, L., Jaffe, W., Ford, H. C., & O’Connell, R. W. 1994, AJ, 108, 1579
- (98) Wang, J.-M., & Netzer, H. 2003, A&A, 398, 927
- (99) Wang, T.-G., & Zhang, X.-G. 2003, MNRAS, 340, 793
- (100) Weisskopf, M. C., Tananbaum, H. D., Van Speybroeck, L. P., & O’Dell, S. L. 2000, SPIE, 4012, 2 (astro-ph/0004127)
- (101) Wrobel, J. M., & Heeschen, D. S. 1991, AJ, 101, 148
- (102) Wrobel, J. M., & Herrnstein, J. R. 2000, ApJ, 533, L111