SPITZER OBSERVATIONS OF MASSIVE, RED GALAXIES AT HIGH REDSHIFT11affiliation: This work is based in part on observations made with the Spitzer Space Telescope, which is operated by the Jet Propulsion laboratory, California Institute of Technology, under NASA contract 1407; on observations taken with the NASA/ESA Hubble Space Telescope, which is operated by the Association of Universities for Research in Astronomy, Inc. (AURA) under NASA contract NAS5–26555; and observations collected at the Kitt Peak National Observatory (KPNO), National Optical Astronomical Observatories (NOAO), which is operated by AURA, Inc., under cooperative agreement with the National Science Foundation. Observations have also been carried out using the Very Large Telescope at the ESO Paranal Observatory under Program ID: LP168.A-0485
Abstract
We investigate the properties of massive galaxies at using Hubble Space Telescope observations at optical wavelengths, ground–based near–infrared (IR) imaging, and Spitzer Space Telescope observations at 3–24 µm. From –selected galaxies over a arcmin2 field in the southern Great Observatories Origins Deep Surveys (GOODS–S), we identify 153 distant red galaxies (DRGs) with . This sample is approximately complete in stellar mass for passively evolving galaxies above and . Of the galaxies identified by this selection, roughly half are objects whose optical and near–IR rest–frame light is dominated by evolved stars combined with ongoing star formation (at ), and the others are galaxies whose light is dominated by heavily reddened ( mag) starbursts (at ). Very few of the galaxies (%) have no indication of current star formation. The total star–formation rates (SFRs) including the reradiated IR emission for the DRGs are up to two orders of magnitude higher than those derived from the UV luminosity corrected for dust reddening. We use population synthesis models to estimate stellar masses and to study the stars that dominate the rest–frame UV through near–IR light in these galaxies. DRGs at with stellar masses have specific SFRs (SFRs per unit stellar mass) ranging from 0.2 to 10 Gyr-1, with a mean value of Gyr-1. Based on the X–ray luminosities and rest–frame near–IR colors, as many as one–quarter of the DRGs may contain AGN, implying that the growth of supermassive black holes coincides with the formation of massive galaxies at . The DRGs with at have integrated specific SFRs greater the global value over all galaxies at this epoch. In contrast, we find that galaxies at with have integrated specific SFRs less than the global value, and more than an order of magnitude lower than that for massive DRGs at . At , lower–mass galaxies dominate the overall cosmic mass assembly. This suggests that the bulk of star formation in massive galaxies occurs at early cosmic epochs and is largely complete by . Further mass assembly in these galaxies takes place with low specific SFRs.
Subject headings:
cosmology: observations — galaxies: evolution — galaxies: formation — galaxies: high-redshift — galaxies: stellar content — infrared: galaxies1. Introduction
Most of the stellar mass in galaxies today apparently formed during the relatively short period between and 1 (e.g. Dickinson et al., 2003; Rudnick et al., 2003; Fontana et al., 2004; Glazebrook et al., 2004). Some early–type galaxies appear as soon as (Dunlop et al., 1996; Spinrad et al., 1997; McCarthy et al., 2004; Daddi et al., 2005a). By , there is a significant population of galaxies with red colors and morphologies consistent with passively–evolving early–type galaxies, implying they formed their stellar populations at (e.g., Cimatti et al., 2002a; Moustakas & Somerville, 2002; Moustakas et al., 2004; Papovich et al., 2005; Treu et al., 2005; McCarthy, 2004, for a review). The cosmic star–formation rate (SFR) density has declined by roughly a factor 10 from to the present–day (e.g. Hopkins, 2004, and references therein). During the time since the stellar mass in passively–evolving, early–type galaxies has increased by less than a factor 2 (e.g. Brinchmann & Ellis, 2000; Bell et al., 2004), and at the present epoch, roughly one–third of all stars exist in such galaxies (Baldry et al., 2004).
Although massive galaxies appear to have formed most of their stars at epochs prior to , we have few constraints on how they assembled their stellar mass. One hypothesis is that galaxies “downsize” and star formation shifts from galaxies at the high to the low end of the mass function with decreasing redshifts (e.g., Cowie et al., 1999; Fontana et al., 2003; Heavens et al., 2004; Kauffmann et al., 2004; Bauer et al., 2005; Caputi et al., 2005; Juneau et al., 2005; Pérez–González et al., 2005). Another possibility is that massive galaxies assemble their stellar mass early–on, either in situ, “closed–box” formation events with subsequent passive evolution (e.g., Eggen, Lynden–Bell, & Sandage, 1962), or in low–mass systems, which then coalesce to form large galaxies with little subsequent star formation (e.g., Baugh et al., 1998; Kauffmann & Charlot, 1998; Cimatti et al., 2002b).
Testing these proposals has been frustrated by difficulties in conducting a complete census of star–forming galaxies and massive galaxies at , when such systems are expected to experience a peak in their stellar assembly rates (e.g. De Lucia et al., 2005; Nagamine et al., 2005). Ultraviolet (UV)–luminous star–forming galaxies at these redshifts are identified by the characteristic “break” in their colors due to neutral hydrogen absorption that attenuates the flux shortward of Lyman (1216 Å) and the 912 Å Lyman limit (e.g. Steidel et al., 1996; Giavalisco, 2002, for a review). These UV–dropout, Lyman–break galaxies (LBGs) dominate the UV luminosity density at , and possibly the global SFR density at these redshifts (e.g., Steidel et al., 1999; Bouwens et al., 2004; Giavalisco et al., 2004b). However, the UV–dropout technique is primarily sensitive to galaxies with ongoing, relatively unreddened star formation. Surveys with SCUBA have identified a population of sub–mm galaxies at that emit the bulk of their bolometric luminosity at infrared (IR) wavelengths (see Blain et al., 2002, for a review), and may contribute substantially to the cosmic SFR (Barger et al., 2000). Their inferred space densities and SFRs suggest that they could be the progenitors of the most massive present–day galaxies (Blain et al., 2004; Chapman et al., 2005). Neither the LBG nor the sub-mm–galaxy populations necessarily provide a full sample selected by stellar mass, so how they participate in the formation of present–day massive galaxies is poorly understood. Hence, it is unclear what fraction of present–day galaxies pass through such stages during their assembly.
Theoretically, the star–formation histories of massive galaxies are also poorly known. Galaxies within massive halos have short cooling times and tend to convert all their gas into stars rapidly, unless feedback is invoked from stellar winds and supernovae to reheat the gas or prevent it from cooling (e.g. Hernquist & Springel, 2003; Springel et al., 2005a, b). Models predict that massive galaxy halos continue to accrete smaller aggregates up to the current epoch, which rejuvenates star–formation and predicts galaxy colors that are too blue compared to observations (e.g. Somerville, Primack, & Faber, 2001) unless very large dust extinctions or non–standard stellar initial mass functions (IMFs) are invoked (Baugh et al., 2005; Nagamine et al., 2005). Some recent theoretical models suppress star–formation at late times in massive galaxies using feedback from active–galactic nuclei (AGN; Granato et al., 2001; Di Matteo et al., 2005; Hopkins et al., 2005; Springel et al., 2005a). This process may provide the impetus for the present–day black-hole–bulge-mass correlation (Magorrian et al., 1998; Gebhardt et al., 2000; Kauffmann et al., 2004). We require observations of star–formation and AGN activity in high–redshift, massive galaxies to improve our understanding of how such systems form.
Surveys using deep, near–IR observations have identified high–redshift, massive–galaxy candidates with red near–IR colors (e.g., Dickinson et al., 2000; Totani et al., 2001; Im et al., 2002; Daddi et al., 2004; Yan et al., 2004a). Franx et al. (2003) used deep observations from VLT/ISAAC to identify a population of galaxies with mag in the Faint IR Extragalactic Survey (FIRES). In principle, this color selection identifies galaxies that have a strong Balmer/4000 Å break between the and bands at , down to an approximately complete limit in stellar mass. Subsequent analysis has concluded that these distant red galaxies (DRGs) are mostly massive, old, and actively forming stars at (van Dokkum et al., 2003; Förster–Schreiber et al., 2004; Rubin et al., 2004; Knudsen et al., 2005; Reddy et al., 2005) although some appear to be completely devoid of star–formation and passively evolving (Labbé et al., 2005), while others appear to host powerful AGN (van Dokkum et al., 2004). The inferred stellar masses of DRGs at are similar to those of local early–type galaxies (Förster–Schreiber et al., 2004). They are generally higher than those inferred from LBG samples at similar redshifts (Sawicki & Yee, 1998; Papovich, Dickinson, & Ferguson, 2001; Shapley et al., 2001), although some overlap between the two clearly exists (Shapley et al., 2005; Reddy et al., 2005). The estimated stellar population ages of the DRGs suggests that they have been forming stars since (Förster–Schreiber et al., 2004). Thus DRGs may represent the older stellar populations formed in higher–redshift LBGs (e.g. Papovich et al., 2004a), and these galaxies possibly link the UV–luminous LBGs to the sub–mm galaxies (van Dokkum et al., 2004).
In addition, extinction may contribute to the red colors of some of the galaxies. Smail et al. (2002) find that dust–extincted starbursts at selected as extremely red objects (EROs) typically have red colors similar to DRGs. Using current hierarchical model predictions, Nagamine et al. (2005) suggest that massive galaxies in formation at may be heavily reddened by dust. If so, then most of their emission should appear in the thermal IR. In fact, up to half of EROs (selected with red or colors) at are detected in the thermal IR by Spitzer/MIPS at 24 µm (Wilson et al., 2004; Yan et al., 2004b). In addition, the inferred evolution of the galaxy population responsible for the IR number counts implies a substantial population of galaxies at (Papovich et al., 2004b; Caputi et al., 2005; Pérez–González et al., 2005), and the evolution in the IR luminosity function suggest that luminous IR galaxies (LIRGs, ), and ultraluminous IR galaxies ( ) dominate the IR luminosity density at (Le Floc’h et al., 2005; Pérez–González et al., 2005).
For this study, we selected galaxies at with mag ([ mag) from a –band selected catalog in the southern Great Observatories Origins Deep Survey (GOODS-S) field. At the magnitude limit of [AB], this sample is approximately complete in stellar mass for passively evolving galaxies with for . We also use IR and X–ray observations to constrain the star–formation and AGN processes in these galaxies. The AGN connection in these galaxies is explored in more detail in a forthcoming paper (L. A. Moustakas et al., in preparation). In § 2, we summarize the data and we define the galaxy samples. In § 3, we describe broad properties of the DRGs using their rest–frame UV to near–IR colors. In § 4, we compare the IR luminosities for the galaxies with those derived from their UV luminosity and measured extinction, and we compare the DRGs to other galaxies at . In § 5, we use population synthesis models to estimate the properties of the galaxies’ stellar populations. In § 6, we discuss the relationship between the SFRs and stellar population properties for the ensemble of galaxies, and we comment on the presence of AGN. We also compare the distribution of SFR as a function of galaxy stellar mass at high redshift, and we compare with results at lower redshifts (). In § 7 we present our conclusions.
Throughout this paper we use a cosmology with , , , and km s-1 Mpc-1 where . Unless otherwise specified, we present all magnitudes in the AB system, 1 Jy. We denote galaxy magnitudes from the HST ACS bandpasses F435W, F606W, F775W, and F850LP as , , , and , respectively. Similarly, where applicable we denote magnitudes from the HST WFPC2 and NICMOS bandpasses F300W, F450W, F606W, F814W, F110W, and F160W as , , , , , and , respectively. We also denote magnitudes from the four Spitzer IRAC channels as , , , and , respectively.
2. The Data and Sample Definitions
The GOODS–S field center is located in the southern Chandra Deep X–ray field (CDF–S) at , , which provides 1 Ms of imaging in the soft (0.5–2 keV) and hard (2–8 keV) X–ray bands in this field. The available observations include imaging with HST/ACS in four passbands, , , , and over 160 arcmin2, ground–based near–IR imaging from VLT/ISAAC in the bands over 130 arcmin2 (with –band imaging over arcmin2), and IR imaging from Spitzer/IRAC in four bands, , , , .
The ACS observations and data reduction are described in Giavalisco et al. (2004a). The images have a PSF FWHM , and the limiting sensitivities are , , , , measured in –diameter circular apertures. The Spitzer/IRAC images have a PSF FWHM ranging from at 3.6 µm to ″at 8 µm, and for isolated point sources achieve limiting sensitivities ranging from 0.11 Jy at 3.6 µm to 1.66 Jy at 8 µm (M. Dickinson, et al., in preparation).
The near–IR ISAAC imaging is from the version 1.0 release (B. Vandame et al., in preparation), available on the ESO/GOODS webpages.111http://www.eso.org/science/goods/releases/20040430/ The ISAAC data have excellent image quality (full–width at half maximum, FWHM ) with mean exposures times of 14000 and 24000 s in and , respectively, reaching limiting magnitudes of , and (10 ) in 1″–diameter apertures, although the depth varies over the GOODS–S field.
Spitzer imaged the CDF–S field with MIPS at 24, 70, and 160 µm under Spitzer/Guaranteed Time Observer (GTO) time. Here, we focus exclusively on the 24 µm imaging, which was reduced using the instrument team Data Analysis Tool (Gordon et al., 2005). The GTO MIPS imaging covers with a FWHM arcsec, and covers all of the GOODS–S field and most of the ESO imaging and COMBO–17 surveys (see § 2.5).
2.1. GOODS Source Cataloging and DRG Sample Selection
We use a source catalog selected from the ISAAC –band data. We rebinned the ACS data to the pixel scale of ISAAC, and convolved the ACS images to match the image quality of the ISAAC images. Source catalogs were then constructed using the SExtractor software (Bertin & Arnouts, 1996) by first locating sources on the –band image, then measuring photometry in matched apertures on the HST/ACS and ISAAC images. We measured photometry in each band in isophotal apertures defined from the –band image. We then scaled these to total magnitudes using the difference between the –band isophotal magnitude (SExtractor MAG_ISO) and the –band magnitude measured in a “total”, elliptical aperture defined by the Kron radius (SExtractor MAG_AUTO). Photometric uncertainties are derived by SExtractor after adjusting the image rms maps to account for the correlated noise properties introduced by drizzling.222see ftp://archive.stsci.edu/pub/hlsp/goods/v1/h_goods_v1.0_rdm.html The SExtractor–derived uncertainties still likely underestimate the true errors, because they do not account for systematic errors in the measurements themselves. Therefore, we have included an additional error of %, added in quadrature to the uncertainties on the ACS and ISAAC photometry.
We detected objects in the Spitzer/IRAC images using a weighted–sum image of IRAC channels 1 and 2. Magnitudes were then measured in each IRAC band in 4″–diameter apertures, and we applied aperture corrections of 0.30, 0.34, 0.53, and 0.67 mag to the bands , , , and , respectively, to correct to total magnitudes. We did not attempt to measure photometry on versions of the ISAAC data PSF–matched to the IRAC data, because of the significantly poorer image quality of the IRAC data. The aperture corrections are based on Monte Carlo simulations using artificial, compact sources added to the real images, and are appropriate for sources with half–light radii , such as those of interest here. These simulations also allow us to estimate the error on the IRAC photometry as a function of flux density. The uncertainties are similar for IRAC channels 1 and 2, and range from mag at mag to mag at mag. For IRAC channels 3 and 4, they range from mag at mag to mag at mag.
We used mag to identify DRGs. In the GOODS–S field, we found 153 of them to a signal–to–noise ratio limit, which is the median S/N of objects at mag within the “total”, MAG_AUTO apertures, and with colors measured in the seeing–matched MAG_AUTO apertures. Restricting sources to the S/N requirement is appropriate as the ISAAC depth varies over the GOODS–S field. Using a S/N limit also ensures that we can derive robust colors from the ACS and ISAAC data, greatly improving the accuracy of our SED modeling and photometric redshifts. We inspected the ACS image for each DRG at their native resolution to identify objects resulting from chance galaxy–galaxy alignments along the line of sight. In one case the DRG does appear to involve multiple ACS sources, blended at the K–band resolution. We exclude this object although its inclusion does not effect the results in this paper. A unique IRAC source exists for 132 of the 153 DRGs with a matching radius of . We visually inspected each object to verify that the matched IRAC source corresponds to the DRGs in the –band image. The unmatched objects suffer from crowding in the IRAC images from other sources within 1–2″. The IRAC flux from these non–detected DRGs is either completely blended within the isophote of the neighbor, or confusion with the neighbor offsets the centroid of the IRAC flux past the matching criterion.
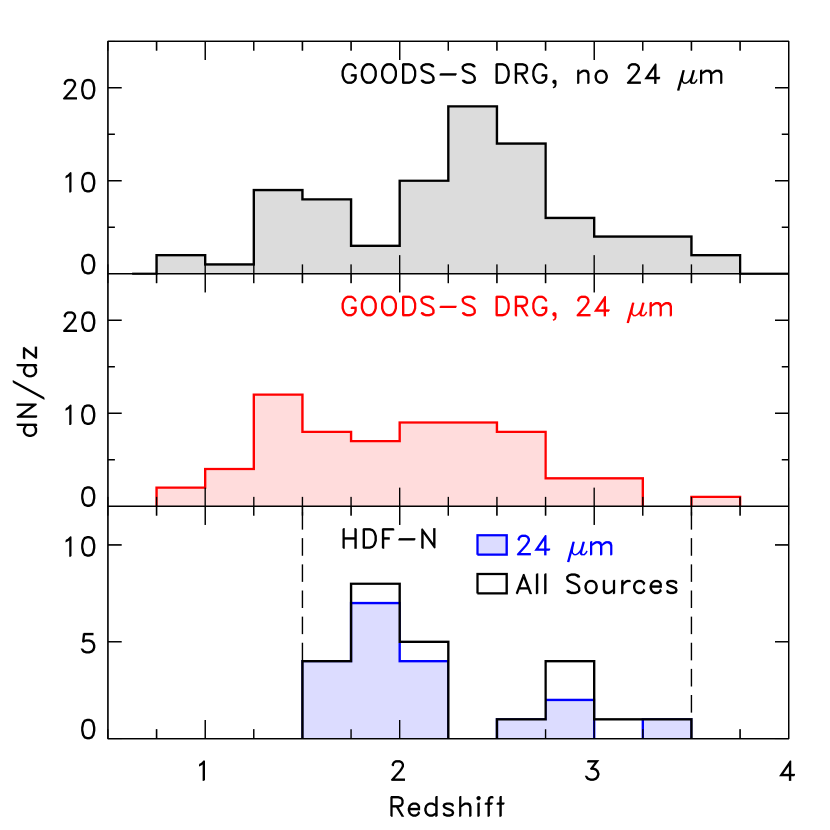
Spectroscopic redshifts are available for 12 of the DRGs (Szokoly et al. 2004; Mignoli et al. 2005; Vanzella et al. 2005; D. Stern 2005, private communication). We therefore supplement the redshift information using photometric redshifts from Mobasher et al. (2004 and in preparation). The high–quality dataset allows for accurate photometric redshifts. The median photometric–redshift uncertainty for all –band sources with spectroscopic redshifts is , similar to the accuracy found by Caputi et al. (2005) using similar data in the same field. For the 12 DRGs with spectroscopic redshifts, the photometric–redshift accuracy is even better, . A photometric redshift is unavailable for one of the DRGs, whose ACS and ISAAC –band photometry have S/N. We ignore this DRG for any analysis requiring a redshift (e.g., luminosities, stellar masses, etc.). Figure 1 shows the redshift distribution. The redshifts range from , with a median redshift . This is in broad agreement with the redshift distribution for DRGs reported in the FIRES surveys (Franx et al., 2003; Förster–Schreiber et al., 2004), although there is a larger fraction of DRGs with in the GOODS–S field compared to the FIRES samples (see § 3). We believe the lower median redshift of the GOODS–S DRGs primarily results from the larger areal coverage combined with the somewhat brighter flux limit of the GOODS–S field. In addition, cosmic variance between the GOODS–S and FIRES fields may contribute to this difference.
However, roughly 20% (30/152) of the DRGs have redshifts (including two with spectroscopic redshifts), significantly lower than the typical redshifts reported for the FIRES samples.333van Dokkum et al. (2003) find that one of the six DRGs in their spectroscopic sample has . They estimate that the red color selection has a % contamination of (dusty) galaxies at lower redshift, probably consistent with the fraction of DRGs at in our sample. We have inspected the SEDs of this low–redshift DRG subsample and found that the ACS through IRAC colors supports the derived redshifts with high fidelity for the majority (27/30) of galaxies. For these DRGs, the IRAC photometry shows a fairly robust turnover at rest–frame 1.6 µm near the expected peak in the stellar emission, and the SEDs at the inferred redshift are otherwise consistent with the ACS and ISAAC colors. In the remaining three cases, their ACS photometry has low S/N, leading to dubious results. Ignoring these three galaxies has no effect on the analysis and conclusions derived here, but we include them in the sample for completeness. In § 6, we conclude that the lower redshift () DRGs are mostly heavily extincted starbursts, and are probably part of the class of dusty EROs at , which typically have red colors that satisfy the DRG selection criterion (Smail et al., 2002; Franx et al., 2003).
2.2. Spitzer 24 µm Source Detection and Cataloging
Papovich et al. (2004b) describe the data reduction and point–source photometry methods applied to the Spitzer/MIPS 24 µm image. They show that the GTO 24 µm data reach a 50% completeness limit at 60 Jy. We reanalyzed the simulations discussed in Papovich et al. to estimate the flux uncertainties as a function of MIPS 24 µm flux density. The median 24 µm S/N is 4 for objects with Jy (the 80% completeness limit). We cross–correlated 24 µm sources with Jy (the S/N limit) to the –band catalog and identified matches with a radius of 2″. Roughly one–half (74/153) of the DRGS are detected by Spitzer/MIPS at 24 µm. The majority of these 24 µm–detected DRGs (71/74) have IRAC counterparts associated with each DRG in the –band image. The remaining three appear associated with IRAC sources at distances from the –band source. For the source density at the flux limit of the 24 µm data (Papovich et al., 2004b), we expect a random–association probability of 0.03 within a 2″ radius, which is consistent with the three sources with no IRAC counterpart. Therefore, these sources are likely change alignments.
Figure 1 shows the redshift distribution of the DRGs detected at 24 µm. The distribution of this sub–population is similar to those DRGs not detected at 24 µm, except for an apparent spike in the redshift distribution at for the 24 µm–undetected DRGs. The 24 µm–detected DRGs have a mean redshift = 2.0, slightly lower than the mean redshift for the DRGs with no 24 µm detection, = 2.3. Using a Kolmogoroff–Smirnov statistic, there is a moderate likelihood (90% confidence) that the two sub–populations of DRGs are drawn from different parent samples. Different redshift distributions in part may arise because the 24 µm subsample includes a large number of lower–redshift galaxies. However, at the 7.7 µm emission feature from polycyclic aromatic hydrocarbons (PAHs) lies in the 24 µm bandpass, and thus one might expect more IR–detected galaxies to appear. The sharp increase in the number of 24 µm–undetected DRGs at may result from the fact that at this redshift the DRG selection begins to pick up galaxies with strong Balmer/4000 Å breaks that shift between the and –bands. Such galaxies presumably have low specific SFRs (SFR per unit stellar mass), and perhaps have lower IR emission, so fewer would be detected at 24 µm.
2.3. X–ray Source Detection and Cataloging
The CDF-S has aim–point flux limits (S/N) in the 0.5–2.0 keV and 2–8 keV bands of erg cm-2 s-1 and erg cm-2 s-1, respectively. The completeness limit over 90% of GOODS-S field is erg cm-2 s-1 (0.5–2.0 keV) and erg cm-2 s-1 (2–8 keV). Assuming an X–ray spectral slope of 2.0, a source detected with a flux of erg cm-2 s-1 would have both observed and rest frame luminosities of erg s-1 and erg s-1 at and , respectively, assuming no Galactic absorption.
In this study we use the main and supplementary Chandra catalogs of Alexander et al. (2003). The median positional accuracy for the sources in the GOODS-S field in the main Chandra catalog is . We matched all –band sources to the X–ray catalog within a radius of 1″ and identified all matches in both the soft– and hard–band catalogs. Nearly one–seventh (22/153) of the DRGs have X-ray detections in either the soft or hard bands (or both). Of these, 12 are detected at 24 µm, while the remaining 10 are not. All of the X–ray detected DRGs have IRAC counterparts.
2.4. High–Redshift Sample of IR–luminous Galaxies from the HDF–N
We construct a comparison sample of galaxies within the northern Hubble Deep Field (HDF–N, Williams et al., 1996), which spans all types of galaxies (not just the reddest galaxies identified by the DRG–selection), and extends our analysis to fainter 24 µm fluxes. This allows us to study how the DRGs are drawn from the general galaxy population at similar redshifts. Galaxies were selected from the NICMOS HDF catalog of M. Dickinson et al. (Dickinson et al., 2000; Papovich, Dickinson, & Ferguson, 2001; Dickinson et al., 2003), and matched to the deep IRAC and MIPS 24 µm observations of the northern GOODS (GOODS–N) field (M. Dickinson et al., in preparation; R. Chary et al., in preparation). From the NICMOS–selected catalog, we identify 24 galaxies in the HDF–N with mag and redshift, , roughly in the same range as in the GOODS–S DRGs. Spectroscopic redshifts are available for 13 of the galaxies in this sample (see Dickinson et al., 2003, and references therein). For the remaining 11 galaxies, we use the photometric redshift catalog from Budavári et al. (2000). Of this sample, 19 are detected with the MIPS 24 µm imaging to Jy.
Figure 1 shows the redshift distribution of the HDF–N galaxies. We note that four of these galaxies with mag have , and possibly satisfy the DRG color criterion (allowing for differences in the HDF–N and GOODS–S filter sets). Of these, three have Jy, and so could have been detected in the 24 µm of the CDF–S.
2.5. Low–Redshift Galaxy Samples from COMBO–17
In § 6, we compare the SFRs and stellar masses of the high–redshift DRGs to those of lower–redshift samples. The GTO Spitzer/MIPS 24 µm imaging intersects roughly 700 arcmin2 of the COMBO–17 survey (Wolf et al., 2003) in a substantially larger region encompassing the 130 arcmin2 GOODS–S field. COMBO–17 provides photometric redshifts for galaxies with mag to (Wolf et al., 2004). Where possible, we replaced many of these photometric redshifts with spectroscopic ones (Le Fèvre et al., 2004; Vanzella et al., 2005). We then constructed samples of galaxies with mag in two redshift slices, and . We cross–correlate the COMBO–17 catalogs with the GTO MIPS 24 µm catalogs to identify matches within a 2″ radius. We find 1495 galaxies in the full sample, of which 464 are detected in the MIPS 24 µm catalog to 24 µm 50% completeness flux limit. Similarly, there are 1269 sources in the full sample, with 276 sources detected in the MIPS 24 µm catalog (see also the discussion in Bell et al. 2005; Le Floc’h et al. 2005). Each sample contains approximately the same co-moving volume in these redshift intervals ( Mpc3), although we find relatively fewer objects at than to the same magnitude limit. This results from large–scale clustering in this field, which is known to be underdense at (Wolf et al., 2003). While IRAC imaging also exists for most of the COMBO–17 field, we have not included it in our analysis of the galaxy stellar masses as it provides observations longward of rest–frame 2 µm, past the peak of the stellar emission (see discussion in § 6.4).
3. The Rest–Frame Optical and Near–IR Colors of DRGs
Galaxies at with a strong 4000 Å/Balmer break should have colors that satisfy the mag criterion (Franx et al., 2003). This color selection is also sensitive to starburst galaxies at whose light is heavily obscured by dust. Förster–Schreiber et al. (2004) note evidence for both galaxy types in the , , and color distributions of DRGs, which is similar to the reputed nature of –selected objects Daddi et al. (2004). We find that the full rest–frame UV to near–IR colors of DRGs provide further support for this dual population.
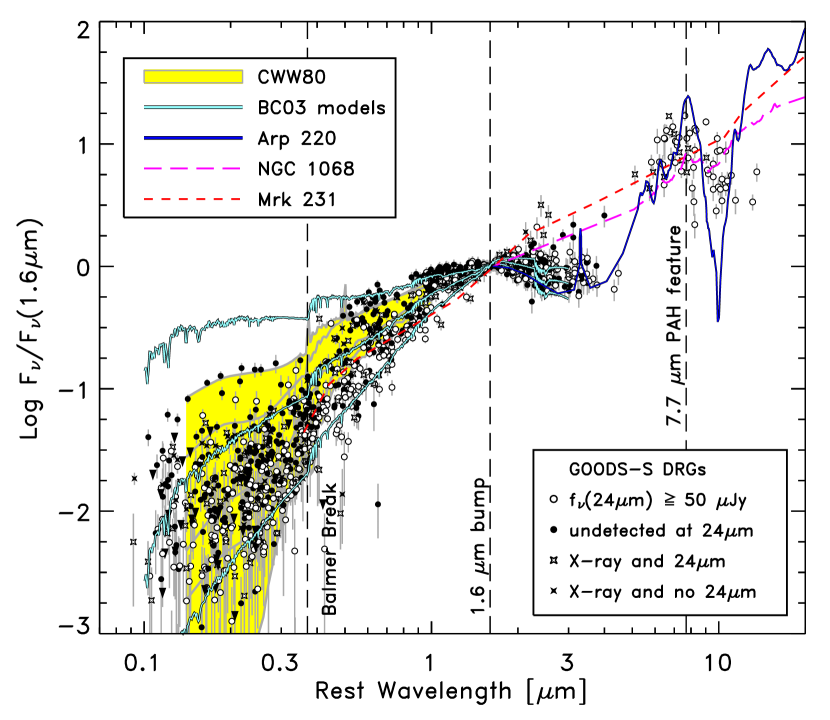
In Figure 2 we compare the SEDs of the GOODS–S DRGs with empirical and theoretical UV–IR SEDs for local galaxies. The DRGs have colors that fit within the envelope defined by various galaxy types. Many of the DRGs have colors close to the locus of that for early–type galaxies. There is also a class of DRG with optical colors redder than even the elliptical template of Coleman et al. (1980). Most of them are 24 µm sources, and they have very red UV–optical rest–frame colors, consistent with dust–obscured starbursts. The flux ratio between the 24 µm and near–IR emission is consistent with that of galaxies with massive starbursts, such as the local ULIRG Arp 220. Most of the DRGs show a prominent inflection in their SEDs at rest–frame 1.6 µm as expected in the SEDs of galaxies dominated by the light of composite stellar populations (e.g., Simpson & Eisenhardt, 1999; Sawicki, 2002). The ensemble DRG photometry in the mid–IR shows slight evidence for a peak at µm rest–frame coincident with the PAH 7.7 µm emission feature, suggesting that the emission from the majority of DRGs stems from stellar processes rather than nuclear activity. There is a slight decline in the flux density at µm, possibly consistent with silicate absorption, which is observed in both starburst galaxies and AGN. A small subset of the DRGs have red colors around µm rest–frame, a signature of AGN emission (e.g., Rieke, 1978; Neugebauer et al., 1979, and discussion in § 6.3).
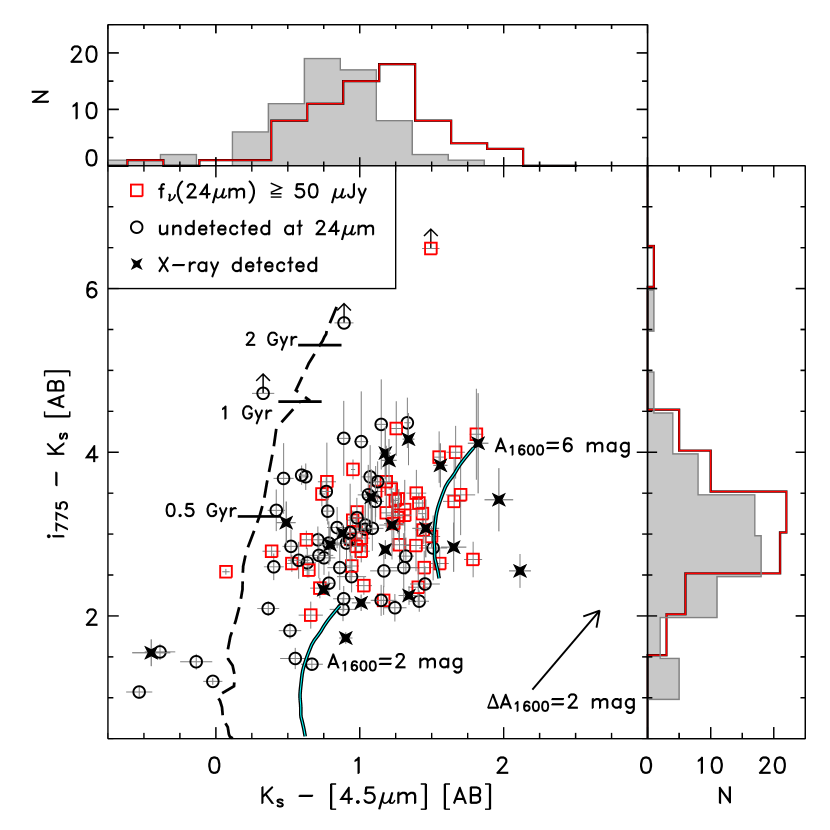
In Figure 3, we show an optical and near–IR color–color diagram to study the stellar populations and dust extinction in the DRGs. The simple models plotted in the figure bound the range of colors observed in the GOODS–S DRGs, comparable to the findings of Labbé et al. (2005) for a smaller FIRES sample. DRGs with the blue colors require a substantial population of mature stellar populations with a strong 4000 Å/Balmer break, which produces the red color. DRGs with redder colors require ongoing star formation with substantial dust extinction. Changes in the redshift of the model stellar populations from to 3.5 or 1.5 shift the expected colors by mag in mag, respectively, but have little effect on the colors. The models bound the majority of the colors of the DRGs (with the exception of several X–ray sources, whose optical to near–IR colors are possibly influenced by AGN). Thus, the colors of the DRGs imply a mix of old and young stellar populations, in some cases with substantial extinction. The MIPS 24 µm data support this interpretation. The top panel of Figure 3 shows the colors of the DRGs detected at 24 µm and those with no 24 µm detection. The DRGs with 24 µm detections have redder colors, suggesting that the emission from many DRGs is attenuated by a large dust opacity.
Of the sample of 132 DRGs with IRAC detections, there are only 6–9 DRGs (within the photometric uncertainties) that have mag and mag (including two sources with 24 µm detections and one X–ray source). These color thresholds should identify passively evolving galaxies with ages greater than Gyr over the redshift range , and these colors bound the “red and dead” DRGs in the FIRES sample from the southern Hubble Deep Field (HDF–S) (Labbé et al., 2005). Assuming the GOODS–S DRGs with these colors are uniformly distributed over the GOODS–S area and redshift range implies they have a number density of Mpc-3. This contrasts with Labbé et al. (2005) who found a higher number density, Mpc-3, for DRGs in the HDF–S assuming the same redshift interval. The difference between the DRGs in these fields is not removed by relaxing the color–selection criteria further. Based on the full photometry of our DRG sample (see § 5), we find that 15 DRGs (%) have best fit models consistent with old ages ( Gyr), little dust (), and passive evolution. They have mag and mag, both somewhat bluer than the original limits. These galaxies suggest that the number density of massive, passively evolving galaxies at is Mpc-3, still nearly an order of magnitude lower than that in the HDF–S. However, some of the discrepancy likely arises from the fact that the FIRES data achieve fainter near–IR flux densities, and parenthetically we note that two of the three candidates for passively evolving DRGs in the Labbé et al. sample have mag. Nevertheless, the difference supports the notion that these sources are highly clustered (Daddi et al., 2003), and that the HDF–S itself has an unusual overdensity of them. The low number density of massive, passively evolving galaxies in our sample supports the assertion that the density of passive galaxies is rising strongly at (see, e.g., Daddi et al., 2005a; Labbé et al., 2005).
There are few DRGs with (see also, Labbé et al., 2005). Four of the GOODS–S DRGs have and . One of these galaxies is an X–ray source at whose colors may be affected by an AGN. The remaining three have redshifts and relatively flat SEDs from UV to near–IR rest–frame wavelengths. The red color arises from a weaker 4000 Å/Balmer break apparently augmented by photometric errors or emission lines in the passbands,444van Dokkum et al. (2004) find small emission–line corrections of mag to the –magnitudes in a sample of seven, bright ( mag) DRGs. which push the –band fainter and –band brighter by small amounts, and conspire to produce mag. In general we retain these sources in the sample for completeness (although they have a negligible effect on our results). In our analysis below, we also consider a restricted sample with , thus excluding these objects.
4. Total Luminosities and Star–formation Rates of High–Redshift Galaxies
4.1. Estimating the Total Infrared Luminosities of Star–forming Galaxies
At the redshifts of the DRGs, , the Spitzer 24 µm probes the rest–frame mid–IR, which broadly correlates with the total thermal IR luminosity, (e.g., Spinoglio et al., 1995; Roussel et al., 2001; Chary & Elbaz, 2001; Dale et al., 2001; Elbaz et al., 2002; Papovich & Bell, 2002). We convert the observed 24 µm flux density to a rest–frame luminosity density at µm. We then correct these values to a total IR luminosity using the Dale & Helou (2002) IR template SEDs assuming that a given rest–frame IR luminosity density translates uniquely to a single SED template. If we instead used the IR templates of Chary & Elbaz (2001), then we would derive IR luminosities a factor of 2–3 higher relative to those of Dale & Helou for galaxies at (with smaller differences for lower–luminosity galaxies). A recent study of IR–luminous galaxies at indicates that IR–luminosities estimated from the Chary & Elbaz models have a scatter of a factor of two compared to IR luminosities derived from the radio–far-IR correlation (Marcillac et al., 2005). In contrast, the IR luminosities estimated using the Dale & Helou models provide a tighter correlation with IR–luminosities derived from the radio–far-IR correlation, with a scatter of 40%, suggesting these templates possibly better reflect reality. Some scatter is inherent in this estimation of the total IR luminosity: Chapman et al. (2003) find that the temperature–luminosity distribution in IR–luminous galaxies has a scatter of roughly a factor of 2–3 in IR luminosity for galaxies with fixed dust temperature. However, Daddi et al. (2005b) find that the (Chary & Elbaz, 2001) IR model template with fits the average SED of 24 µm–detected objects at , suggesting that the uncertainty in the templates is not severe. Nevertheless, we add 0.3 dex as a systematic error on the inferred to account for the systematic scatter in this conversion.
The uncertainty of the photometric redshifts leads to another source of uncertainty in the conversion from to the total IR luminosity. Owing to the large bolometric corrections from the mid–IR to the total IR luminosities, small changes in the redshift have a significant effect (see Papovich & Bell, 2002). We find that taking the 68% confidence range on the photometric redshifts of the DRGs leads to variations in the inferred of 0.4 dex. We add this source of error in quadrature with the uncertainty from the IR templates, bringing the total error budget on the derived IR luminosities to 0.5 dex.
Figure 4 shows the total IR luminosities of the DRGs. The completeness limit (converted to a total IR luminosity in the same way as for the 24 µm detected galaxies) is indicated in Figure 4 as the solid line. The figure also shows the total IR luminosity for the HDF–N galaxies in this redshift range derived from deeper 24 µm observations (see § 2.4). The total IR luminosities of the 24 µm–detected DRGs are , or if we exclude X–ray detected sources. The majority of these objects have IR luminosities comparable to local ULIRGs, , which if attributed to star–formation implies SFRs greater than 100 yr-1.
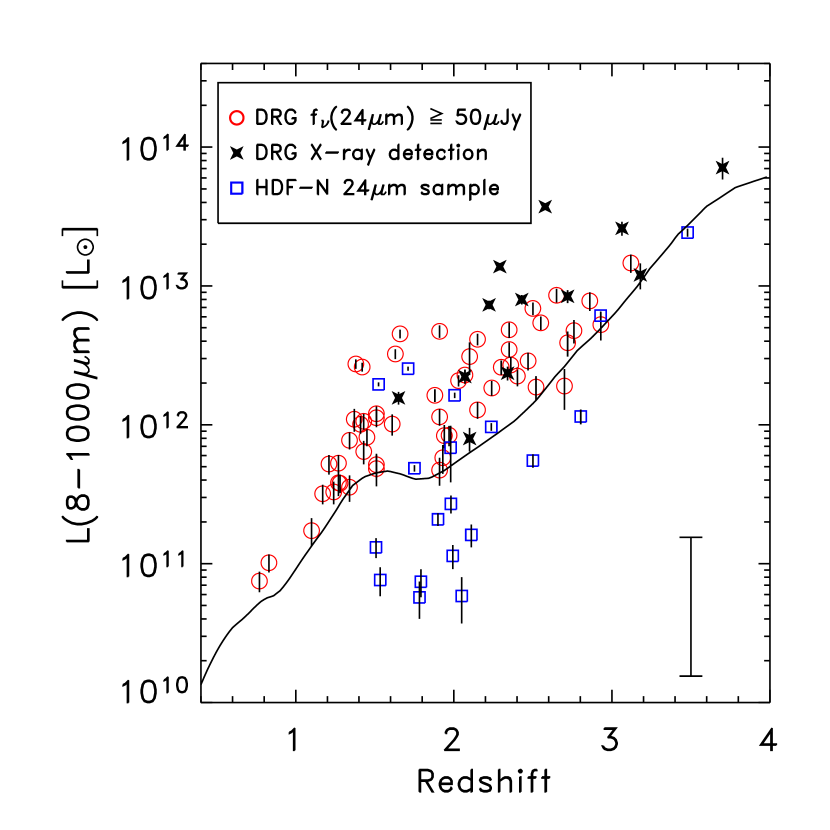
Several of the DRGs (6/152) have IR luminosities, (so–called Hyper luminous IR galaxies, HyLIRGs). These IR luminosities are comparable to those of PG quasars at , which have warm thermal dust temperatures (Haas et al., 2003). Locally, HyLIRGs — and many ULIRGs with have rest–frame optical emission spectra characteristic of Seyfert galaxies (e.g. Soifer et al., 1995; Veilleux et al., 1995; Sanders & Mirabel, 1996; Veilleux et al., 1999), and the IR emission possibly originates from AGN processes. We suspect that the most IR–luminous DRGs may have a contribution to their bolometric emission from AGN. The majority (5/6) of the DRGs with inferred are detected by Chandra, compared to the 10% X-ray–detection fraction over the whole sample. This X–ray detection fraction is consistent with the limit on the AGN fraction for the coeval sub–mm galaxies (Alexander et al., 2005), a source population that also has inferred . HyLIRGs are also present in high–redshift IRAC–selected AGN samples, and % are undetected in deep X–ray data (Alonso–Herrero et al., 2005). Therefore, the X–ray emission from AGN in many of these IR–luminous objects may be attenuated by dust below the detection limit of the surveys. However, if AGN contribute to the emission in DRGs with , then we may be overestimating the galaxies’ IR luminosity. Although the Dale & Helou (2002) IR templates include galaxies with , using a template for Mrk 231 with a known AGN and warmer dust temperature would reduce the inferred IR luminosity by factors of 2–3. To limit the effects of any bias caused by IR template uncertainties for the highest luminosity DRGs, we consider below how restricting our sample to galaxies without X–ray detections, , and IR colors indicative of AGN (see § 6.3) affects our analysis.
4.2. The Relation Between the UV Spectral Slope and the Infrared Excess
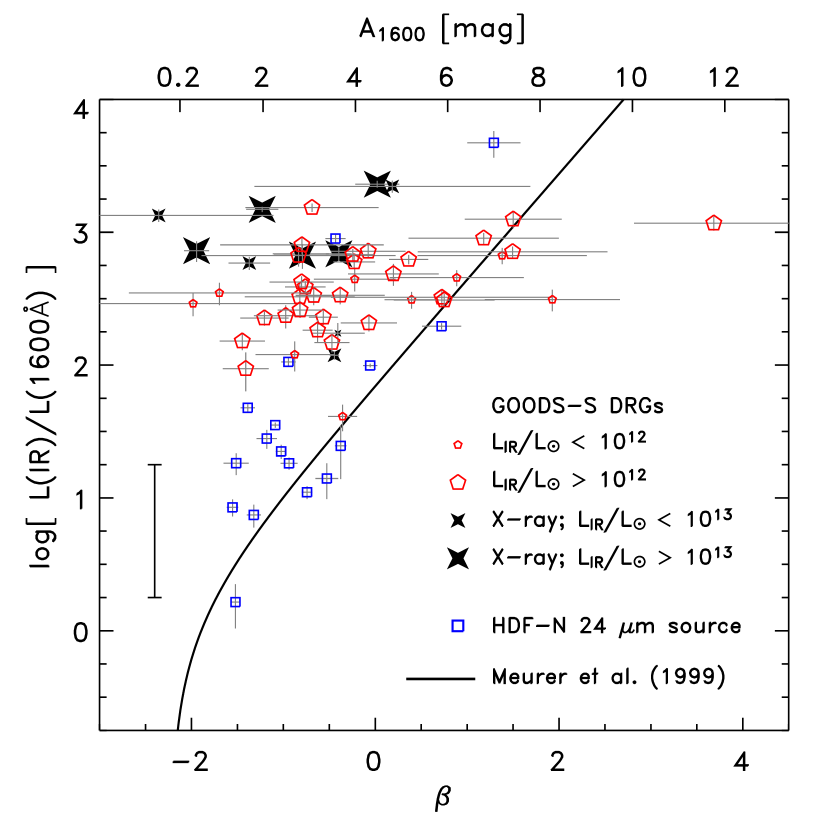
Locally, UV–selected starburst galaxies have a relation between their UV spectral slope, , where , and the ratio of their IR to UV luminosity (also termed the “infrared excess”; e.g., Meurer et al., 1999). This relation links an observed increase in with greater dust extinction of the intrinsic spectrum of a young stellar population. The dust–absorbed UV light is radiated in the thermal infrared, yielding an anticorrelation between the UV and IR. While this relation holds for a range of UV–luminous starburst galaxies (Meurer et al., 1999), it does not apply to other types of star–forming galaxies, including normal galaxies (Kong et al., 2004; Buat et al., 2005), and ULIRGs (Goldader et al., 2002), apparently due to geometry effects between the UV and IR emitting regions. Using the IR luminosities from § 4.1, we test whether the local relation between the UV spectral slope and the IR excess applies to the DRGs. We also test if it applies to other high–redshift galaxies detected by MIPS at 24 µm.
Following Meurer et al. (1999), we calibrated measurements of by comparing the UV spectral slope derived from the full UV SEDs of local starburst galaxies, , with that measured using only a broad–band photometric color, . The correction for the difference between and is necessary as starburst–galaxy spectra contain numerous absorption and emission features. A spectroscopic UV slope is fit to spectral windows to avoid these features (Calzetti et al., 1994), but they are unavoidable in measuring from broad–band colors. We fit the spectral slope, , using the UV SEDs of starburst galaxy templates (Kinney et al., 1996), which have dust extinction varying from to . We then shifted these spectra to the observed frame at , and measured the observed ACS , , , and WFPC2 colors. We measured the approximate UV spectral slope from the ACS and WFPC2 broadband photometry, , using the effective wavelengths of the filters, for the WFPC2 bands, and , , and for the ACS bands. We then fit a quadratic polynomial to the difference, , as a function of redshift.
To derive the UV spectral slopes of the DRGs, we want to span the longest wavelength baseline in the rest–frame wavelength range 1250–2800 Å. At wavelengths longer than 2800 Å there may be a significant contribution to the SED from A– and later–type stars from previous star–formation episodes (e.g., Calzetti et al., 1994). Therefore, for galaxies at in the GOODS–S field, we will use the color to measure . For galaxies with , we will instead use the , where the lower redshift bound results from the fact that below this redshift the –band probes Å. For galaxies with , we use to derive the UV spectral slope. For , there are no ACS colors that measure the UV spectral slope at Å.
For galaxies from the HDF–N with WFPC2 photometry and redshift, , we derive the UV spectral slope, , using the quadratic fit to the empirical relationship (cf., Meurer et al., 1999),
| (1) |
For the DRGs with ACS photometry we use
| (2) |
We find that the different formulae give consistent results within the photometric errors for galaxies in redshift intervals where several ACS colors can be used to measure . Using these formulae, we then calculate the UV spectral slopes of the DRGs and HDF–N galaxies using the appropriate ACS and WFPC2 bands, respectively. We also use uncertainties of the observed colors and the covariant uncertainties of the polynomial fits to estimate the error in .
Figure 5 shows the relation between and the IR/UV luminosity ratio for the high–redshift galaxies, and compares them to the local relation from Meurer et al. (1999). Many of the HDF–N 24 µm–detected galaxies at have UV spectral slopes and IR/UV luminosity ratios that lie near the local relation. These systems have IR luminosities in the range , comparable to the IR luminosities in the Meurer et al. sample. There is a trend for galaxies with higher IR/UV luminosity ratios to move away from the local relation in the sense that they have more IR luminosity than otherwise predicted from their UV luminosity and spectral slopes.
This trend in galaxies with higher IR luminosities having higher UV/IR ratios is continued for the 24 µm–detected DRGs. The DRGs span to 2 (with the exception of one object with and large photometric uncertainty). Many of DRGs with and some with have IR/UV ratios near the Meurer et al. relation. However, most of the DRGs have IR/UV luminosity ratios of more than one order of magnitude in excess of what would be predicted from their spectral slopes. That is, the total amount of star formation in these galaxies will be underestimated from their UV rest–frame luminosities and spectral slopes alone. This result is qualitatively unchanged if we restrict the DRG sample to redshifts , where the total correction factor from observed to spans a relatively narrow range compared to that for the full sample.
The DRGs occupy a very similar range of and IR/UV flux ratios as has been observed for local ULIRGs (Goldader et al., 2002). In local ULIRGs the geometry of the forming star clusters and dust is highly complex. The UV and IR emitting regions are typically displaced from one another, or “patchy”, such that the regions that dominate the UV emission are unassociated with the regions producing the large IR luminosity (as is the case for local IR–luminous galaxies with ISO IR and HST UV imaging; see Charmandaris et al., 2004). A similar situation probably holds for the 24 µm–detected DRG population. It is also plausible that the galaxies with the largest IR luminosities have more complicated geometries to account for the fact that these galaxies have the largest offsets from the local relation. Charmandaris et al. noted that for many of the local LIRGs, the ISO source is offset from the regions that dominate the UV emission by as much as several kpc, and such objects can have large IR excesses. This effect should be even stronger for ULIRGs. At redshifts typical of the DRGs, this corresponds to less than 1″, and will be unresolvable with MIPS at 24 µm.
Most of the X-ray–detected DRGs have IR/UV luminosity ratios and UV spectral slopes comparable to the rest of the DRG sample, although several have the most extreme IR/UV luminosity ratios or UV spectral slopes (, and/or ), lying away from the other DRGs. We suspect that an AGN contributes substantially to the IR emission, the UV emission, or both. In this case, the Dale & Helou (2002) IR templates may overestimate the IR luminosity in these objects (see § 4.1).
4.3. Inferring the Star Formation Rates of High–Redshift Galaxies from Bolometric Luminosities
Nearly all of the bolometric luminosity from star–forming regions is emitted in the UV and IR (e.g., Bell, 2003). Therefore, we estimate the instantaneous star–formation rates (SFRs) for galaxies in our samples using the combination of their UV and IR luminosities.
We use the SFR conversion from Bell et al. (2005a), based on the UV and IR calibration presented by Kennicutt (1998),
| (3) |
where is the total IR luminosity, and is the monochromatic luminosity at rest–frame 2800 Å interpolated from the ACS photometry. We have adjusted the SFR to correspond to a single power–law, Salpeter IMF with mass cutoffs of 0.1 and 100 . Bell (2003) tested these UV+IR–derived SFRs against extinction–corrected H and radio–derived measures, finding excellent agreement with dex scatter and no offset. Nevertheless, it should be noted that the UV and IR–calibrations are based on local galaxy correlations. Although the indications are these hold at higher redshifts (see, e.g., Elbaz et al., 2002; Appleton et al., 2004), they should be used with some caution.
This calibration explicitly assumes that star–formation processes account for the bolometric UV and IR emission. However, the presence of AGN may also contribute some (or all) of this bolometric emission from accretion processes onto supermassive black holes (SMBHs). Therefore, the SFRs derived using equation 3 may be upper limits if AGN are present (modulo uncertainties in the conversion from the 24 µm to IR luminosity).
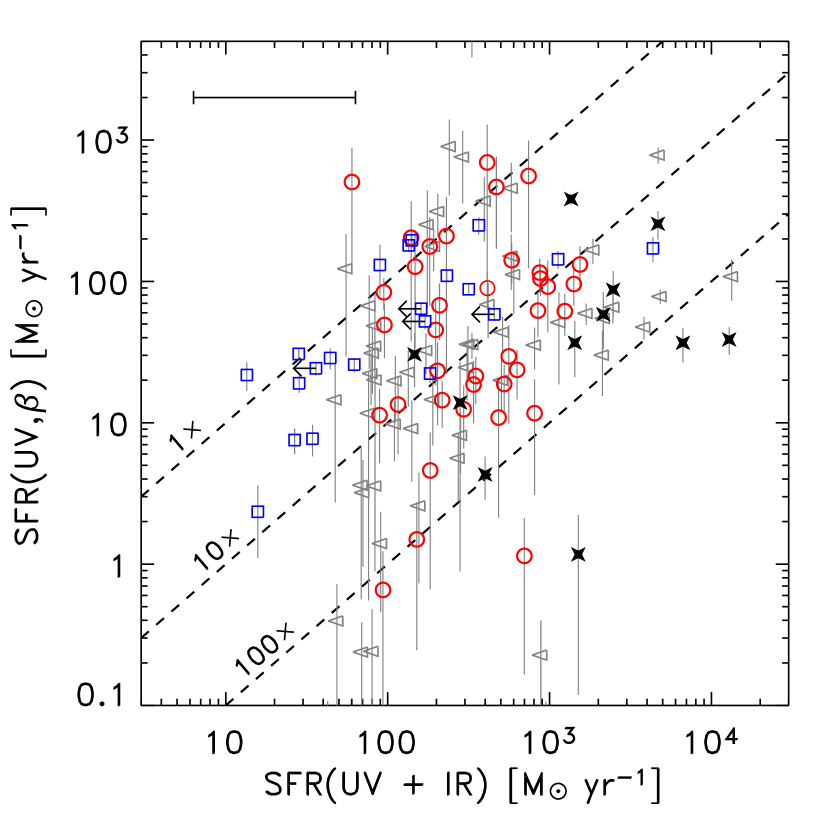
Figure 6 compares the SFRs derived from the sum of the UV and IR emission using equation 3 versus those derived using solely the UV rest–frame luminosity corrected for extinction using the derived spectral slopes (see e.g., Meurer et al., 1999; Adelberger & Steidel, 2000). To calibrate the UV–derived SFRs, we compared the 1600 Å luminosity (averaged over the range 1400–1800 Å) to the SFR from Bruzual & Charlot (2003) spectral templates over a wide variety of star–formation histories. For a single power–law Salpeter IMF with mass limits 0.1 and 100 , we find that a SFR of 1 yr-1 corresponds to a luminosity density of erg s-1 Hz-1 for galaxies with ongoing star formation for Myr (see, e.g., Madau et al., 1998). Figure 6 shows this relation for the GOODS–S DRGs, and the HDF–N galaxies. The HDF–N galaxies extend to smaller SFRs, which are in closer agreement with the rest–frame UV data. The DRGs and many of the HDF–N galaxies with larger IR luminosities have significantly larger SFRs derived from the UV+IR than those estimated from the UV only. The difference can be up to two orders of magnitude.
5. Stellar Populations and Star Formation in High Redshift Galaxies
In § 3, we showed that the UV, optical, and near–IR colors of –selected galaxies are consistent with a multi–variate population of heavily dust–enshrouded starbursts and galaxies whose rest–frame optical and near–IR light are dominated by later–type stars. Here, we extend this analysis by comparing the full photometry of the DRG and HDF–N samples to stellar population synthesis models. As in Papovich, Dickinson, & Ferguson (2001), we first consider a model of a single, monotonically evolving stellar population with a SFR that decays exponentially with a characteristic –folding timescale, . In reality, the star–formation histories of high–redshift galaxies are presumably more complex, involving stochastic events from mergers, interactions, feedback from star formation and AGN, as well as quiescent star formation (e.g., Somerville, Primack, & Faber, 2001; Nagamine et al., 2005; De Lucia et al., 2005). The models here should be considered as fiducial averages of past star–formation histories. Our definition of galaxy “age” is the time since the onset of star formation. Our monotonically evolving models continuously produce new stars with young ages (albeit at a lower rate than in the past). For example, under our definition a stellar population formed with a constant SFR has age, , while the mean age would be , and the luminosity–weighted mean age (weighted heavily toward the short–lived early–type stars) would be younger still. The definition of galaxy age also neglects all previous discrete, episodes of star–formation. Older stellar populations from past star–forming events may very well exist, but be lost in the “glare” of the nascent stars. We consider these effects by using a second model that adds a maximally old stellar population formed in a single burst at to the stellar populations formed with the simple exponentially decaying models described above (see also, Papovich, Dickinson, & Ferguson, 2001; Dickinson et al., 2003). The latter model has a maximal stellar-mass–to–light ratio. We will use the single–component and two–component models to constrain the range of stellar masses and star–formation histories.
5.1. Fitting the Models to the Photometry
We fit the galaxy photometry with the Bruzual & Charlot (2003) stellar–population synthesis models. While the metallicities of the DRGs are poorly known (Förster–Schreiber et al., 2004), van Dokkum et al. (2004) provide evidence for solar and super–solar metallicities for luminous DRGs. Shapley et al. (2004, 2005) have estimated the metallicities of massive ( ) –dropout–selected LBGs at similar redshifts to be approximately solar. Because the expected colors for the majority of massive –dropouts satisfy the DRG selection criteria (Reddy et al., 2005; Shapley et al., 2005), the solar–metallicity assumption for DRGs is also reasonable. Using different metallicities will affect our fitting results. However, the derived stellar masses vary by factors of less than 2–3 (Papovich, Dickinson, & Ferguson, 2001).
We use models with a single power–law Salpeter IMF with mass limits 0.1 and 100 . Changing the shape of the IMF affects the derived stellar masses (and other stellar population parameters as well; see Papovich et al. 2001). For example, the Chabrier, Kennicutt, or Kroupa IMFs have a turnover in the mass function below 1 solar mass and produce stellar populations with roughly the same colors but with a stellar mass of 0.25 dex lower than that for the adopted Salpeter IMF. Although these other IMFs possibly better reflect nature, we choose to use a Salpeter IMF to facilitate comparisons of our results with those in the literature. As of yet there is no reason to expect the IMF to differ strongly from that observed in local galaxies (e.g. Baldry & Glazebrook, 2003; Larson, 2005), although some empirical studies and theoretical predictions suggest a steeper IMF may be required in high–redshift massive starbursts (Ferguson et al., 2002; Baugh et al., 2005).
We generate a suite of photometry from the Bruzual & Charlot (2003) models for galaxies spanning the range of redshifts in our sample with a redshift step–size of . The models range in stellar population age from to yr in the quasi–logarithmic steps provided in the models. We include dust extinction using the Calzetti et al. (2000) law with color–excess values in steps of . For the Calzetti et al. extinction parameterization, these color excesses correspond to extinctions in the UV (rest–frame 1600 Å) of mag in increments of mag. We make the assumption that in these high–redshift galaxies the Calzetti et al. extinction law applies to the stellar populations dominating the light observed in the ACS, ISAAC, and IRAC passbands (although it may not apply to the ionizing source responsible for the far–IR emission, see § 4.2). Using different extinction laws would affect the derived stellar–population ages and extinction, but would not strongly change the inferred stellar masses (Papovich, Dickinson, & Ferguson, 2001). We also make the assumption that the stellar populations dominating the rest–frame UV to near–IR also dominate the stellar mass. If a substantial fraction of the galaxies’ stellar mass is obscured from view, then the stellar–mass derived from the SED modeling will be underestimated. We first allow for a range of star–formation histories with a SFR parameterized as a decaying exponential with a –folding time, , where the SFR at any age, , is given by . In our models, ranges from 1 Myr to 100 Gyr in quasi–logarithmic steps. Short–duration values correspond to instantaneous bursts of star formation while long–duration values correspond approximately to constant star–formation histories.
For each DRG, we fit all available bands among the ACS , ISAAC , and IRAC and data. In the model fitting, we add a % error in quadrature to the photometric uncertainties on each band to account for the fact that the population–synthesis models do not continuously sample the model parameter space (see Papovich, Dickinson, & Ferguson, 2001). The fits provide a normalization between the photometry and the model, and a minimum for each particular model with a distinct set of parameters. The IRAC or photometry because the longer–wavelength IRAC data generally have lower signal–to–noise ratios, and it is possible that at rest–frame µm PAH features or emission from obscured AGN shift into the IRAC bandpasses. Some galaxy SEDs show evidence for such features in these data (see Figure 2), and so we exclude these points to avoid any potential bias. However, we find that a majority of the best–fit models broadly reproduce the and photometry, which lends credence to the fits.
The model with the minimum chi–squared value, , is the model with the best–fit for a given set of parameters (, , , and ; the latter is derived using the stellar-mass–to–light ratio of the model, see Papovich et al. 2001). Using the difference between the chi–squared value derived for other models with a different set of parameters and , we can construct confidence regions on each parameter in the model. For each galaxy we generated up to 1000 Monte Carlo realizations for the photometry by perturbing the measured flux densities by a random value taken from a Normal distribution with a standard deviation equal to the flux–density errors. We then refit the new photometry and re-obtain best fits on all model parameters. We do not take into account errors in the photometric redshifts, which can affect the derived star–formation histories but generally have little effect on the inferred stellar masses (see Dickinson et al. 2003). We identify the values from the fit to the measured data that encompasses 68% and 95% of the best–fit values from the Monte Carlo realizations, which provides the equivalent confidence range on the model parameters for each source.
5.2. Stellar population models with single exponentially decaying star–formation histories
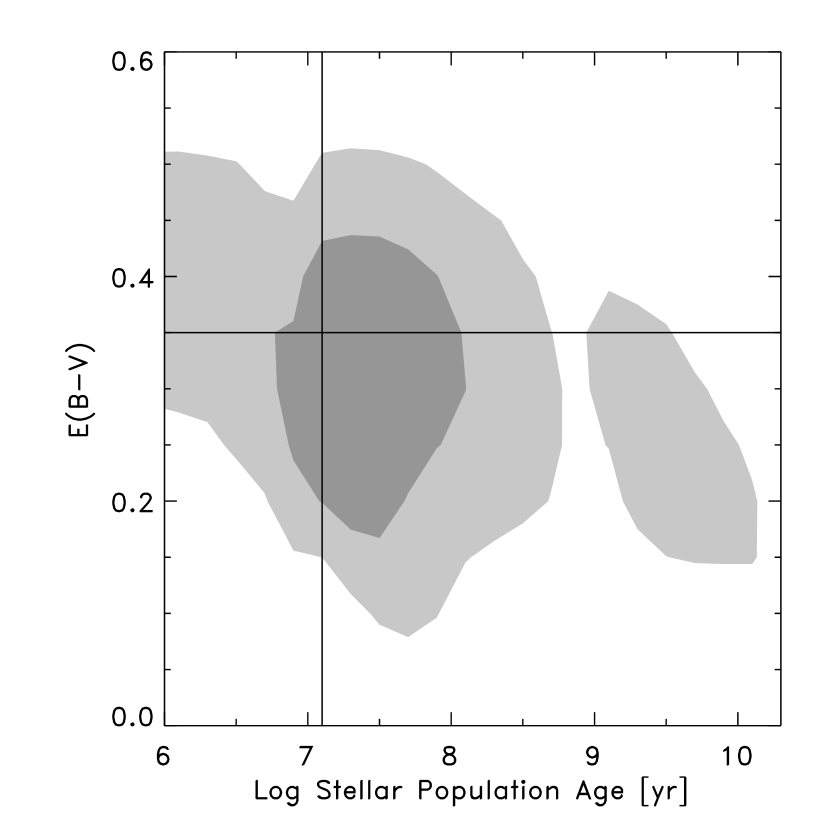
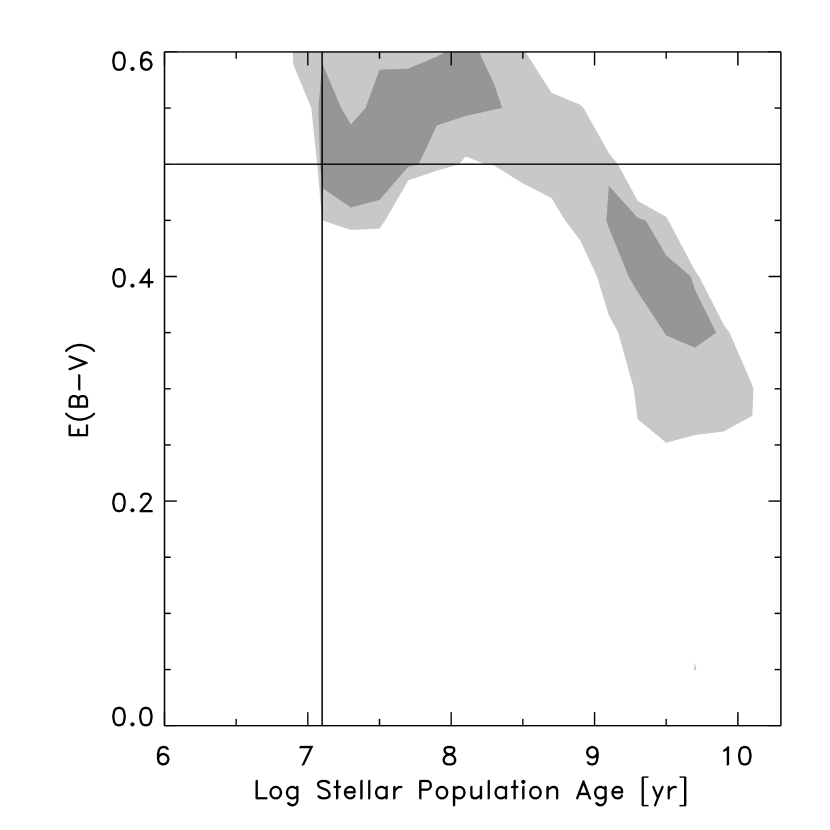
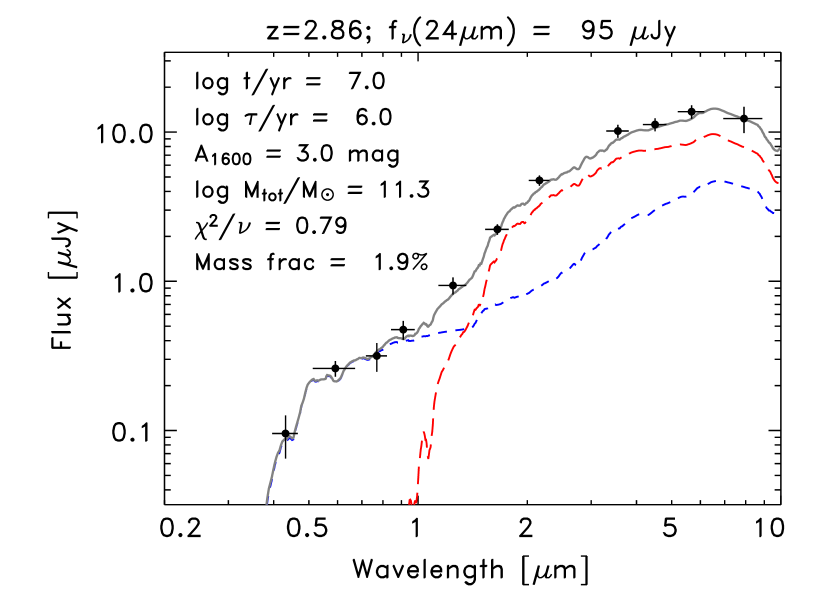
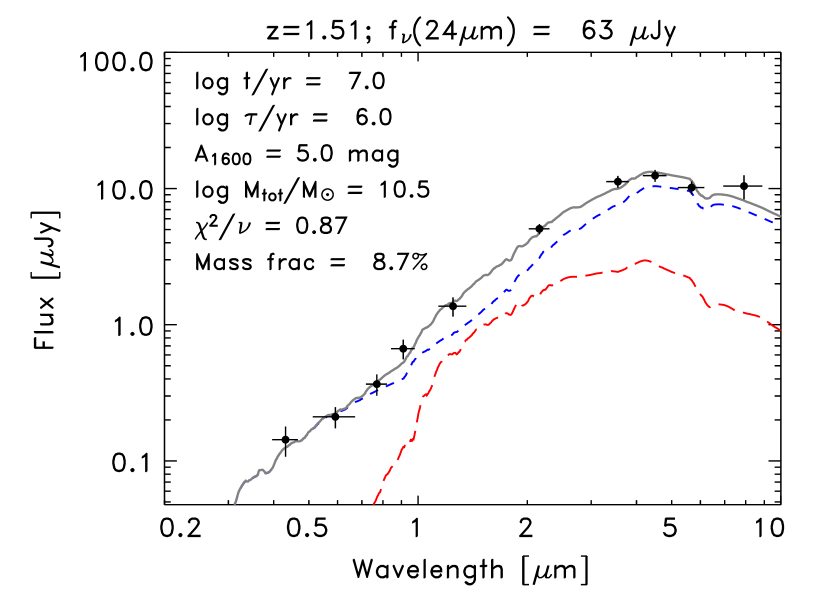
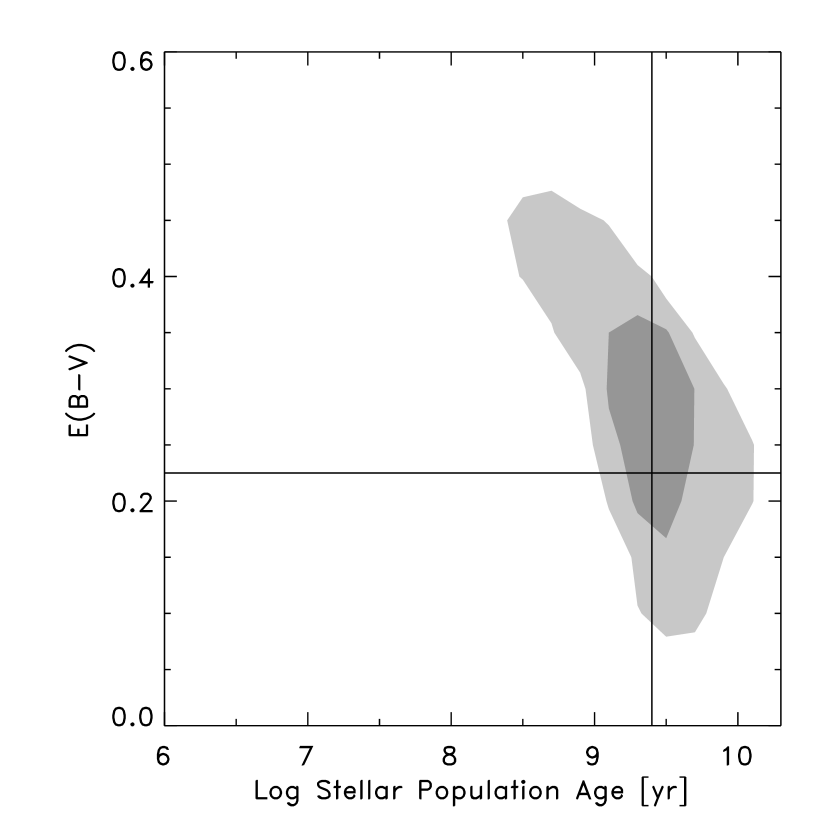
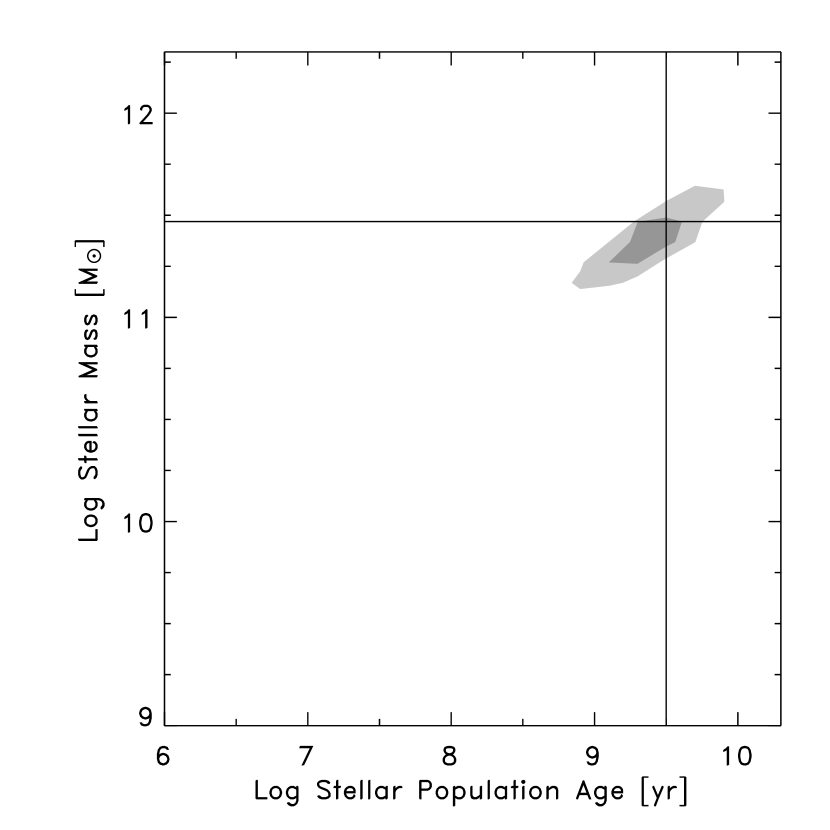
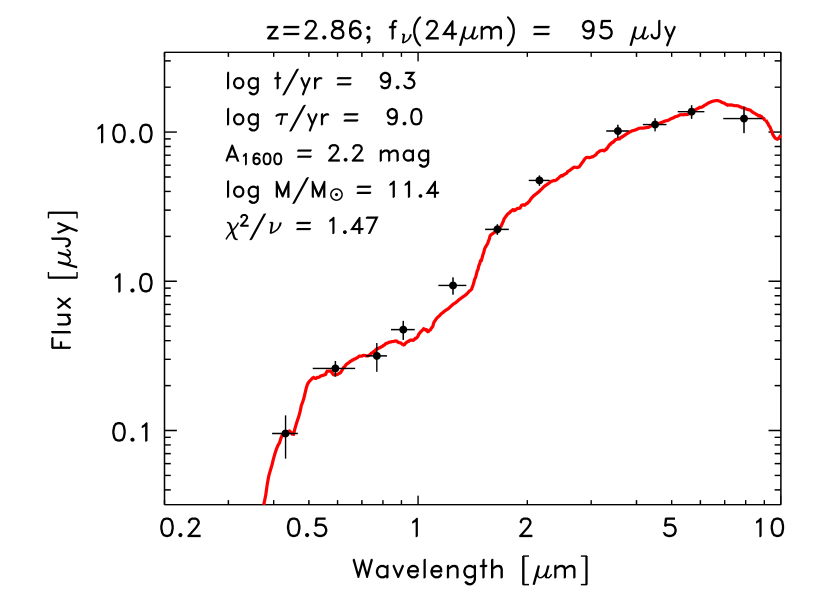
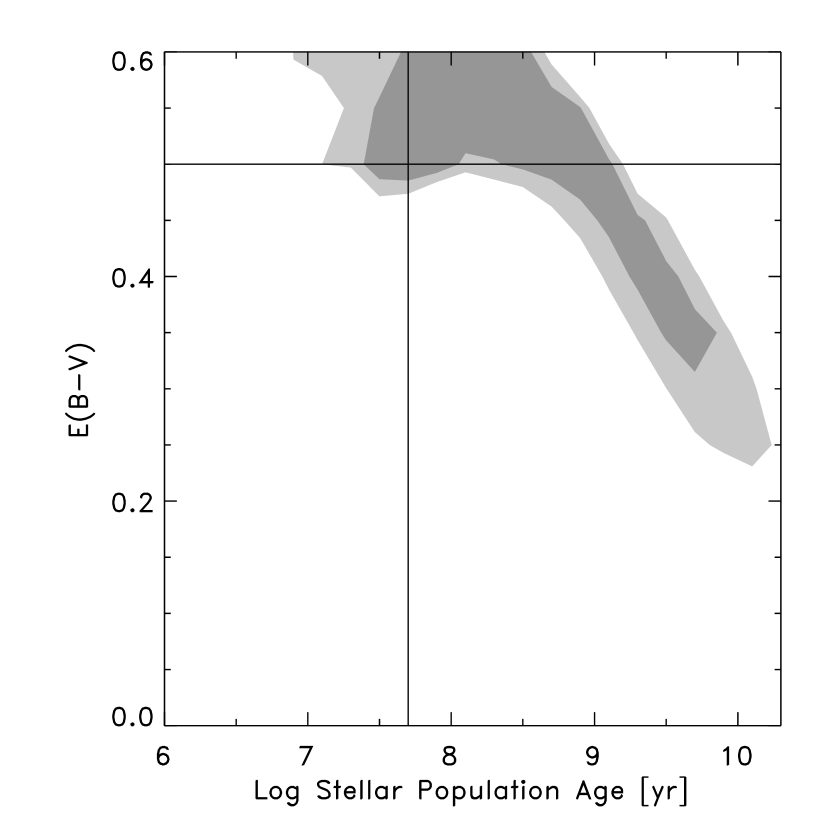
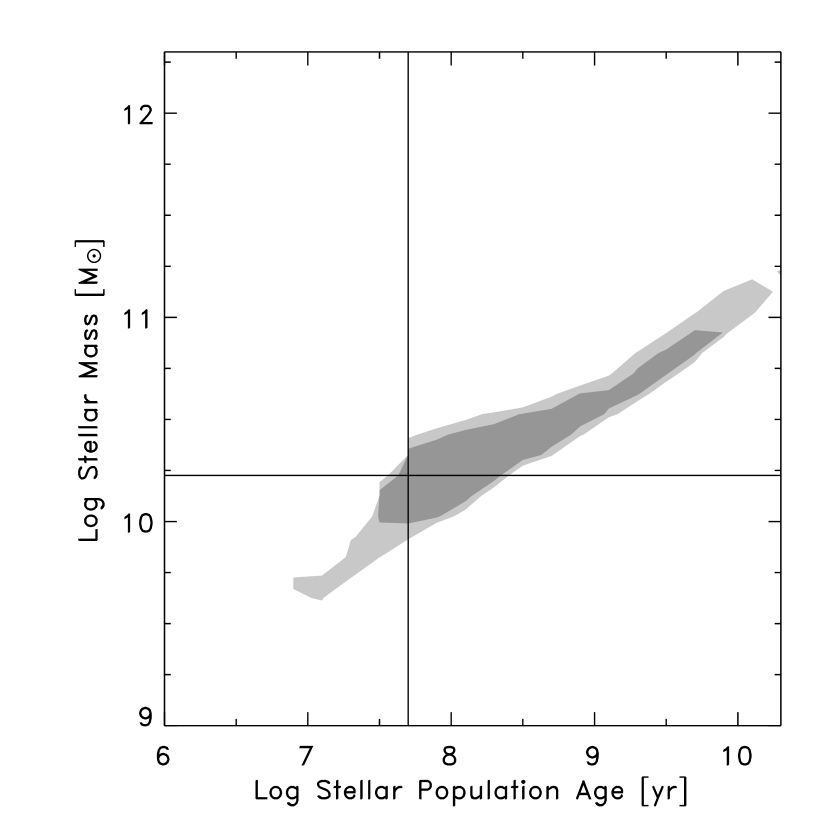
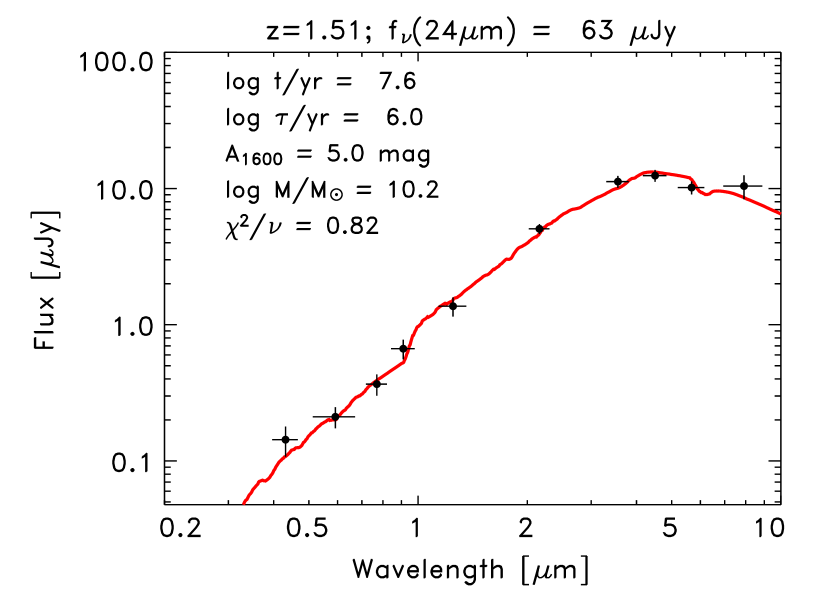
Figures 7 and 8 present examples of the results for two of the DRGs using the single–component star–formation history models. The examples are typical of the two populations identified by the mag selection. Each figure shows the probability distribution function in two–dimensional projections of the age–extinction, and age–mass planes. The figures also show the best–fit model spectrum over all parameters (i.e., the model with the minimum from all models) overplotted on the data.
Figure 7 shows a galaxy with a strong 4000 Å/Balmer break between the – and –bands presumably due to a substantial mature stellar population. The galaxy also has a small amount of ongoing star–formation that produces the rest–frame UV light. The best–fit model corresponds to a star–formation history that has undergone roughly –folding times. For this model, the galaxy formed most of its stellar mass in the past at a substantially higher SFR. The early–type (OB type) stars from the early onset of star formation have died off, and thus most of the stellar mass resides in later–type stars, which formed well in the past and now dominate the optical and near–IR rest–frame light. The best–fit model requires substantial dust extinction: mag at 1600 Å (68% confidence). The estimated stellar mass is quite robust for this set of star–formation histories. The 68% confidence range on the stellar mass ranges from , with a most–likely value of .
Figure 8 shows a galaxy with a heavily extincted recent starburst. The best–fit model to this galaxy is a young stellar population formed roughly instantaneously in a burst 40 Myr in the past. However, the 68% confidence range on the stellar–population age ranges from Myr to several Gyr. For all possible ages, the modeled star–formation history has undergone many –folding times and has substantial dust extinction, which is required to produce the red UV–to–near-IR rest–frame colors. This best–fit model requires 5 mag of extinction at 1600 Å. Owing primarily to the larger model degeneracies in the age and dust extinction for this galaxy, the stellar mass is less well constrained compared to the example in Figure 7. The 68% confidence region on the stellar mass is to , with a most–likely value of .
5.3. Stellar population models with double component star–formation histories
We also fit the DRG photometry models with a two–component star–formation history characterized by a passively evolving stellar population formed in a previous “burst” with , summed with the exponentially–decaying–SFR model above. For these models, the stellar–population age is the time since the onset of star formation in the monotonically evolving component. These models check the effects of discrete bursts on the derived parameters. Our choice of a burst at is a proxy for bursts at all times before the observed redshift, and reducing would not strongly affect our conclusions. Placing the burst at provides a limit on the maximum stellar mass because it has the maximal mass–to–light ratio possible at the observed redshift.
Figure 9 shows the results for the two–component model fits to the two DRGs described above. For the galaxy shown in Figure 7, a very young ( Myr), heavily extincted ( mag) starburst dominates the UV rest–frame emission. The optical and near–IR rest–frame emission is produced by the previously formed population, which is now quite old. However, the 68% confidence range on the age and dust extinction shows that a large region of the parameter space fits the data equally well. This is in contrast to the region permitted by the single–component model fits in Figure 7. Clearly the interpretation of the ages and extinction depend strongly on the assumed star–formation history. However, the derived stellar masses are fairly robust. The total stellar mass is nearly unchanged in this model relative to the single–component model above; the 68% confidence range is . The upper range of the confidence region drops simply because in the previous model we did not enforce the constraint that the age of the model be less than the age of the Universe at the given redshift. Such a constraint is imposed (by construction) on the two–component fits, and as a result there is less time for stellar populations to evolve, produce large mass–to–light ratios, and increase the stellar mass.

The best–fit two–component star–formation history model for the galaxy in Figure 8 shows little change compared to the single–component fit. In this case, young, reddened stars dominate the light at most wavelengths for both types of models. Thus, for galaxies of this sort, adding the second component only provides an upper limit on the inferred stellar mass content.
In general, the two–component fits for the DRGs appear more consistent with the data than the less complex, single–component models. Figure 10 compares the reduced from the fits to the single–component models to the reduced from the fits to the two–component models for all the DRGs. For many DRGs (91/152), adding the second model component to the fit has little effect on the minimum reduced , and these points lie near the unity relation indicated in the plot. For a large fraction of DRGs adding the second burst lowers the reduced minimum significantly. It is possible that some of this effect results from the fact that we have not included the contribution of emission lines in the various bandpasses. However, as noted earlier, this contribution should be small, contributing mag based on the observed emission–line equivalent widths (van Dokkum et al., 2004, 2005), except perhaps for galaxies with AGN, for which the models may not apply. Thus, in general this effect does not account for the smaller reduced values observed in our galaxies. For example, the best–fitting single–component model for the galaxy in Figure 7 deviates from the –band photometry at µm by nearly , whereas the two–component model is better able to reproduce this data point (see Figure 9).
The photometry in many of the DRGs is better represented by star–formation histories that are more complex than the simple, monotonically evolving exponentially decaying SFR. Formally, the statistic rejects the single–component model for 13/152 DRGs at the level, while not rejecting the double–component model at this significance level. In contrast, the statistic never rejects the double–component model in favor of the single–component model at this significance level. Furthermore, many of the best–fit single–component models favor stellar population ages that are older than the age of the Universe for the measured redshift (see § 6.1.2). Restricting these models to ages less than the age of the Universe increases the minimum value, making the difference between single– and two–component fits more pronounced. We interpret this behavior to indicate that in general the DRG population has star–formation histories that are more complex than simple monotonically evolving stellar populations. A similar scenario has been suggested based on modeling the SEDs of LBGs at these redshifts (e.g., Sawicki & Yee, 1998; Papovich, Dickinson, & Ferguson, 2001; Papovich et al., 2004a; Shapley et al., 2005), and is likely consistent with hierarchical models (De Lucia et al., 2005; Nagamine et al., 2005).
6. Discussion
The ensemble properties of the DRGs span a range of the stellar–population model parameter space. Broadly speaking, the mag color selection identifies galaxies whose rest–frame optical and near–IR light is dominated by later–type stars, and galaxies whose light is dominated by heavily extincted starbursts (Franx et al., 2003). In this way, it is not dissimilar to traditional or selection criteria for EROs, but it tends to pick out objects at higher redshifts. In addition, roughly % of the DRGs are luminous in X–rays, implying that some of the UV to IR emission may stem from SMBH accretion processes rather than star formation. Here we consider the implications that our analysis has for star–formation in massive galaxies at high redshifts. We briefly consider AGN activity in these galaxies, with a more detailed analysis to be presented in L. A. Moustakas et al. (in preparation).
6.1. Stellar Populations and Star–Formation Histories of DRGs
6.1.1 Dust Extinction
The best–fitting single–component DRG models span extinctions of mag at 1600 Å. The mean dust extinction from the best fits to the ACS to IRAC photometry is mag, with a standard deviation of 1.5 mag. The mean is substantially larger than that inferred for UV–selected LBGs at comparable redshifts, for which Papovich, Dickinson, & Ferguson (2001) and Shapley et al. (2001) find average extinction values of 1.2 and 1.6 mag at 1600 Å, respectively. Förster–Schreiber et al. (2004) find that DRGs in the FIRES fields have median extinction of mag at 1600 Å for the Calzetti extinction law (averaged by number), but restricted to models with constant SFR, and these values change little after including Spitzer/IRAC data (Labbé et al., 2005). Although on the surface this appears at odds with our findings, Förster–Schreiber et al. found that using exponentially declining models reduces the measured extinction by roughly a factor of two, in better agreement with our results.
To study differences between the sub–populations of DRGs (i.e., those with substantial mass in late–type stars and those dominated by highly dust–extincted starbursts), we divided the sample into subsets with and . We have used the results from the fits to the single–component models for this selection, but there is little change if we use the two–component models. This division point is the approximate upper bound on values inferred for UV–selected LBGs (largely as a result of the UV–selection itself; e.g., Adelberger & Steidel 2000).
DRGs with comprise roughly 40% (61/152) of the full sample. These galaxies have a mean redshift of with standard deviation . The mean dust extinction is 4.6 mag at 1600 Å for the Calzetti law. We estimate the resulting IR luminosities from these extinction values using the empirical relations between the UV luminosity, extinction, and far–IR luminosity (Meurer et al., 1999; Calzetti et al., 2000). In these galaxies, the observed UV luminosities and model extinction (using the 68% confidence limits) correspond to IR luminosities of . These are generally less than the 24 µm–derived IR luminosity or the 24 µm upper limit for undetected galaxies). However, because the 68% confidence interval on galaxy extinction is large, mag, in roughly 50% of the objects the extinction from the upper 68% confidence bound yields a comparable or exceeding the 24 µm value. This is consistent with the fraction of DRGs in figure 5 with IR/UV ratios and UV spectral slopes near the local relation from Meurer et al. (1999).
The DRGs with best–fit have a mean extinction of 2.0 mag at 1600 Å. Later–type stars dominate the rest–frame optical and near–IR light in these galaxies, while the UV rest–frame emission stems from small amounts (by mass) of ongoing star–formation with low to moderate extinction. The mean redshift for the DRGs with is , noticeably larger than that for the DRGs with higher extinction. This higher redshift range arises because galaxies with a strong Balmer/4000 Å break satisfy the mag selection only for as this break is moving through the and bands (Franx et al., 2003), whereas heavily reddened galaxies can enter the sample at lower redshifts. The lower estimates from the model fitting would smaller IR luminosities relative to the DRGs with higher extinction described above. Unlike the case for the higher–extinction DRGs, the IR–luminosity for the the DRGs with are less than the 24 µm–derived by factors of . Therefore, the observed 24 µm emission in DRGs with relatively low dust extinction from the SED modeling does not originate only from the extincted stellar populations that dominate the UV and optical rest–frame light. These galaxies require either additional embedded star formation, or an obscured AGN, or both, and these obscured components contribute negligibly at bluer wavelengths.
6.1.2 Stellar Population Ages and Star Formation Histories
Our stellar–population modeling of the DRGs is more sensitive to the ratio of model age, , to the star–formation –folding time, , than on or individually, and we discuss them simultaneously. From the models with a single, exponentially decaying SFR the median age is 1.1 Gyr, and on average a DRG has undergone –folding times. In an analysis of the 34 DRGs in the FIRES fields, Förster–Schreiber et al. (2004) tested constant star formation histories () and found median stellar population ages of Gyr. The lower median ages for our models result because they favor star–formation histories with a smaller number of –folding times than the constant star formation histories. Indeed, Förster–Schreiber et al. also considered models with Myr, for which they derive a median age of 1 Gyr, implying . This is consistent with our result taken over a wider range of star–formation histories.
There are 17 DRGs (% of the sample) where the lower limits from the 68% confidence range from the single–component–model fits are older than the Universe. Of these, nine (53%) show indications of AGN activity either because they are detected in the Chandra data, they have , and/or they have have IRAC colors satisfying the AGN selection of Stern et al. (2005, see also § 6.3). We suspect an AGN may influence the observed photometry and the model fits. The remaining DRGs have SEDs qualitatively similar to the example shown in Figure 7, but the model fits favor older ages. In all these cases the two–component model fits have solutions with ages less than the age of the Universe within the 68% confidence interval, and are thus more physical. Moreover the reduced minimum values for the two–component fits are significantly improved for more than half of these, implying such models are better realizations of the data.
Thus, including the constraint that the age of the model stellar population be less than that of the Universe favors models with more complicated star–formation histories than the single–component, monotonically evolving models. This reinforces our conclusion that the two–component models better describe the star–formation histories of the DRGs based on their lower reduced values (see § 5.3). The real star–formation histories are probably even more complex. It is unlikely that the star–formation histories of DRGs are consistent with scenarios where all their mass formed in the distant past with subsequent passive evolution (see, e.g. Cimatti et al., 2002b). Massive galaxies at these redshifts continue forming stars up to the epoch we are observing them. Recent semi–analytic prescriptions of the star–formation histories of massive galaxies typically involve both stochastic “burst” modes, and quasi–continuous “quiescent” modes of star formation (e.g., Somerville, Primack, & Faber, 2001; De Lucia et al., 2005; Nagamine et al., 2005), qualitatively consistent with our analysis. It seems that the earliest star–formation episodes in DRGs did occur in the distant past, and that much of their stellar mass was assembled much earlier than the epoch at which we are observing them. Taking the median age of the stellar population as a fiducial value for the onset of star formation, DRGs began forming stars at . Their progenitors may be the star–forming galaxies observed at those earlier epochs as UV–dropouts at (e.g., Papovich et al., 2004a).
6.1.3 Stellar Masses
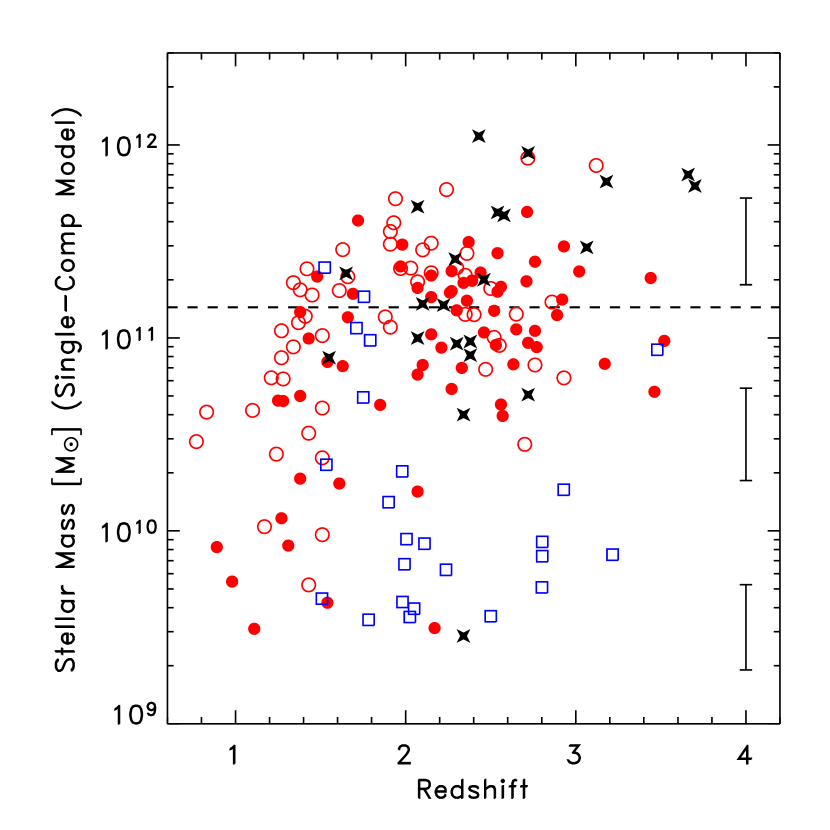
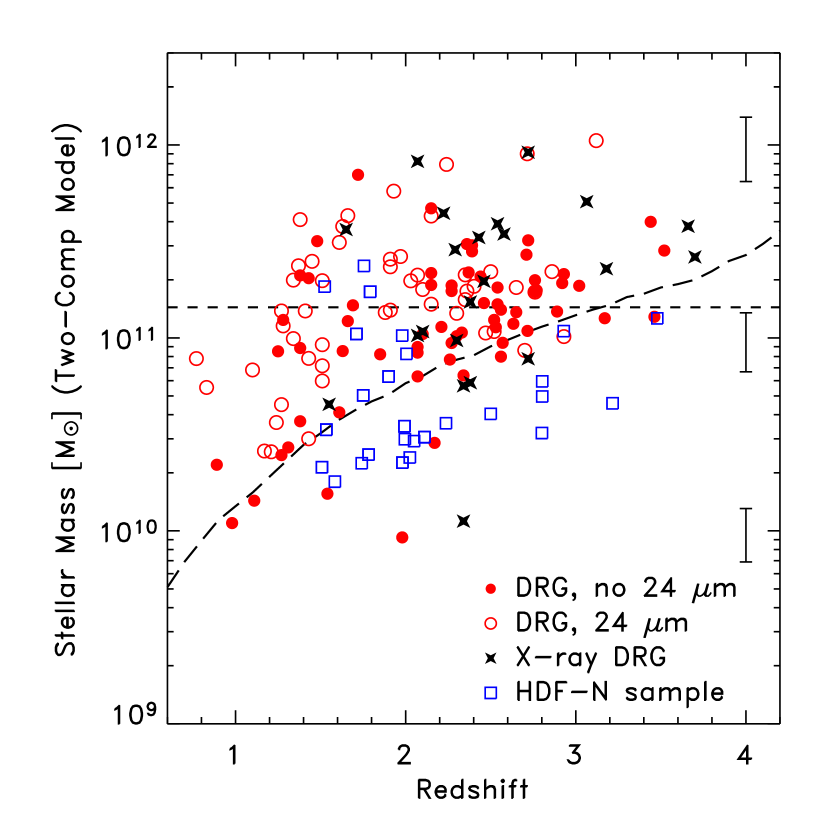
The SED modeling provides relatively robust estimates of the stellar-mass–to–light ratios of these galaxies, providing good measures of their stellar masses. Figure 11 shows the distribution of the stellar masses for the single– and two–component star–formation histories for both the DRGs and the galaxies in the HDF–N. Typical errors are 0.1–0.3 dex (for a given IMF and metallicity).
The median stellar masses for the GOODS–S DRGs are 1.1 and 1.7 for the single– and two–component star–formation history models, respectively. There is little difference between the stellar masses of DRGs detected and undetected at 24 µm. The interquartile range (containing the inner 50% of the sample) spans from 0.13 to for the single–component models, and from 0.29 to for the two–component models. The main effect of the two–component models is to increase the masses of objects with low masses from the one–component models. Higher mass objects typically have larger stellar-mass–to–light ratios, , and are less effected because the uncertainties on are smaller (e.g., Dickinson et al., 2003). For the 34 DRGs in the FIRES fields, Förster–Schreiber et al. (2004) found median stellar masses of , with an interquartile range of (using different assumptions for the star–formation history). Because our models are taken over a wider range of star–formation histories, we expect our stellar masses to be slightly lower with respect to those derived for constant star–formation models (Förster–Schreiber et al. 2004). Thus the range and average of the DRG stellar–mass distribution seem generally consistent with those in the FIRES fields (see also Labbé et al., 2005). The tail of lower–mass DRGs in our sample probably also arises from the greater number of objects with lower redshifts. Restricting our sample to a higher minimum redshift would further increase the lower–bound of our interquartile range.
The long–dashed line in Figure 11 shows the stellar mass limit for a passively evolving stellar population formed in a single burst at and with mag. Our DRG selection is approximately complete in stellar mass for passively evolving galaxies with to , because no galaxy can have a mass–to–light ratio higher than a maximally old stellar population. Bluer galaxies with and lower mass–to–light ratios such as UV–luminous LBGs could be excluded by the mag selection. However, Shapley et al. (2005) infer that the majority of LBGs at with would satisfy mag (see also, Reddy et al., 2005). At , the color selection may miss some passively evolving galaxies as the Balmer/4000 Å break shifts to wavelengths below the blue–edge of the –band filter (Daddi et al., 2004). We consider the DRG selection roughly complete in stellar mass to over the majority of the redshift range .
Based on the fits to the single–component models, the integrated DRG stellar mass density for objects at with is Mpc-3. This increases to Mpc-3 using the stellar masses derived from the two–component model fits. In both cases the uncertainties are estimated using a bootstrap resampling of the dataset, which constructs random samples of DRGs with the sample size taken from the Poisson, counting uncertainties, and stellar masses drawn from the measured distribution (with replacement) modulated by the inferred stellar–mass errors. However, many of the DRGs show evidence for an AGN, either based on X–ray detections, IR luminosity, or rest–frame near– and mid–IR colors (see § 6.3). These objects have relatively higher derived stellar masses (Figure 11), which could imply that AGN tend to reside in the most massive galaxies at these redshifts. Alternatively it could be that AGN may contribute to the rest–frame UV–to–near-IR emission, leading to unduly larger stellar mass estimates. To bound this effect, we recalculate the stellar mass densities excluding all DRGs with X–ray detections, , or with AGN–like rest–frame near–IR colors. In this case, the stellar mass density decreases to and Mpc-3 for the single– and two–component models, respectively. In this case, the DRGs contribute 25–70% to the total stellar mass density integrated over all galaxies at , in reasonable agreement with the conclusions of Rudnick et al. (2003) and Fontana et al. (2003).
6.1.4 Star–Formation Rates and “Dead” Objects
The 24 µm–detected DRGs span SFRs from yr-1, excluding those objects directly detected in the Chandra data (see Figure 6). The mean SFR for these sources is yr-1, with a systematic uncertainty in the 24 µm to SFR conversion of dex. This value includes objects with or rest–frame near–IR colors indicative of AGN (see § 6.3). Excluding these objects, the average SFR of the 24 µm–detected DRGs drops to yr-1. The mean SFR for the complete DRG sample (including those not detected with MIPS at 24 µm) is lower still. Taking the conservative limit that the 24 µm–undetected DRGs have no ongoing star formation, the mean SFR is yr-1 excluding the X–ray sources. This does not change if we also exclude those sources with infrared luminosities or colors indicative of AGN.
The mean SFR for the DRGs reported here is somewhat larger, but comparable to recent measurements of the “stacked” X–ray and sub–mm emission from DRG samples. Rubin et al. (2004) and Reddy et al. (2005) find the average SFR is yr-1 based on statistical X–ray detections for DRGs with AB mag. The inferred mean SFR for the various DRG populations is strongly dependent on the limiting –band of the survey, and in the case of the X–ray derived measurements, on indications of AGN activity within the sample (see the discussion in Reddy et al. 2005). However, the X–ray SFR calibration has a systematic uncertainty on the order of a factor of five (Ranalli et al., 2003; Persic et al., 2004), owing to assumptions on the formation timescales of X–ray binaries in starbursts. A higher SFR–to–X-ray luminosity calibration may be appropriate for galaxies in the more intense starbursts such as those for the DRGs (Persic et al., 2004; Teng et al., 2005), so some scatter is expected in the conversion is expected. Knudsen et al. (2005) report an average SFR of 130 yr-1, based on a stacked sub–mm 850 µm flux density of DRGs with AB mag, but is sensitive to the assumed average dust temperature (e.g., Chapman et al., 2005). Their sample extends to DRGs roughly a magnitude deeper in the –band, and Reddy et al. (2005) demonstrate that the mean SFR of all types of star–forming galaxies at (including DRGs) decreases with decreasing –band flux density (see also Daddi et al. 2005b). Given the systematic uncertainties in the SFR calibrations, and the varying limiting magnitudes of the different DRG samples, we conclude that the mean SFR we derive using the MIPS 24 µm data for the GOODS–S DRGs is in broad agreement with these other values. The “typical” DRG is forming stars at rates in excess of yr-1.
We can set an upper limit on the lifetime of a starburst in the DRGs at the gas–consumption timescale, defined to be the ratio of the gas mass to the SFR. For a massive galaxy with a molecular gas mass of (comparable to the gas reservoirs of the massive radio galaxies, De Breuck et al., 2003, 2005; Greve, Ivison, & Papadopoulos, 2004), the gas–consumption timescale is yr for SFRs of yr-1 (although these timescales would be shorter for lower gas masses, such as those in local ULIRGs, see Downes & Solomon 1998). This timescale is generally shorter than or comparable to the median ages we derive for the DRGs (consistent also with findings in Förster–Schreiber et al. 2004). Recent theoretical work suggests that high–redshift, massive galaxies quasi-continuously form stars at high rates for periods of 1–2 Gyr, with shorter periods ( Myr) of boosted star formation (Nagamine et al. 2005; Finlator et al. 2005; De Lucia et al. 2005). If the DRGs sustain these the high SFRs for more than yr, then they will exhaust their gas supply unless fresh cold gas is repeatedly or continuously accreted. Kereš et al. (2005) predict that cold–gas accretion may dominate in massive galaxies at high redshifts, which may advocate such a scenario exists for the massive DRGs.
Assuming a lifetime of yr, a galaxy with a SFR of yr-1 would assemble in stars. If LBGs are forming stars rapidly and/or experiencing recurrent bursts at redshifts higher than that of the DRGs, , then eventually they will assemble a sufficient population of late–type stars to dominate the optical to near–IR rest–frame light. It thus takes of order 1 Gyr to produce a DRG (unless high–redshift starbursts have an IMF weighted towards higher–mass stars, in which case even more time is required; Ferguson et al. 2002). Under these star–formation histories, the first progenitors of DRGs at z 2 to 3 should appear as starburst galaxies at z 3 to 5. Massive star–forming galaxies appear to exist by from UV–dropout surveys (Eyles et al., 2005; Yan et al., 2005), and such objects could be forming the stellar populations that evolve to become the old components at the redshifts of the DRGs.
Based on the model fits, we find several candidates among the DRGs for passively evolving galaxies at high redshifts (see also § 3). There are 15 DRGs with best–fit models that favor older ages ( Gyr) that have undergone several –folding times () with low dust extinction () and no X–ray or 24 µm emission. Massive, “dead” DRGs are either galaxies that are between starbursts but already with a massive old stellar population, or galaxies that have completed the intense phase of their assembly. These galaxies span , and have and (see also Figure 3 and discussion in § 3). These objects contribute Mpc-3 to the global stellar mass density at these redshifts. Such massive, “dead” objects make up only a fairly low fraction of the stellar mass density (%) integrated over all galaxies at , and therefore are relatively rare at these redshifts. In contrast, early–type, massive ( ) galaxies account for % of the total local stellar–mass density for the stellar–mass function of Bell et al. (2003, see also Baldry et al. 2004). Thus, the fraction of the global stellar–mass density in such galaxies increases threefold from to 0.
6.2. The Relation between Star Formation and Stellar Mass in Galaxies at
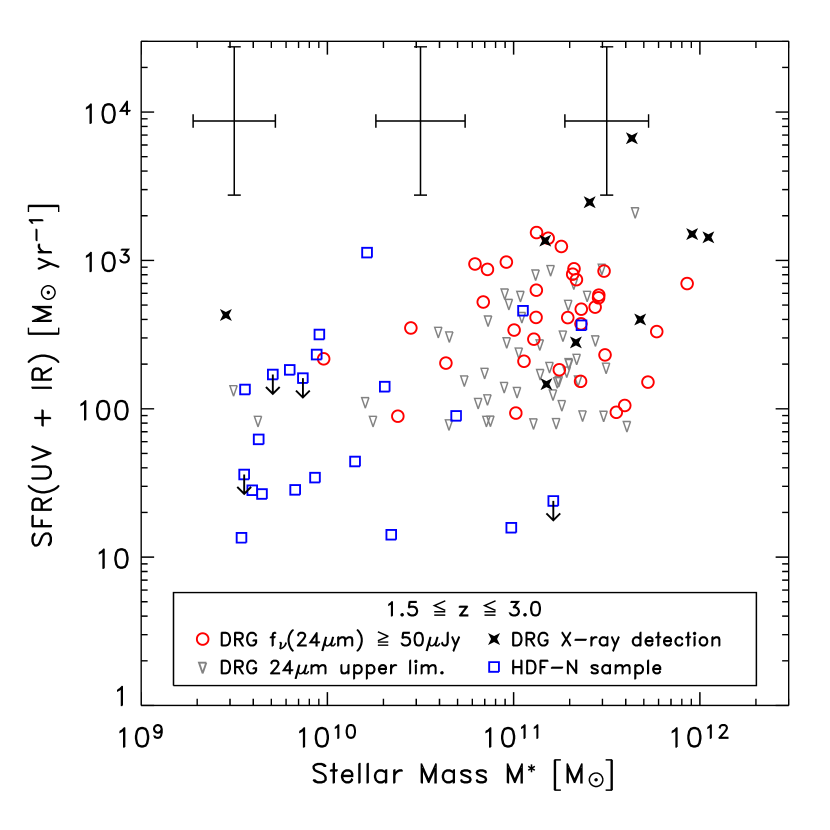
Figure 12 shows the SFRs as a function of the stellar mass for the DRGs and the HDF–N sample. The figure shows the stellar masses derived from the models with single–component star–formation histories, although using the two–component fits does not strongly change any of the conclusions. DRGs not detected at 24 µm by MIPS are shown as upper limits assuming that their 24 µm flux density is less than the 50% completeness limit, Jy. We also restrict the DRG and HDF–N samples to those objects with , where we are approximately complete for massive galaxies. Furthermore, restricting the sample to removes few galaxies from the samples, and facilitates the contrast with the lower–redshift samples (see § 6.4).
The DRGs have higher stellar masses and SFRs relative to the HDF–N 24 µm–selected sample, owing primarily to the fainter flux limit of the 24 µm data in the HDF–N. There is a weak correlation between SFR and stellar mass, although this trend may be softened if the SFRs of DRGs with upper limits are in fact lower. Objects with stellar masses greater than span 1.5 dex in SFR, excluding the X-ray–detected DRGs with inferred . The upper envelope of SFRs decreases for lower mass galaxies, and such objects should be detected in our data if present. Therefore, at these redshifts galaxies with the highest stellar masses also appear to be experiencing the highest SFRs.
6.3. Growth of Supermassive Black Holes in Massive, High–Redshift Galaxies
Many of the DRGs with the highest stellar masses and SFRs are detected in the deep X–ray data. Twelve of the 13 X–ray detected DRGs with have X–ray to optical flux ratios, (the remaining one has ), and these imply the presence of an AGN with erg s-1 for DRGs at (e.g., Hornschemeier et al., 2001; Alexander et al., 2003). In addition, Worsley et al. (2005) conclude that as much as 40% of the hard X–ray background stems from heavily obscured AGN at . Recent Spitzer IR observations are finding many AGN candidates whose X–ray, UV, and optical emission is heavily obscured by gas and dust, and missed in deep X–ray surveys (e.g., Alonso–Herrero et al., 2005; Donley et al., 2005). Alonso–Herrero et al. (2005) find that as many as 50% of MIPS 24 µm sources with red IRAC colors are not detected in the deep X–ray data. This suggests that AGN may be hidden behind sufficiently Compton–thick material that none of the direct X–ray emission escapes (Brandt & Hasinger, 2005). Models of the X–ray background support this possibility (Gilli, 2004).
At , galaxies dominated by the light from stellar photospheres should have relatively blue colors (see § 3). Alternatively galaxies dominated by AGN emission in the rest–frame near–IR should have redder IRAC colors (see, e.g., Rieke, 1978; Neugebauer et al., 1979; Lacy et al., 2004; Alonso–Herrero et al., 2005; Stern et al., 2005). Lacy et al. (2004) found that Seyfert 1 galaxies and obscured AGN have red colors, similar to the red rest–frame colors of Parkes Quasars in 2MASS at (Francis et al., 2004). Similarly, of the non–X-ray detected DRGs with IRAC counterparts, roughly 25% (26/106) satisfy the IR color selection for AGN of Stern et al. (2005). Upon inspection of their individual SEDs, most are plausible AGN candidates with red IRAC colors. Four of these DRGs are star–forming objects at whose IRAC colors mimic those of AGN candidates at lower redshift. These galaxies are optically fainter and have higher redshifts than typical galaxies in the Stern et al. sample, and are an additional source of contamination in IR selection of AGN. An additional 10 of these DRGs have and their SEDs are consistent with heavily extincted starbursts whose magnitudes may be augmented by the 3 µm PAH emission feature.555Stern et al. (2005) find that 17% of objects satisfying their IRAC color–color selection are spectroscopically classified as galaxies, roughly consistent with the galaxy contamination here, modulo differences in survey limiting magnitudes. Excluding these 14 objects, approximately 10% (10/125) of the X-ray–undetected DRGs may have dust–enshrouded AGN that contribute some fraction of the rest–frame near– and mid–IR light. Combined with the 15% of X–ray–detected DRGs, perhaps a quarter of the DRG population host AGN, which implies they are actively growing their SMBHs.
The X-ray–detected fraction of DRGs apparently rises with increasing IR luminosity (50% at ), a trend also seen in the analysis of X–ray emission from high–redshift sub–mm galaxies (Alexander et al., 2005). The GOODS–S field lacks deep sub–mm observations, which would allow us to explore any direct overlap between these coeval populations. Locally, the most luminous ULIRGs and HyLIRGs frequently host AGN sufficiently powerful to affect their global properties (Veilleux et al., 1995). If the IR–luminous DRGs are similar, then the high incidence of AGN is expected, especially for those with inferred . This implies that the massive galaxies at these epochs may be both assembling their stellar populations and growing SMBHs (see also L. Moustakas et al. in preparation). Locally, the space density of ULIRGs is Mpc-3 (Sanders et al., 2003), while the DRGs with ULIRG–like luminosities have a space density of Mpc-3 — an increase by a factor of 600 (and similar to the conclusion for –selected objects, Daddi et al., 2005b). Thus, such objects are a much more common phenomenon at high redshift.
6.4. Evolution of the Star Formation Rate as Function of Stellar Mass
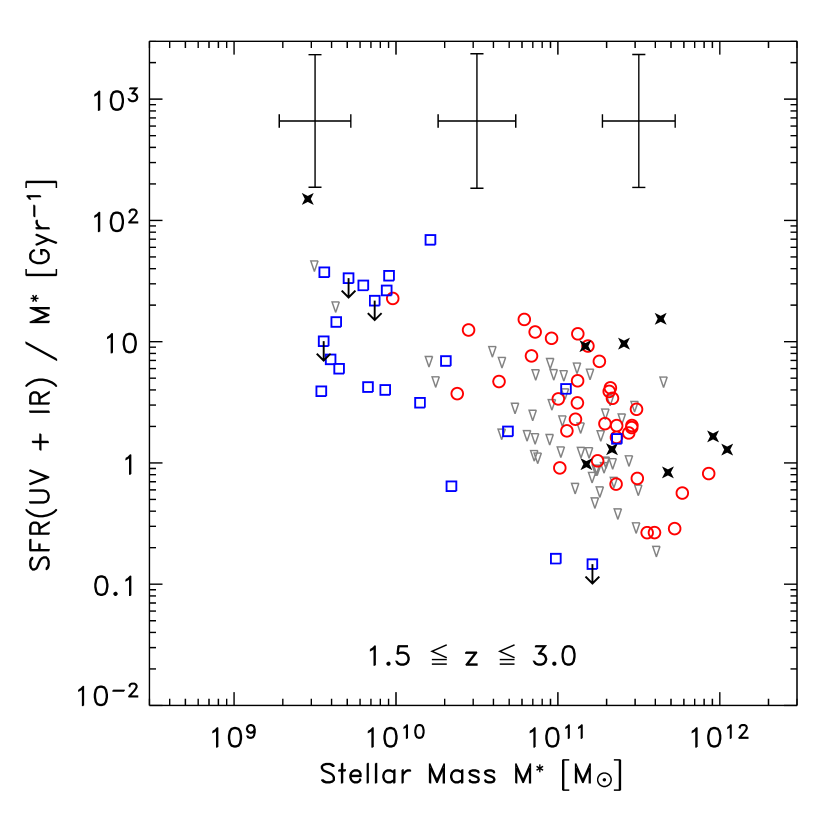
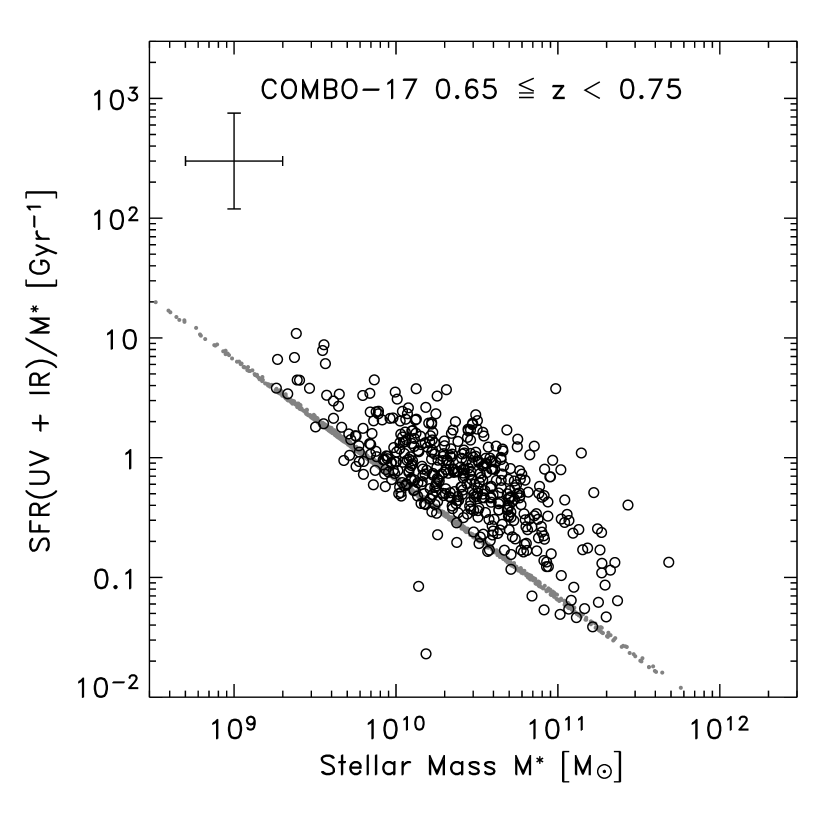
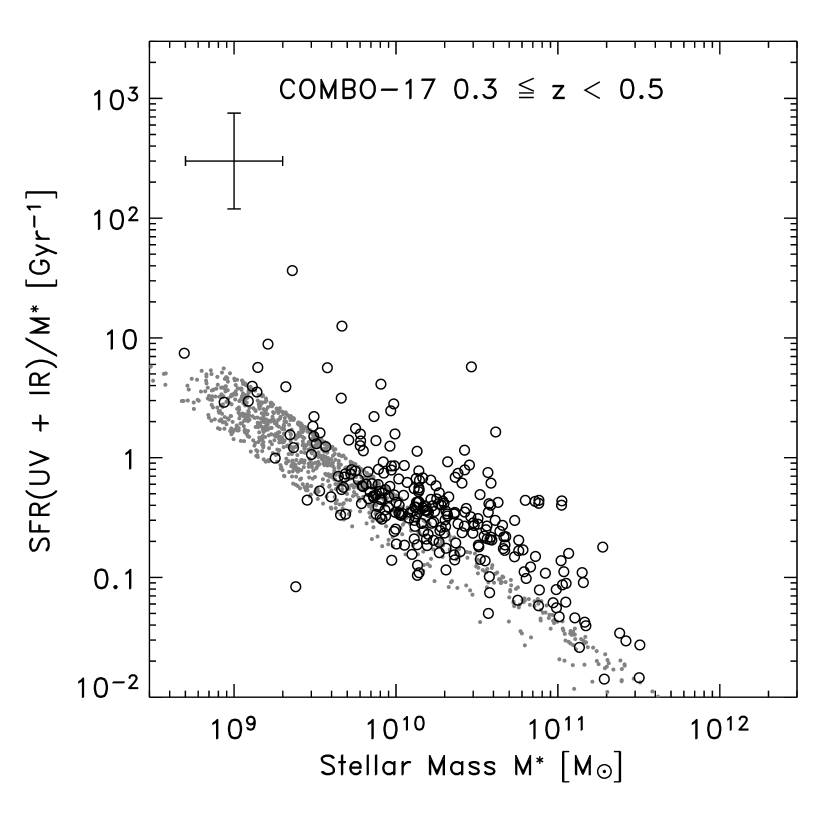
The DRGs have higher specific SFRs (SFR per unit stellar mass, ) than galaxies with comparable mass at lower redshifts (). Figure 13 shows the specific SFRs for DRGs and HDF–N galaxies at , comparing them to galaxies at lower redshift in the COMBO–17 survey (see § 2.5). The SFRs for the COMBO–17 galaxies are calculated using the MIPS 24 µm imaging and rest–frame UV emission in an analogous manner as for the DRGs. Masses for COMBO–17 galaxies were estimated from their rest–frame and colors, and have a typical uncertainty of 0.3 dex. This method will tend to overestimate the masses of galaxies involved in starbursts, but it is fairly robust for quiescent galaxies such as those that dominate our conclusions here (see Bell et al. 2004, 2005a).
We are biased against galaxies with low stellar masses and low specific SFRs, which causes the lower “envelope” in all the panels of Figure 13. This selection effect can produce the apparent anticorrelation between specific SFR and stellar mass (most apparent in the COMBO–17 galaxy plots). The galaxies at show an upper envelope in the sense that there is a lack of galaxies with high specific SFRs and high stellar masses. In contrast, the DRGs at show a nearly unchanging range of specific SFRs at all stellar masses, although there is a hint that the DRGs at the high–mass end ( ) show an upper envelope on their specific SFRs. Even then the massive galaxies have systematically higher specific SFRs than the galaxies in COMBO–17. Quantitatively, the DRGs with and have specific SFRs of Gyr-1, with a mean value of Gyr-1 (excluding those with X–ray detections). By galaxies with have Gyr-1 and at galaxies with have Gyr-1 — an order of magnitude lower than for the massive DRGs.
This downward evolution in the specific SFRs of massive galaxies has been referred to as “downsizing” (see § 1). The hypothesis is that massive galaxies host most of the SFR density at high redshifts, and that galaxy formation shifts to less–massive systems at lower redshifts. It is unclear if downsizing is a proper description as nearly all galaxies at have higher specific SFRs at higher redshift, not just the most massive. “Downsizing” is not equivalent to a global change in with redshift. However, our results indicate that star–formation in massive galaxies is reduced for as galaxies with lower stellar masses have higher specific SFRs. It appears that massive galaxies are largely done assembling their stellar mass in high specific–SFR events by (although mergers accompanied by low specific SFRs, i.e., “dry” mergers, could still take place at lower redshift, see, e.g., Bell et al. 2005b; Faber et al. 2005; van Dokkum 2005).
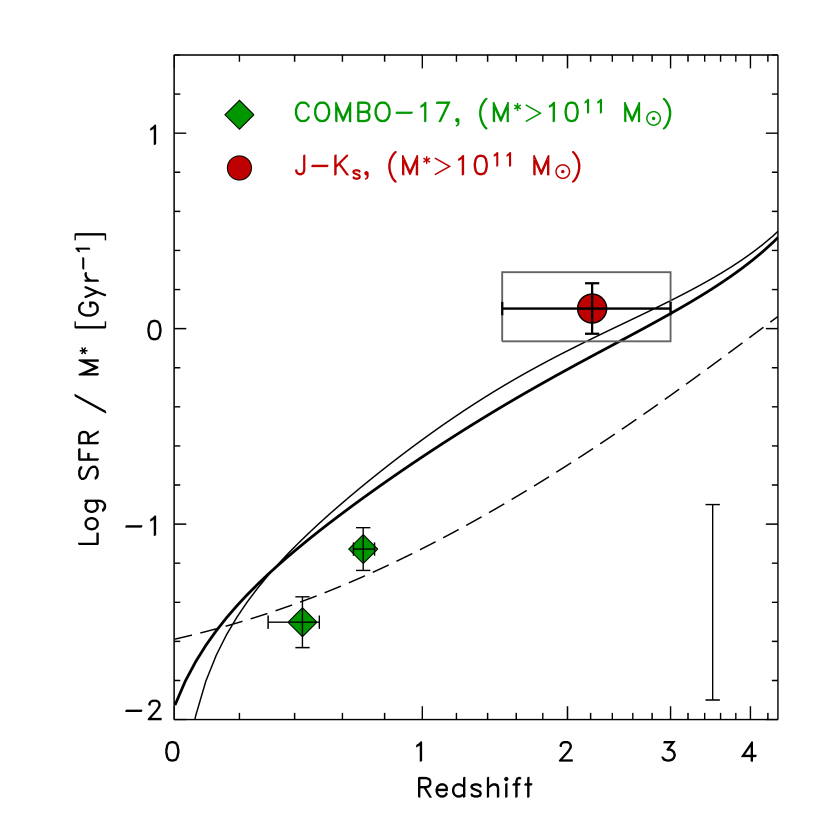
We define the integrated specific SFR, , as the ratio of the sum of the SFRs, , to the sum of their stellar masses, , over all galaxies,
| (4) |
This is essentially just the ratio of the SFR density to the stellar mass density for a volume–limited sample of galaxies. Figure 14 shows the integrated specific SFRs for DRGs at and COMBO–17 galaxies at and 0.7 with . The data point for the DRGs includes all DRGs with , and assumes that the DRGs without 24 µm detections have a no star–formation ( yr-1). The error box illustrates how changes in our assumptions affect the result. The bottom bound of the box shows the value if we exclude those objects with X–ray detections, or with IR luminosities or colors indicative of AGN (see § 6.3). The upper bound of the box shows the value for DRGs in this redshift and mass range, and if we calculate SFRs for the DRGs without 24 µm detections assuming they have Jy. Note that for this calculation we have used the stellar masses from the single–component fits. Using those from the two–component fits increases the DRG point and error box by a small amount, 0.05 dex.
The integrated specific SFR in massive galaxies declines by more than an order of magnitude from to redshifts and 0.4. Using the rest–frame UV luminosities and [O II] emission–line fluxes of galaxies in the Gemini Deep–Deep Survey, Juneau et al. (2005) found that the specific SFRs of galaxies with decline by roughly a factor of six from to 1. Our results suggest that this value may be underestimated when the IR emission from these galaxies is included in the SFR determination.
Figure 14 shows the specific SFR integrated over all galaxies by taking the ratio of the cosmic SFR density to the integrated SFR density from Cole et al. (2001), i.e., and also from the predictions from Hernquist & Springel (2003). The integrated specific SFR over all galaxies declines steadily with decreasing redshift, because the SFR density peaks between (Hopkins, 2004), corresponding to when the stellar mass density appears to have grown the most rapidly (Dickinson et al., 2003). That is, there is a decrease in the global specific SFR.
The evolution in the integrated specific SFR in massive galaxies is accelerated relative to the integrated global value for all galaxies. Galaxies with at were forming stars at or slightly above the rate integrated over all galaxies. These massive galaxies contribute between 10–30% to the global SFR density at (comparing to Hopkins, 2004). In contrast, by , galaxies with have an integrated specific SFR much lower than value integrated over all galaxies. Thus, our results indicate that by massive galaxies have formed most of their stellar mass, and lower–mass galaxies dominate the cosmic SFR density. If we tried to track individual galaxies we would need to account for their growth in mass from to , and as a result this trend would be even stronger.
Our conclusion would be undermined if there were a substantial population of passively evolving, massive galaxies at high redshifts that we have missed in our selection. The GOODS–S DRG sample is approximately mass–limited for passively evolving galaxies to at , although we are presumably missing some at (see Daddi et al. 2004, and § 6.1.3). However, if we restrict the calculation to those DRGs with , the integrated specific SFR increases by roughly 0.1 dex. Including those sources at provides a more conservative measure of the evolution in the specific SFRs of massive galaxies, so we keep these objects here. The DRG selection is potentially biased against other star–forming galaxies, most notably UV–luminous LBGs. However, LBGs with these stellar masses have high inferred SFRs, comparable even to those of the DRGs (see, e.g., Shapley et al. 2003; and Figure 5). Moreover, Shapley et al. find that the inferred colors of most UV–selected LBGs at with satisfy the DRG selection criterion. Therefore, including massive LBGs into the integrated specific SFR would have little effect on our conclusions, and we are confident that the results presented here apply to the general galaxy population at with .
This decline in the specific SFR of massive galaxies seems to signify the point where massive galaxies have formed the bulk of their stellar populations. This may happen because they have converted most of their gas reservoirs into stellar mass, and thus can no longer sustain high SFRs. This may be supported by the timescales for the galaxies to sustain their current SFRs discussed in § 6.1.4. Alternatively, because some of the massive DRGs show indications that they are fueling powerful AGN, it may be that AGN feedback provides a means to suppress further star formation in these objects (Hopkins et al., 2005). To understand the rapid evolution in the specific SFRs of massive galaxies at these redshifts, we will need to better understand the coeval assembly of stellar mass and AGN, and the energetic feedback from the processes.
7. Conclusions
We have investigated the properties of massive, star–forming galaxies at using observations from the Hubble Space Telescope, ground–based near–infrared (IR) imaging, and IR observations from the Spitzer Space Telescope at 3–24 µm. From a –selected galaxy sample over a arcmin2 field in GOODS–S, we identified 153 DRGs with to mag, which is approximately complete in stellar mass to for . The majority of DRGs (90%) are detected in deep Spitzer/IRAC imaging at µm, and the remainder are confused with nearby sources within the IRAC beam. Roughly half of the DRGs are detected by Spitzer/MIPS at 24 µm with Jy. At , these 24 µm flux densities correspond to IR luminosities of .
Based on the full suite of photometry, we find that the DRG selection identifies galaxies whose optical rest–frame light is dominated by a population of evolved stars combined with trace amounts of ongoing star formation (), and galaxies whose light is dominated by heavily extincted ( mag) starbursts (), in roughly equal proportions. Only a very small fraction of the DRGs (%) in the sample have SEDs consistent with pure old ( Gyr) stellar populations with no indication of current star formation. We estimate that the number density of massive, passively evolving DRGs at is Mpc-3, which is nearly an order of magnitude lower than that for DRGs in the HDF–S (Labbé et al. 2005), although some of this discrepancy likely results from the fact that the HDF–S sample extends to fainter –band sources. The candidates for passively–evolving DRGs at with contribute only a small fraction (%) to the global stellar–mass density integrated over all galaxies at these redshifts. Thus, massive, passively evolving objects are rare at . However, the fraction of the stellar–mass density in massive, passively evolving galaxies increases threefold from to 0.
The UV–derived SFRs for the DRGs are lower than those that include the reradiated IR emission by up to two orders of magnitude. The DRGs have IR/UV luminosity ratios typically in excess of what is expected from their rest–frame UV spectral slope, consistent with observations of local LIRGs and ULIRGs.
We compare the DRG photometry to stellar population synthesis models to estimate the stellar masses and to study the properties of the stars that dominate the rest–frame UV through near–IR light. Models allowing for a previous stellar population formed in an instantaneous burst in the distant past accompanied by additional on–going star–formation generally provide better fits to the data. We conclude that the DRGs have complex and stochastic star–formation histories consistent with other star–forming galaxies at these redshifts and locally, and with predictions from hierarchical models.
DRGs at with stellar masses greater than have specific SFRs ranging from Gyr-1. This is more than an order of magnitude larger than that derived for galaxies with stellar masses above at and 0.4. Simultaneously, the most luminous and massive DRGs show indications for the presence of AGN either based on X–ray luminosity, IR luminosities, or IR colors. We find that as many as one–quarter of the DRG population contain AGN, and therefore the growth of SMBHs coincides with the formation of massive galaxies at . Further implications from the prevalence of AGN in DRGs will be discussed in L. Moustakas et al. (in preparation).
At , galaxies with stellar masses are forming stars at rates at or slightly higher than the global value integrated over all galaxies at this epoch. In contrast, galaxies at with are forming stars at rates less than the global value for all galaxies. The evolution in the specific SFRs of massive galaxies occurs at an accelerated rate compared to that of all galaxies. The bulk of star formation in massive galaxies occurs at early cosmic epochs and that further mass assembly in these galaxies is accompanied by low specific SFRs. At massive galaxies have formed most of their stellar mass, and lower mass galaxies dominate the cosmic SFR density.
References
- Adelberger & Steidel (2000) Adelberger, K. L., & Steidel, C. C. 2000, ApJ, 544, 218
- Alexander et al. (2003) Alexander, D. M., et al. 2003, AJ, 126, 539
- Alexander et al. (2005) Alexander, D. M., Smail, I., Bauer, F. E., Chapman, S. C., Blain, A. W., Brandt, W. N., & Ivison, R. J. 2005, Nature, 434, 738
- Alonso–Herrero et al. (2005) Alonso–Herrero, A., et al., 2005, ApJ, submitted
- Appleton et al. (2004) Appleton, P. N., et al. 2004, ApJS, 154, 147
- Baldry & Glazebrook (2003) Baldry, I. K., & Glazebrook, K. 2003, ApJ, 593, 258
- Baldry et al. (2004) Baldry, I. K., Glazebrook, K., Brinkmann, J., Ivezić, Ž., Lupton, R. H., Nichol, R. C., & Szalay, A. S. 2004, ApJ, 600, 681
- Barger et al. (2000) Barger, A. J., Cowie, L. L., & Richards, E. A. 2000, AJ, 119, 2092
- Bauer et al. (2005) Bauer, A. E., Drory, N., Hill, G. J., & Feulner, G. 2005, ApJ, 621, L89
- Baugh et al. (1998) Baugh, C. M., Cole, S., Frenk, C. S., & Lacey, C. G. 1998, ApJ, 498, 504
- Baugh et al. (2005) Baugh, C. M., Lacey, C. G., Frenk, C. S., Granato, G. L., Silva, L., Bressan, A., Benson, A. J., & Cole, S. 2005, MNRAS, 356, 1191
- Bell (2003) Bell, E. F. 2003, ApJ, 586, 794
- Bell et al. (2003) Bell, E. F., McIntosh, D. H., Katz, N., & Weinberg, M. D. 2003, ApJS, 149, 289
- Bell et al. (2004) Bell, E. F., et al. 2004, ApJ, 608, 752
- Bell et al. (2005a) Bell, E. F., et al. 2005a, ApJ, 625, 23
- Bell et al. (2005b) Bell, E. F., et al. 2005b, ApJ, submitted (astro–ph/0506425)
- Bertin & Arnouts (1996) Bertin, E., & Arnouts, S. 1996, A&AS, 117, 393
- Blain et al. (2002) Blain, A. W., Smail, I., Ivison, R. J., Kneib, J.-P., & Frayer, D. T. 2002, Phys. Rep., 369, 111
- Blain et al. (2004) Blain, A. W., Chapman, S. C., Smail, I., & Ivison, R. 2004, ApJ, 611, 725
- Bouwens et al. (2004) Bouwens, R. J., et al. 2004, ApJ, 606, L25
- Brandt & Hasinger (2005) Brandt, W. N., & Hasinger, G. 2005, ARA&A, in press (astro–ph/0501058)
- Brinchmann & Ellis (2000) Brinchmann, J., & Ellis, R. S. 2000, ApJ, 536, L77
- Bruzual & Charlot (2003) Bruzual, G. A., & Charlot, S. 2003, MNRAS, 344, 1000
- Budavári et al. (2000) Budavári, T., Szalay, A. S., Connolly, A. J., Csabai, I., & Dickinson, M. 2000, AJ, 120, 1588
- Buat et al. (2005) Buat, V., et al. 2005, ApJ, 619, L51
- Calzetti et al. (2000) Calzetti, D., Armus, L., Bohlin, R. C., Kinney, A. L., Koornneef, J., & Storchi-Bergmann, T. 2000, ApJ, 533, 682
- Calzetti et al. (1994) Calzetti, D., Kinney, A. L., & Storchi-Bergmann, T. 1994, ApJ, 429, 582
- Caputi et al. (2005) Caputi, K., et al. 2005, ApJ, submitted
- Chary & Elbaz (2001) Chary, R. R., & Elbaz, D. 2001, ApJ, 556, 562
- Chapman et al. (2003) Chapman, S. C., Helou, G., Lewis, G. F., & Dale, D. A. 2003, ApJ, 588, 186
- Chapman et al. (2005) Chapman, S. C., Blain, A. W., Smail, I., & Ivison, R. J. 2005, ApJ, 622, 772
- Charmandaris et al. (2004) Charmandaris, V., Le Floc’h, E., & Mirabel, I. F. 2004, ApJ, 600, L15
- Cimatti et al. (2002a) Cimatti, A., et al. 2002a, A&A, 381, L68
- Cimatti et al. (2002b) Cimatti, A., et al. 2002b, A&A, 391, L1
- Cole et al. (2001) Cole, S., et al. 2001, MNRAS, 326, 255
- Coleman et al. (1980) Coleman, G. D., Wu, C.-C., & Weedman, D. W. 1980, ApJS, 43, 393
- Cowie et al. (1999) Cowie, L. L., Songaila, A., & Barger, A. J. 1999, AJ, 118, 603
- Daddi et al. (2003) Daddi, E., et al. 2003, ApJ, 588, 50
- Daddi et al. (2004) Daddi, E., Cimatti, A., Renzini, A., Fontana, A., Mignoli, M., Pozzetti, L., Tozzi, P., & Zamorani, G. 2004, ApJ, 617, 746
- Daddi et al. (2005a) Daddi, E., et al. 2005a, ApJ, 626, 680
- Daddi et al. (2005b) Daddi, E., et al. 2005b, ApJ, 631, L13
- Dale et al. (2001) Dale, D. A., Helou, G., Contursi, A., Silbermann, N. A., & Kolhatkar, S., 2001, ApJ, 549, 215
- Dale & Helou (2002) Dale, D. A., & Helou, G. 2002, ApJ, 576, 159
- De Breuck et al. (2003) De Breuck, C., et al. 2003, A&A, 401, 911
- De Breuck et al. (2005) De Breuck, C., Downes, D., Neri, R., van Breugel, W., Reuland, M., Omont, A., & Ivison, R. 2005, A&A, 430, L1
- De Lucia et al. (2005) De Lucia, G., Springel, V., White, S. D. M., Croton, D., & Kauffmann, G. K. 2005, MNRAS, submitted (astro–ph/0509725)
- Di Matteo et al. (2005) Di Matteo, T., Springel, V., & Hernquist, L. 2005, Nature, 433, 604
- Dickinson et al. (2000) Dickinson, M. et al. 2000, ApJ, 531, 624
- Dickinson et al. (2003) Dickinson, M., Papovich, C., Ferguson, H. C., & Budavári, T. 2003, ApJ, 587, 25
- Donley et al. (2005) Donley, J. L., Rieke, G. H., Rigby, J., & Pérez–González, P. G. 2005, ApJ, in press (astro-ph/0507676)
- Downes & Solomon (1998) Downes, D., & Solomon, P. M. 1998, ApJ, 507, 615
- Dunlop et al. (1996) Dunlop, J., Peacock, J., Spinrad, H., Dey, A., Jimenez, R., Stern, D., & Windhorst, R. A. 1996, Nature, 381, 581
- Eggen, Lynden–Bell, & Sandage (1962) Eggen, O. J., Lynden–Bel, D., & Sandage, A. R., 1962, ApJ, 136, 748
- Elbaz et al. (2002) Elbaz, D., Cesarsky, C. J., Chanial, P., Aussel, H., Franceschini, A., Fadda, D., & Chary, R. R. 2002, A&A, 384, 848
- Eyles et al. (2005) Eyles, L., Bunker A., Stanway, E., Lacy, M., & Ellis, R. 2005, MNRAS, in press (astro–ph/0502385)
- Faber et al. (2005) Faber, S. M., et al. 2005, ApJ, submitted (astro–ph/0506044)
- Ferguson et al. (2002) Ferguson, H. C., Dickinson, M., & Papovich, C. 2002, ApJ, 569, L65
- Finlator et al. (2005) Finlator, K., Davé, R., Papovich, C., & Hernquist, L. 2005, ApJ, submitted (astro–ph/0507719)
- Fontana et al. (2003) Fontana, A., et al. 2003, ApJ, 594, L9
- Fontana et al. (2004) Fontana, A., et al. 2004, A&A, 424, 23
- Förster–Schreiber et al. (2003) Förster–Schreiber, N. M., Genzel, R., Lutz, D., & Sternberg, A. 2003, ApJ, 599, 193
- Förster–Schreiber et al. (2004) Förster–Schreiber, N. M. et al., 2004, ApJ, 616, 40
- Francis et al. (2004) Francis, P. J., Nelson, B. O., & Cutri, R. M. 2004, AJ, 127, 646
- Franx et al. (2003) Franx, M., et al. 2003, ApJ, 587, L79
- Gebhardt et al. (2000) Gebhardt, K., et al. 2000, ApJ, 539, L13
- Giacconi et al. (2002) Giacconi, R., et al. 2002, ApJS, 139, 369
- Giavalisco (2002) Giavalisco, M. 2002, ARA&A, 40, 579
- Giavalisco et al. (2004a) Giavalisco, M., et al. 2004a, ApJ, 600, L93
- Giavalisco et al. (2004b) Giavalisco, M., et al. 2004b, ApJ, 600, L103
- Gilli (2004) Gilli, R. 2004, Adv. Space Res., 34, 2470
- Glazebrook et al. (2004) Glazebrook, K., et al. 2004, Nature, 430, 181
- Goldader et al. (2002) Goldader, J. D., Meurer, G., Heckman, T. M., Seibert, M., Sanders, D. B., Calzetti, D., & Steidel, C. C. 2002, ApJ, 568, 651
- Gordon et al. (2005) Gordon, K., et al. 2005, PASP, 117, 503
- Granato et al. (2001) Granato, G. L., Silva, L., Monaco, P., Panuzzo, P., Salucci, P., De Zotti, G., & Danese, L. 2001, MNRAS, 324, 757
- Greve, Ivison, & Papadopoulos (2004) Greve, T. R., Ivison, R. J., Papadopoulos, P. P. 2004, A&A, 419, 99
- Haas et al. (2003) Haas, M., et al. 2003, A&A, 402, 87
- Heavens et al. (2004) Heavens, A., Panter, B., Jimenez, R., & Dunlop, J. 2004, Nature, 428, 625
- Hernquist & Springel (2003) Hernquist, L., & Springel, V. 2003, MNRAS, 341, 1253
- Hopkins (2004) Hopkins, A. 2004, ApJ, 615, 209
- Hopkins et al. (2005) Hopkins, P. F., Hernquist, L., Cox, T. J., Di Matteo, T., Martini, P., Robertson, B., & Springel, V. 2005, ApJ, 625, 71
- Hornschemeier et al. (2001) Hornschemeier, A., et al. 2001, ApJ, 554, 742
- Im et al. (2002) Im, M., Yamada, T., Tanaka, I., & Kajisawa, M. 2002, ApJ, 578, L19
- Juneau et al. (2005) Juneau, S., et al. 2005, ApJ, 619, L135
- Kauffmann & Charlot (1998) Kauffmann, G., & Charlot, S. 1998, MNRAS, 294, 705
- Kauffmann et al. (2004) Kauffmann, G., White, S. D. M., Heckman, T. M., Ménard, B., Brinchmann, J., Charlot, S., Tremonti, C., & Brinkmann, J. 2004, MNRAS, 353, 713
- Kennicutt (1998) Kennicutt, R. C. 1998, ARA&A, 36, 189
- Kereš et al. (2005) Kereš, D., Katz, N., Weinberg, D. H., & Davé, R. 2005, MNRAS, 823
- Kinney et al. (1996) Kinney, A. L., Calzetti, D., Bohlin, R. C., McQuade, K., Storchi-Bergmann, T., & Schmitt, H. R. 1996, ApJ, 467, 38
- Knudsen et al. (2005) Knudsen, K. K., et al. 2005, ApJ, in press (astro–ph/0509104)
- Kong et al. (2004) Kong, X., Charlot, S., Brinchmann, J., & Fall, S. M. 2004, MNRAS, 349, 769
- Labbé et al. (2005) Labbé, I. et al. 2005, ApJ, 624, L81
- Lacy et al. (2004) Lacy, M., et al. 2004, ApJS, 154, 166
- Larson (2005) Larson, R. B. 2005, MNRAS, 359, 211
- Le Fèvre et al. (2004) Le Fèvre, O., et al. 2004, A&A, 428, 1043
- Le Floc’h et al. (2001) Le Floc’h, E., Mirabel, I. F., Laurent, O., Charmandaris, V., Gallais, P., Sauvage, M., Vigroux, L., & Cesarsky, C. 2001, A&A, 367, 487
- Le Floc’h et al. (2005) Le Floc’h, E., et al. 2005, ApJ, in press (astro–ph/0506462)
- Madau et al. (1998) Madau, P., Pozzetti, L., & Dickinson, M. 1998, ApJ, 498, 106
- Magorrian et al. (1998) Magorrian, J., et al. 1998, AJ, 115, 2285
- Marcillac et al. (2005) Marcillac, D., Elbaz, D., Chary, R. R., Dickinson, M., Galliano, F., & Morrison, G. 2005, A&A, submitted
- McCarthy (2004) McCarthy, P. J. 2004, ARA&A, 42, 477
- McCarthy et al. (2004) McCarthy, P. J., et al. 2004, ApJ, 614, L9
- Meurer et al. (1999) Meurer, G., Heckman, T. M., & Calzetti, D. 1999, ApJ, 521, 64
- Mignoli et al. (2005) Mignoli, M., et al. 2005, A&A, 437, 883
- Mobasher et al. (2004) Mobasher, B., et al. 2004, ApJ, 600, L167
- Moustakas & Somerville (2002) Moustakas, L. A., & Somerville, R. S. 2002, ApJ, 577, 1
- Moustakas et al. (2004) Moustakas, L. A., et al. 2004, ApJ, 600, L131
- Nagamine et al. (2005) Nagamine, K., Cen, R., Hernquist, L, Ostriker, J. P., & Springel, V. 2005, ApJ, 627, 608
- Neugebauer et al. (1979) Neugebauer, G., Oke, J. B., Becklin, E. G., & Matthews, K. 1979, ApJ230, 79
- Papovich, Dickinson, & Ferguson (2001) Papovich, C., Dickinson, M., & Ferguson, H. C. 2001, ApJ, 559, 620
- Papovich & Bell (2002) Papovich, C., & Bell, E. F. 2002, ApJ, 579, L1
- Papovich et al. (2004a) Papovich, C., et al. 2004a, ApJ, 600, L111
- Papovich et al. (2004b) Papovich, C., et al. 2004b, ApJS, 154, 70
- Papovich et al. (2005) Papovich, C., Dickinson, M., Giavalisco, M., Conselice, C. J., & Ferguson, H. C. 2005, ApJ, 631, 101
- Pérez–González et al. (2005) Pérez–González, P. G. et al. 2005, ApJ, 630, 82
- Persic et al. (2004) Persic, M., Rephaeli, Y., Braito, V., Cappi, M., Della Ceca, R., Franceschini, A., & Gruber, D. E. 2004, A&A, 419, 849
- Ranalli et al. (2003) Ranalli, P., Comastri, A., & Setti, G. 2003, A&A, 399, 39
- Reddy et al. (2005) Reddy, N. A., Erb, D. K., Steidel, C. C., Shapley, A. E., Adelberger, K. L., & Pettini, M. 2005, ApJ, in press (astro-ph/0507264)
- Rieke (1978) Rieke, G. H. 1978, ApJ, 226, 550
- Roussel et al. (2001) Roussel, H., Sauvage, M., Vigroux, L., & Bosma, A. 2001, A&A, 372, 427
- Rubin et al. (2004) Rubin, K. H. R., van Dokkum, P. G., Coppi, P., Johnson, O., Förster Schreiber, N. M., Franx, M., & van der Werf, P. 2004, ApJ, 613, L5
- Rudnick et al. (2003) Rudnick, G., et al. 2003, ApJ, 599, 847
- Sanders et al. (1988) Sanders, D. B., Soifer, B. T., Elias, J. H., Neugebauer, G., & Matthews, K. 1988, ApJ, 328, L35
- Sanders & Mirabel (1996) Sanders, D. B., & Mirabel, I. F. 1996, ARA&A, 34, 749
- Sanders et al. (2003) Sanders, D. B., Mazzarella, J. M., Kim, D.-C., Surace, J. A., & Soifer, B. T. 2003, AJ, 126, 1607
- Sawicki & Yee (1998) Sawicki, M. & Yee, H. K. C. 1998, AJ, 115, 1329
- Sawicki (2002) Sawicki, M. 2002, AJ, 124, 3050
- Shapley et al. (2001) Shapley, A. E., Steidel, C. C., Adelberger, K. L., Dickinson, M., Giavalisco, M., & Pettini, M. 2001, ApJ, 562, 95
- Shapley et al. (2004) Shapley, A. E., Erb, D. K., Pettini, M., Steidel, C. C., & Adelberger, K. L. 2004, ApJ, 612, 108
- Shapley et al. (2005) Shapley, A. E., Steidel, C. C., Erb, D. K., Reddy, N. A., Adelberger, K. L., Pettini, M., Barmby, P., & Huang, J. 2005, ApJ, 626, 698
- Simpson & Eisenhardt (1999) Simpson, C., & Eisenhardt, P. 1999, PASP, 111, 691
- Silva et al. (1998) Silva, L., Granato, G. L., Bressan, A., & Danese, L. 1998, ApJ, 509, 103
- Smail et al. (2002) Smail, I., Owen, F. N., Morrison, G. E., Keel, W. C., Ivison, R. J., & Ledlow, M. J. 2002, ApJ, 581, 844
- Soifer et al. (1995) Soifer, B. T., Cohen, J. G., Armus, L., Matthews, K., Neugebauer, G., & Oke, J. B. 1995, ApJ, 443, L65
- Somerville, Primack, & Faber (2001) Somerville, R. S., Primack, J. R., & Faber, S. M. 2001, MNRAS, 320, 504
- Spinoglio et al. (1995) Spinoglio, L., Malkan, M. A., Rush, B., Carrasco, L., & Recillas-Cruz, E. 1995, ApJ, 453, 616
- Spinrad et al. (1997) Spinrad, H., Dey, A., Stern, D., Dunlop, J., Peacock, J., Jimenez, R., & Windhorst, R. 1997, ApJ, 484, 581
- Spoon et al. (2004) Spoon, H. W. W., Moorwood, A. F. M., Lutz, D., Tielens, A. G. G. M., Siebenmorgen, R., & Keane, J. V. 2004, A&A, 414, 873
- Springel et al. (2005a) Springel, V., Di Matteo, T., & Hernquist, L. 2005a, ApJ, 620, L79
- Springel et al. (2005b) Springel, V., et al. 2005b, Nature, 435, 629
- Steidel et al. (1996) Steidel, C. C., Giavalisco, M., Pettini, M., Dickinson, M., & Adelberger, K. L. 1996, ApJ, 462, L17
- Steidel et al. (1999) Steidel, C. C., Adelberger, K. L., Giavalisco, M., Dickinson, M., & Pettini, M. 1999, ApJ, 519, 1
- Stern et al. (2005) Stern, D., et al. 2005, ApJ, 631, 163
- Szokoly et al. (2004) Szokoly, G. P., et al. 2004, ApJS, 155, 271
- Teng et al. (2005) Teng, S. H., Wilson, A. S., Veilleux, S., Young, A. J., Sanders, D. B., & Nagar, N. M. 2005, ApJ, in press (astro–ph/0508112)
- Totani et al. (2001) Totani, T., Yoshii, Y., Iwamuro, F., Maihara, T., & Motohara, K. 2001, ApJ, 558, L87
- Treu et al. (2005) Treu, T., Ellis, R. S., Liao, T. X., & van Dokkum, P. G. 2005, ApJ, 622, L5
- van Dokkum et al. (2003) van Dokkum, P. G., et al. 2003, ApJ, 587, L83
- van Dokkum et al. (2004) van Dokkum, P. G., et al. 2004, ApJ, 611, 703
- van Dokkum (2005) van Dokkum, P. G. 2005, ApJ, submitted (astro-ph/0506661)
- van Dokkum et al. (2005) van Dokkum, P. G., Kriek, M., Rodgers, B., Franx, M., & Puxley, P. 2005, ApJ, 622, L33
- Vanzella et al. (2005) Vanzella, E., et al. 2005, A&A, 434, 53
- Veilleux et al. (1995) Veilleux, S., Kim, D.-C., Sanders, D. B., Mazzarella, J. M., & Soifer, B. T. 1995, ApJS, 98, 171
- Veilleux et al. (1999) Veilleux, S., Kim, D.-C., & Sanders, D. B. 1999, ApJ, 522, 113
- Williams et al. (1996) Williams, R. E., et al. 1996, AJ, 112, 1335
- Wilson et al. (2004) Wilson, G., et al. 2004, ApJS, 154, 107
- Wolf et al. (2003) Wolf, C., Meisenheimer, K., Rix, H.–W. Borch, A., Dye, S., & Kleinheinrich, M. 2003, A&A, 401, 73
- Wolf et al. (2004) Wolf, C., et al. 2004, A&A, 421, 913
- Worsley et al. (2005) Worsley, M. A., et al. 2005, MNRAS, 357, 1281
- Yan et al. (2004a) Yan, H., et al. 2004a, ApJ, 616, 63
- Yan et al. (2005) Yan, H., et al. 2005, ApJ, in press (astro-ph/0507673)
- Yan et al. (2004b) Yan, L., et al. 2004b, ApJS, 154, 75