OVI in Elliptical Galaxies: Indicators of Cooling Flows
Abstract
Early-type galaxies often contain a hot X-ray emitting interstellar medium (3-8 106 K) with an apparent radiative cooling time much less than a Hubble time. If unopposed by a heating mechanism, the gas will radiatively cool to temperatures 104 K at a rate proportional to /, typically 0.03-1 M⊙ yr-1. We can test if gas is cooling through the 3105 K range by observing the OVI doublet, whose luminosity is proportional to the cooling rate. Here we report on a study of an unbiased sample of 24 galaxies, obtaining Far Ultraviolet Spectroscopic Explorer spectra to complement the X-ray data of ROSAT and Chandra. The OVI line emission was detected in about 40% of the galaxies and at a luminosity level similar to the prediction from the cooling flow model. There is a correlation between and , although there is significant dispersion about the relationship, where the OVI is brighter or dimmer than expected by a factor of three or more. If the cooling flow picture is to be retained, this dispersion requires that cooling flows be time-dependent, as might occur by the activity of an AGN. However, of detected objects, those with the highest or lowest values of / are not systematically hot or cool, as one might predict from AGN heating.
1 Introduction
The cumulative stellar mass loss from the stars in an early-type galaxy is typically 0.1-3 M⊙ yr-1 (e.g., Athey et al. 2002), which, integrated over a Hubble time, is comparable to the gaseous mass of a spiral galaxy. The absence of a massive disk of cool atomic and molecular gas in early-type galaxies indicates a different life cycle for the gas, which may be divided into distinct stages. Ignoring accretion onto a galaxy, the first stage is mass loss from the stars, a process that can be measured by detecting the infrared signature associated with the stellar winds of red giants. The measurement of this process successfully detects the infrared emission near 10 m and yields a value for the mass loss rate that is approximately the value predicted from theoretical stellar evolution models (Athey et al., 2002; Knapp, Gunn, and Wynn-Williams, 1992).
The stellar ejecta will not remain in orbit around its star because the expanding ejecta will eventually collide with the ejecta from other stars, undergoing shocks that convert their random orbital motion to thermal energy (e.g., Mathews and Brighenti 2003). This process heats the gas to 106.5 -107 K, and if there were no additional heating or cooling, the gas would be bound to the galaxy and have the same spatial distribution as the stars. However, the radiative cooling time for the gas is less than a Hubble time, so the gas will evolve with time, and this is the basis of the cooling flow model. In the absence of a heating mechanism, radiative cooling drains energy from the gas most rapidly at small radii, causing a loss of buoyancy and a subsequent inflow of gas. Then, the rate at which gas cools and flows inward () is proportional to two observed quantities, the energy loss rate () divided by the thermal energy per gram (), or /, typically 0.03-3 M⊙ yr-1 for ellipticals (e.g., Sarazin and Ashe 1989). The location at which the gas cools (to 104 K or cooler) depends upon a free parameter in this standard cooling flow picture. This standard picture does not include heating effects by supernovae, which will make profound changes, since the net cooling rate is given by (-H)/, where H is a heating component. In principle, the rate at which cool gas is produced can be reduced to zero. If one uses the recent values for the supernova rate in early-type galaxies (Cappellaro, Evans, and Turatto 1999; a factor of three lower than the older Tammann and Sandage rates; van den Bergh and Tammann 1991), the characteristic temperature of the ISM would be 1107 K, which is about the escape temperature for a typical elliptical galaxy ( 0.3). More detailed hydrodynamic calculations (David, Forman, and Jones, 1991; Pellegrini and Ciotti, 1998; Mathews and Brighenti, 2003) show that galactic winds (or partial galactic winds) will play an important role in the evolution of the hot gas even if the supernova heating rate is lower than that implied by Cappellaro, Evans, and Turatto (1999). A galactic wind carries away nearly all of its energy rather than radiating it, substantially lowering the X-ray luminosity. Not only is a galactic wind important for understanding the X-ray emission and the ISM in the galaxy, it has implications for the surrounding intergalactic medium, as this is the primary way that it becomes polluted with metals.
The X-ray emission surveys of early-type galaxies show that there can be a wide range in the mass and luminosity of X-ray emitting gas for galaxies of similar optical properties (e.g., Brown and Bregman 1998; O’Sullivan, Forbes, and Ponman 2001). This variation, along with the trend of rapidly decreasing with decreasing optical luminosity , can be understood if galactic winds play a role in some systems (other systems may have accretion from their surrounding region; review by Mathews and Brighenti 2003). Therefore, the prediction is that the systems with large X-ray gas masses and short cooling times (high ) should have cooling flows while the X-ray poor systems have partial or total galactic winds, so the cooling flow will be weak or absent in those systems.
Because the heating rate is not well known, it is difficult to determine the net cooling rate through X-ray luminosity measurements. Alternatively, if gas is cooling to lower temperatures, emission lines will be produced that are indicative of those lower temperatures. The best lines for this test are from OVI because this ionization state dominates the total radiative cooling as the gas passes through the 2-4105 K range (Edgar and Chevalier, 1986). The primary cooling lines come from the doublet at 1032, 1038 Å, which is accessible with the Far Ultraviolet Spectroscopic Explorer (FUSE). Calculations show that there is a linear relationship between the line luminosity and the cooling rate, which is insensitive to the metallicity of the gas or whether the gas is out of collisional ionization equilibrium (Edgar and Chevalier, 1986; Voit, Donahue, and Slavin, 1994). At 105.3 K, the radiative cooling rate per unit volume is significantly higher than at the temperature of the X-ray emitting gas (106.5-107 K), so the relative contribution of a heating mechanism is greatly reduced and can be ignored. Therefore, the luminosity of the OVI doublet should be a direct measure of the gas cooling rate, .
Previously, we reported upon OVI observations of two early-type galaxies, NGC 1404 and NGC 4636 (Bregman, Miller, and Irwin, 2001), two of the X-ray luminous galaxies widely believed to host cooling flows. For NGC 1404, OVI was not detected and the upper limit is several times below the standard cooling flow prediction, based on ROSAT data. However, OVI emission was detected from NGC 4636, and the luminosity of these lines corresponds to a cooling rate of 0.4 M⊙ yr-1. This is less than the total rate from the cooling flow model of 2 M⊙ yr-1, but the FUSE aperture (a 30 square aperture, or an effective radius of about 17) only takes in a part of the galaxy. Correcting for the flux that falls outside the aperture is a model-dependent procedure, but if one uses a model with distributed mass drop out (q=1 from Sarazin and Ashe 1989), the corrected OVI luminosity approximately equals the cooling flow prediction.
Following on this work, we began a OVI emission line survey of an unbiased sample of nearby early-type galaxies. The basic observations define the emission line characteristics of the sample, and permit us to test a few predictions of the model. One would expect that the X-ray faint galaxies would be very weak OVI emitters, if most of the thermal energy is being carried away in galactic winds. Secondly, the galaxies with significant hot gas masses should usually possess OVI emission.
2 Sample Selection
We defined a sample of optically selected early-type galaxies in order to be unbiased with respect to X-ray properties. In previous work with ROSAT observations (Brown and Bregman, 1998, 2000), we developed a complete optically selected sample of early-type galaxies, which contains the optically brightest elliptical galaxies (by total apparent magnitude) in the Faber et al. (1989) sample that do not have AGNs pointing at us, are not at low Galactic latitude, and excluding dwarf galaxies and cD systems. This sample of 33 galaxies have been studied extensively in the optical region and were observed at X-ray energies with ROSAT. Most of the objects in the sample were observed more recently with Chandra. This sample was accepted as a program on FUSE, and nearly all were observed, with only one exception due to the pointing constraints following the reaction wheel failure. The redshift range of the sample is -250 km s-1 to 1950 km s-1, and the apparent magnitude range is 9.3-11.0 (in B); for completeness, we included M87. The optical properties and exposure times are given in Table 1, where we list the galaxy name, absolute blue magnitude, Re, one-dimensional stellar velocity dispersion, extinction in B, distance (in km s-1 and Mpc, total exposure time, and night exposure time (boldface denotes the data used).
The raw FUSE data were processed using the pipeline CALFUSE 2.2.1, 2.4, and 3.0, usually with very little change between the data sets. We inspected each of the data sets to determine whether using the night-only data was superior to using the total data set (night plus day data). The decisions depended partly on the redshift of the galaxy since the weaker OVI line at 1037.62 can be redshifted into any of three airglow lines at 1039.2 Å, 1040.8 Å, and 1041.6 Å at about 450 km s-1, 920 km s-1, and 1150 km s-1. These airglow lines are about 100 km s-1 wide and can shift relative to the source depending upon the placement in the slit. The ratio of these airglow lines, and relative to the stronger one at 1027.3, allows us to estimate the degree to which contamination occurs. Also, there is a dead spot in the detector that covers part of the spectrum near 1043 Å and this sometimes produces artifacts in the spectrum (false absorption or emission features), so we inspect this wavelength region closely in the event that an emission line is found nearby (the weaker OVI lines occurs here for redshifts of 1500-1600 km s-1).
There are four detectors that cover this wavelength region, two LiF channels and two SiC channels, but the effective area is significantly better for the LiF channels. Also, the LiF1a channel is significantly better than the LiF2b channel and we find that adding this second channel generally reduces the S/N, so we usually rely upon the LiF1a data for the region covering the OVI lines. We inspect the other channels for confirmation of features. The other important emission line in the FUSE band is from CIII 977.02, which is covered by the two SiC channels, with the SiC2a being the best. Sometimes there is an offset in the wavelength scale, and when this is an issue, we mention it and use the strong atomic absorption line, CII 1036.34 to realign the spectrum.
3 Data Processing and Observational Results
The spectra from early-type galaxies have several components that need to be modeled or recognized when trying to determine OVI line strengths. Given the redshift range of our objects, the OVI lines fall in the region 1030-1045 Å, but these lines are superimposed upon the continuum of the host galaxy, plus there is absorption by Milky Way gas, and there are airglow lines (discussed above), all of which are taken into account when analyzing line strengths.
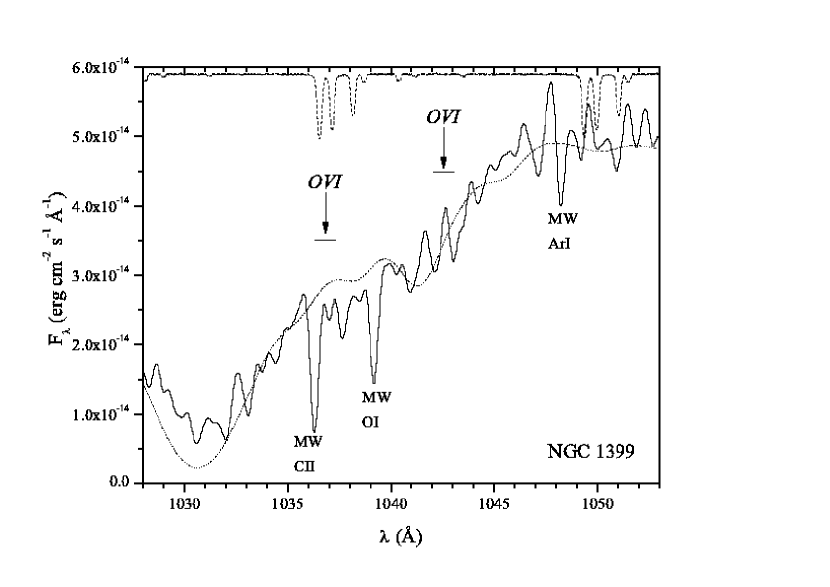
The underlying stellar spectrum of the host galaxy was modeled in this spectral region by Brown et al. (1997) in order to analyze Hopkins Ultraviolet Telescope (HUT) data, which have a resolution of about 3 Å, significantly worse than FUSE. When we compare their model spectrum to the stellar continuum from NGC 1399, the galaxy with the brightest continuum, we find that the model reproduces the general properties of the spectrum. However, there are aspects of the spectrum that depart from the model, and since the S/N is good for NGC 1399, we choose to use it as the template spectrum for other objects.
There are important absorption lines, produced by the Milky Way, superimposed upon the observed spectra of these external galaxies. The strongest atomic line in the spectral range 1028-1053 Å is CII 1036.34, which is always optically thick. This is followed in line strength by OI 1039.23, ArI 1048.22, and the Galactic OVI lines. In addition to atomic absorption lines, there can be absorption by molecular lines, although the strength of this component can vary greatly, from being absent (at our typical S/N) to being optically thick. The lines occur in bands, one occurring in the 1036-1039 Å region and another that occurs in the 1048.5-1052 Å region. The three strongest lines in the group at 1036-1039 Å are centered at 1036.54 Å, 1037.15 Å, and 1038.16 Å, the first of which can blend with the atomic line of CII 1036.34. These atomic and molecular lines can absorb part or all of an OVI emission line from the external galaxy if the redshift coincidence is unfortunate. We show the location of these absorption components in the figures for the spectra, but we do not determine their absorption equivalent widths, as this generally does not bear upon the analysis.
To extract line fluxes or upper limits, we defined the continuum for about 5 Å on either side of the line, along the shape of the stellar continuum; over this narrow range, the continuum is nearly a simple slanted line. To determine the line flux, we integrated over the line, but to determine the FWHM, a Gaussian was fit. The location of the continuum is one of the main contributors to the uncertainty of the line flux, so the continuum location was varied ( 1) to determine the errors in the line flux and line width. When the line flux was less than 3, we consider it a non-detection and quote an upper limit of 3.
The individual objects are discussed, beginning with NGC 1399, which was used as the stellar template. Extracted fluxes or upper limits to the OVI lines are given in Table 2, and for the detections, possible detections, and most upper limits, the spectra are shown (some non-detections are largely noise so we do not show their spectra). For uniformity, and to avoid the strong geocoronal Ly airglow line, we show the 1028-1053 Å region in our figures of all objects. The spectra were binned by five pixels to a bin size of 0.034 Å (9.8 km s-1 at the OVI lines) and then smoothed by five, seven, or 11 for the purposes of producing the figures shown below; line fluxes were extracted from the unsmoothed data. The reddenings quoted below are from Schlegel, Finkbeiner, and Davis (1998), the Galacitc HI column density is from Dickey and Lockman (1990), and other galaxy properties (e.g., redshift) are taken from the NASA/IPAC Extragalactic Data Base.
NGC 1399: This galaxy has the brightest stellar continuum, typically an order of magnitude brighter than other systems. As with other galaxies in the Fornax cluster (NGC 1316, NGC 1404), the Galactic HI column is low (1.311020 cm-2) as is the extinction, and there is no evidence for Galactic H2 absorption, although Galactic atomic absorption is found (Figure 1). The lack of H2 absorption simplifies the determination of the location of the continuum and we see no evidence for OVI emission. Due to the absence of OVI emission and the strength of the continuum, we use the stellar continuum as the standard template for the other systems, after filling in the Galactic absorption lines (for guidance, we used the model by Brown et al. 1997).
NGC 1316: This is also known as Fornax A, a radio galaxy in the Fornax cluster, and one of the optically most luminous galaxies in the cluster. It is also a LINER with weak low ionization emission lines, extended ionized and neutral gas, and some evidence of dust. The system has a low Galactic extinction and low Galactic HI column (1.91020 cm-2), so the absence of detectable Galactic H2 is expected. The FUSE Lif1a spectrum (Figure 2) shows emission from the strong line of OVI (1032). There is weaker emission from the OVI (1038) line, also seen in the Lif2b channel. The sharp feature that is coincident with Ly for NGC 1316 and the OVI (1032) line from the Milky Way is not confirmed in the Lif2b channel and may not be real (also, the higher series Ly lines are not seen). In addition, there is emission from the CIII (977) line at the redshift of NGC 1316 (Sic2a and Sic1a channels).
The two OVI lines and the CIII line have the same FWHM of about 1.5 Å (440 km sec-1), which is comparable to the FWHM that one would infer from the one-dimensional velocity dispersion of the stars in NGC 1316 (223 km s-1, which would lead to a FWHM of 525 km s-1). The line ratio of the two OVI lines is 2.71.0, consistent with the value of 2 expected for optically thin gas.
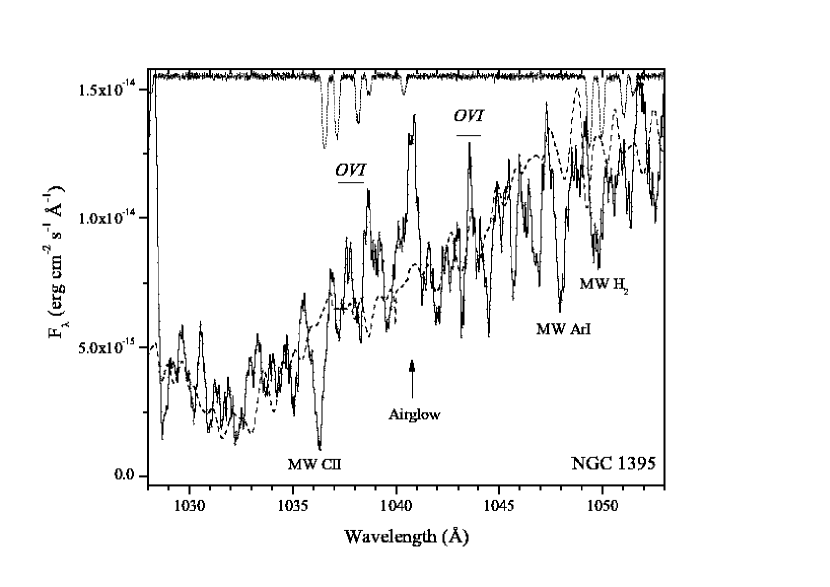
NGC 1395: Galactic absorption is present but there is little H2 absorption (about 1017.5 cm-2) and there is no evidence for Galactic OVI emission, which would be difficult to detect in this short observation. The strong OVI line from NGC 1395 would lie at 1037.84 Å, a fairly clean part of the spectrum; there is only an upper limit to this line (Figure 3).
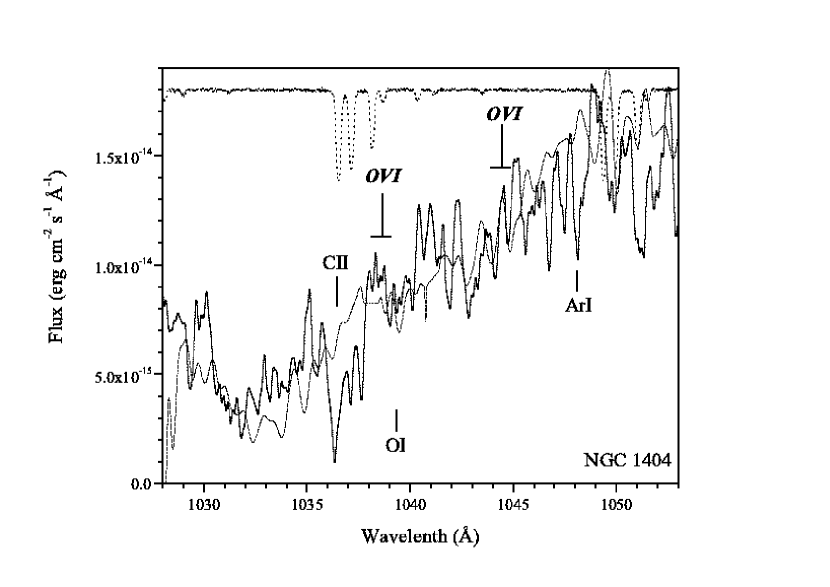
NGC 1404: Like the other Fornax galaxies, H2 absorption is nearly absent, and in this observation, using night data, there airglow lines are nearly absent as well (Figure 4); the usual Galactic atomic absorption lines are apparent (presented and discussed in Bregman, Miller, and Irwin 2001). There is no emission from either OVI line at the redshift of NGC 1404.
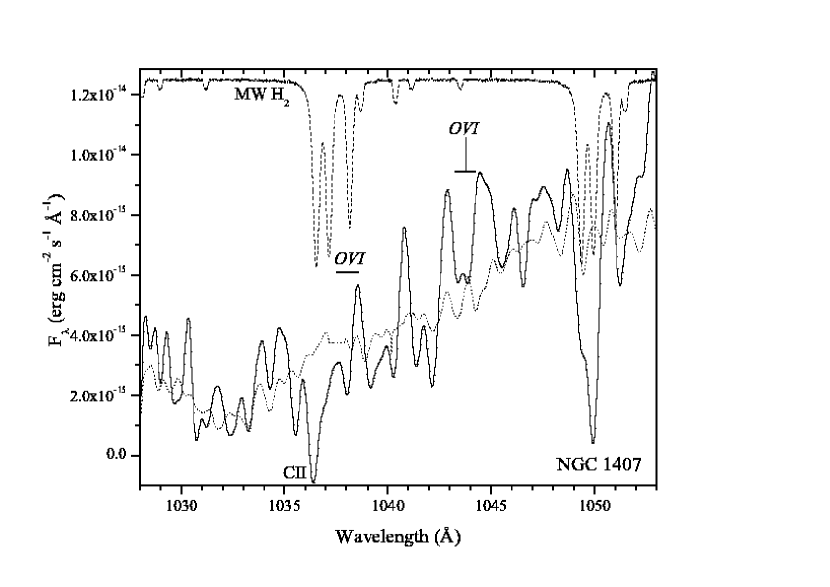
NGC 1407: There is a moderate Galactic HI column (5.421020 cm-2) and extinction, and the Galactic H2 lines are prominent, along with the atomic absorption lines. The stronger OVI line from NGC 1407 (1038.1 Å) corresponds to the location of a Galactic H2 line, although not one of the strongest ones, but there is no apparent emission, nor is there emission at the location of the weaker OVI line (Figure 5).
NGC 1549: There is very little Galactic absorption or extinction (1.571020 cm-2, and there is little evidence of H2 absorption (Figure 6). Absorption by Galactic atomic gas is present and the CII 1036 line (0.6 Å wide) lies in the middle of the redshifted OVI 1032 line, although emission near this region is seen in the Lif2b channel as well. The weaker line, OVI 1038, is in an uncontaminated region and it is detected with a FWHM of about 1.2 Å. The flux is elevated just to the blue side of the CII 1036 line, which may be the unabsorbed part of the OVI 1032 line. The line width is about 0.7 of the FWHM of the stellar velocity dispersion. There is no emission from CIII 977. There is a narrow emission line at the location of the Galactic OVI line.
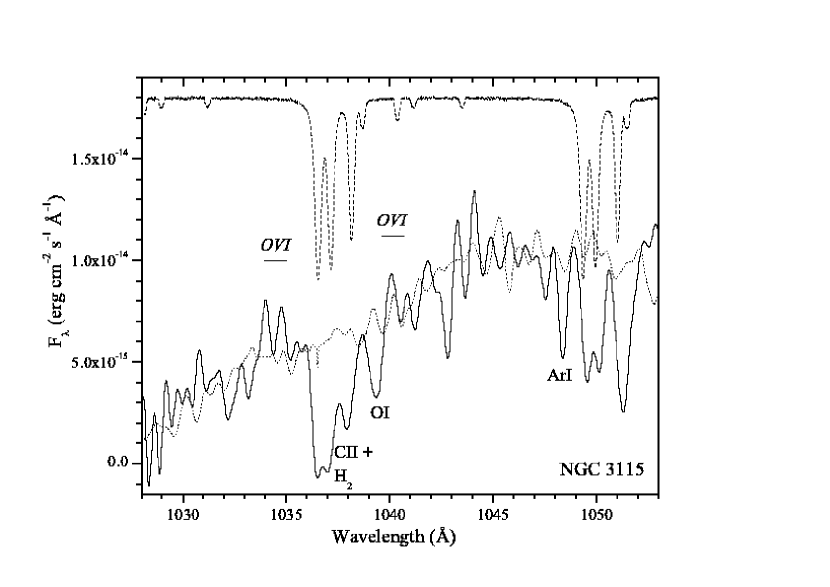
NGC 3115: Galactic molecular absorption lines are strong, but the redshifted OVI lines lie in uncontaminated parts of the spectrum. There is no emission from OVI (Figure 7).
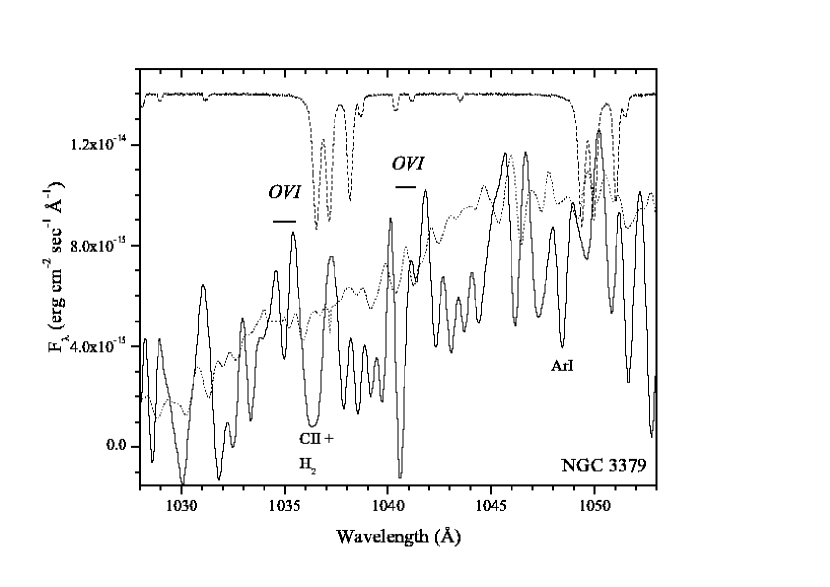
NGC 3379: The redshift of this galaxy places the OVI lines in a part of the spectrum uncontaminated by Galactic absorption. No OVI emission is found (Figure 8).
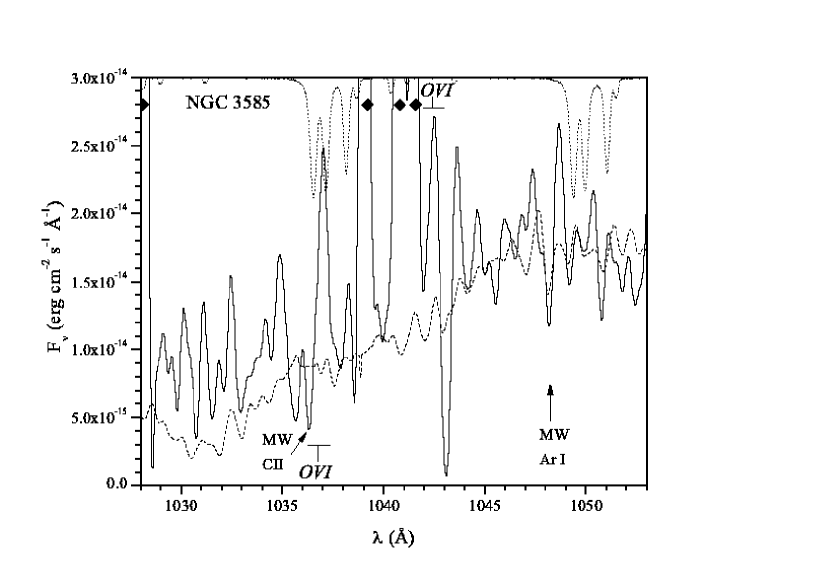
NGC 3585: This fairly isolated E7/S0 galaxy lies in a loose group and has moderate Galactic reddening and an HI column of 5.61020 cm-2. There were problems that occurred when this spectrum was being obtained, and of the 16 ksec exposure, only 3 ksec was acceptable, nearly all during the day (Figure 9). Consequently, the airglow lines are strong. Absorption by Galactic atomic and molecular gas is nearly absent, which is surprising given the column density of the gas. Due to the absence of the strong Galactic C II, Ar I and Fe II (1063.18 Å) lines, we do not believe this to be a reliable spectrum. This object may be reobserved at a future date but this data only provides a poorly constrained upper limit.
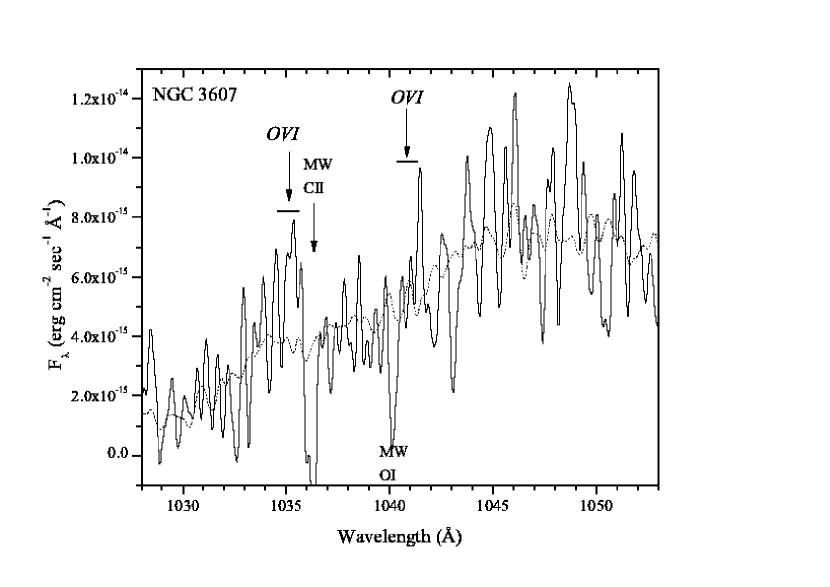
NGC 3607: The Galactic HI column and extinction are low toward this system (1.521020 cm-2) and there are no strong H2 absorption lines that can be identified. The only clear Galactic atomic absorption line is the CII 1036 feature, and the strong OVI line would be redshifted to 1035.2 Å, where there appear to be an emission feature (Figure 10). This feature also occurs in the lower S/N Lif2b channel, which does not add much to the S/N of this result, but provides some consistency. However, the emission from the weaker OVI line is not present, although since this line is only half the strength of the other OVI line, it’s absence does not lead to an inconsistency with the presence of the other line. The center of the OVI line is at 1035.3 Å, a redshift of 979 km sec-1 (and a FWHM of 0.50.1 Å, or 150 km sec-1), which is similar to the redshift of the galaxy, 935 km sec-1. In addition to the weak OVI line, the CIII 977 line is also detected at a somewhat higher level of significance and at exactly the redshift of the galaxy. It has a width of 0.720.15 Å, which is consistent with the width of the OVI line. A line width of 0.6 Å corresponds to 180 km sec-1, which is narrower than the FWHM that would be inferred from the stellar velocity dispersion (248 km sec-1, or a FWHM of 584 km sec-1).
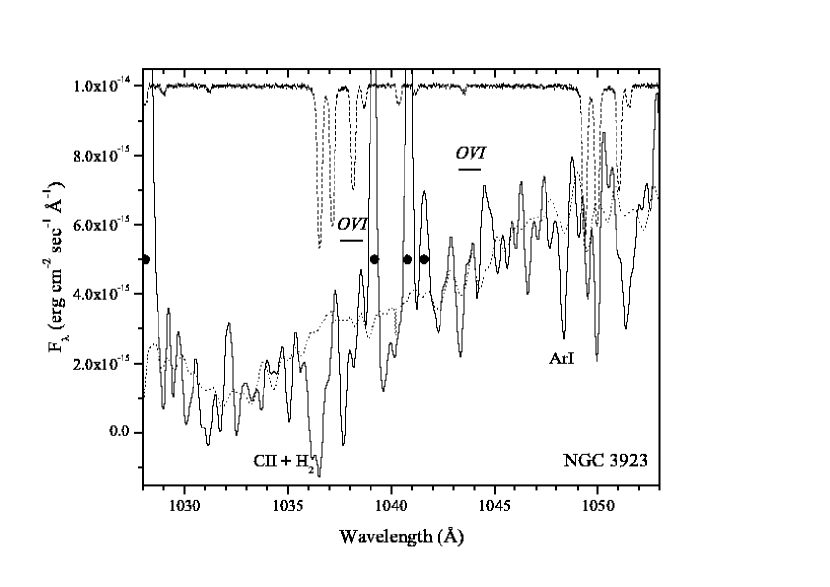
NGC 3923: This galaxy has significant extinction and a moderately large HI column (6.31020 cm-2), although the Galactic H2 lines are not especially strong. No emission lines are seen (Figure 11). The weaker OVI line is in an uncontaminated part of the spectrum, while the stronger OVI line would coincide with a weak Galactic H2 absorption line and is adjacent to strong airglow lines.
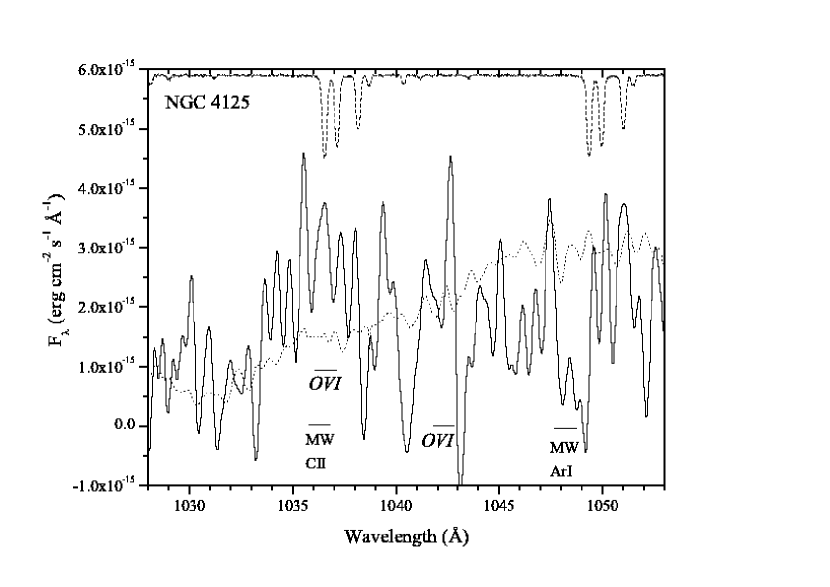
NGC 4125: The stellar continuum is very weak in this galaxy, despite one of the longest observations in the sample (Figure 12). The continuum is so poorly defined that no Galactic absorption lines can be identified. The night-only data (40% of the total exposure time) set yields stricter upper limits to the OVI emission. No emission features from any lines are detected, despite this galaxy being listed as a LINER and classified as E6 pec.
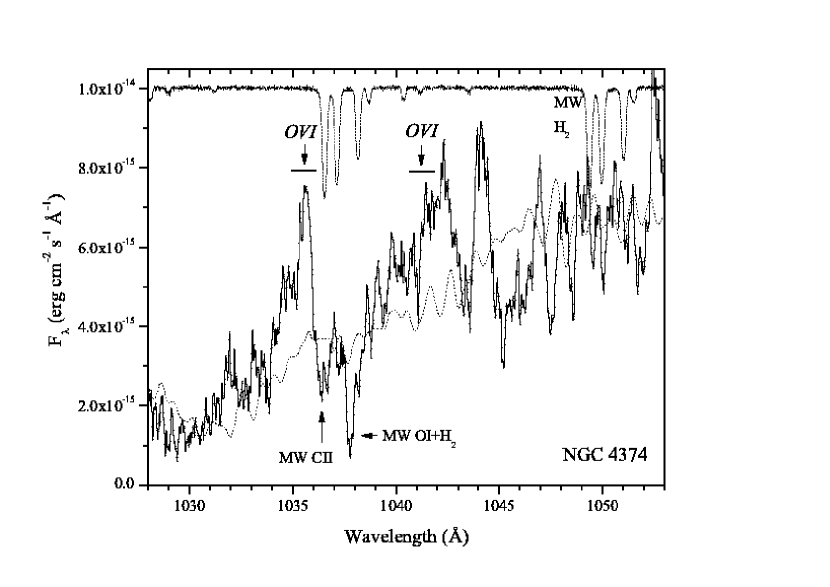
NGC 4374: This elliptical in the Virgo cluster has radio lobes and this is classified as a LINER. Despite being at high Galactic latitude (b = 74∘), it has moderate absorption and the FUSE spectrum (Figure 13) shows clear evidence for Galactic H2 absorption. The day spectrum had particularly strong airglow lines, so we used the night-only spectrum, which had only 3.7 ksec, yet it reveals a strong OVI 1032 at the galaxy redshift (also present at the same level in the day+night spectrum); the red side of the line may be partly absorbed by the Galactic CII 1036 line. The weaker OVI line lies between two airglow lines and there is an instrumental feature near 1044 Å, but a line half of the strength of the OVI 1032 line is consistent with the level of the spectrum above that expected from the stars. The line width of 130 km sec-1 (FWHM) is only about one-fifth the velocity dispersion of the stars, an equivalent FWHM of 674 km sec-1, although we cannot rule out that the line has a broader base.
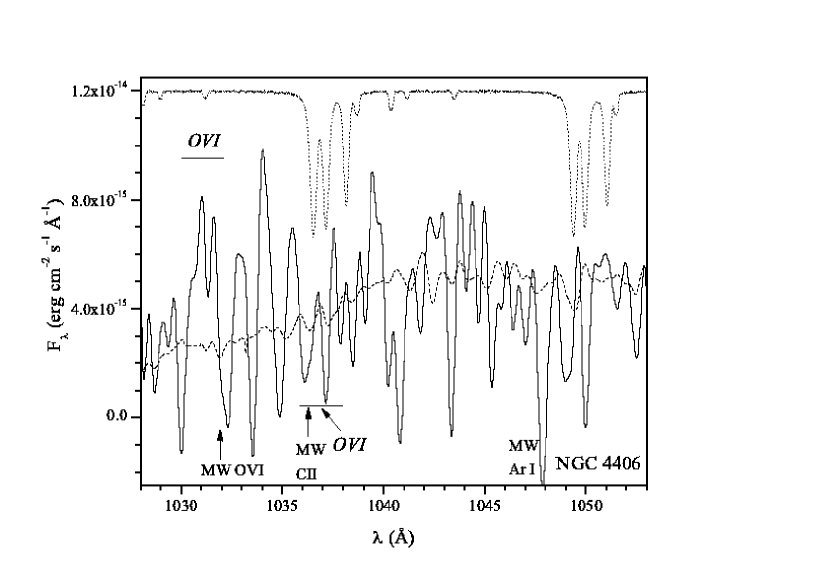
NGC 4406: Also known as M86, this lies in the central part of the cluster, 1.2∘ west of M87, and with a modest HI column (2.61020 cm-2). It has a nearly radial orbit, as its redshift (-244 km s-1) differs from the systemic velocity of the cluster by more than the cluster velocity dispersion. It has an elongated X-ray distribution that has been interpreted as stripping of the gas within NGC 4406 by the ambient cluster medium. The stellar continuum is very faint so that it is difficult to detect any Galactic absorption features (Figure 14). The stronger OVI line would be shifted to 1031.1 Å, and a possible emission feature in this low S/N spectrum occurs at that location. Although this is the broadest and most significant emission feature, it is less than a 3 detection. The weaker OVI line is not detected, nor are any other emission lines.
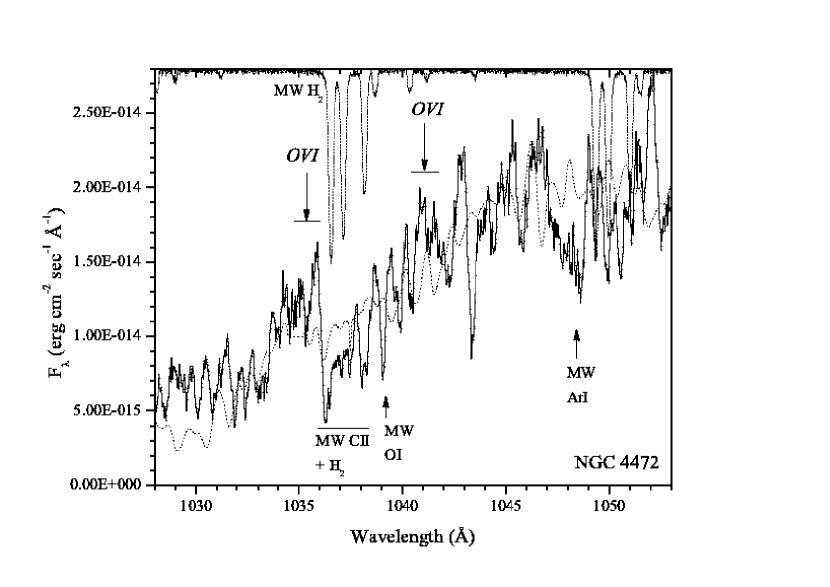
NGC 4472: Known as M49, this lies in the center of the southern grouping of the Virgo cluster. It has a modest Galactic HI column and extinction (1.651020 cm-2), but it has clear Galactic H2 absorption. There is an indication of a OVI 1032 line associated with NGC 4472, although if present, it is redshifted relative to the systemic velocity of the galaxy by about 0.4 Å (120 km sec-1; Figure 15). There is a minor peak at the location of the redshifted OVI 1038 line in this night-only spectrum. We regard the OVI line emission as a possible detection. The line width of FWHM = 120 km sec-1 is about 18% of the stellar velocity dispersion expressed as a FWHM, 676 km sec-1. There is no indication of emission from the CII 977 line.
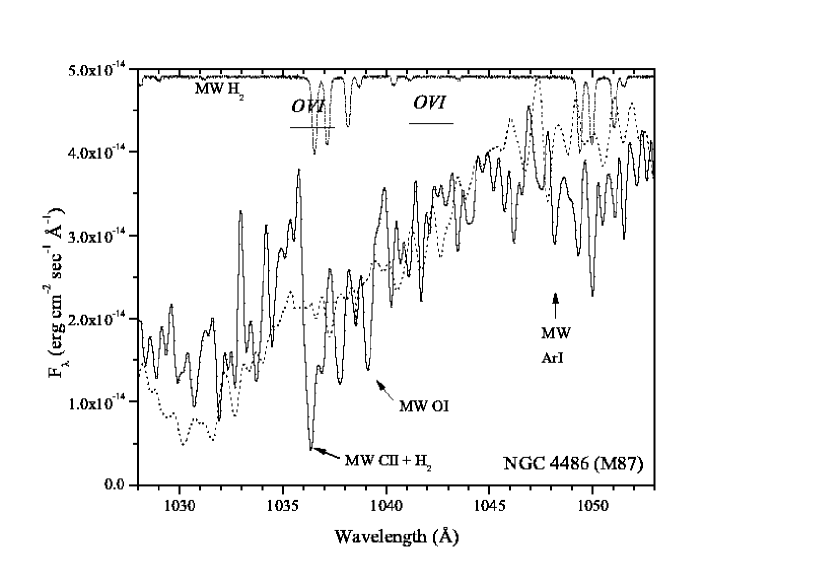
NGC 4486: This central galaxy of the Virgo cluster (M87) has low extinction but measurable lines of Galactic atomic and molecular gas. Unfortunately, the Galactic CII 1036 line (1036.3 Å) is coincident with the redshifted OVI 1032 line (at 1036.4 Å) and there are Galactic H2 lines to the red side of the Galactic CII line, so much of a redshifted OVI 1032 line would be absorbed (Figure 16). Nevertheless, to the blue side of the Galactic CII line, the continuum rises well above the expected stellar continuum (in both the Lif1a and Lif2b spectra), suggestive of the blue side of a wide OVI 1032 line from M87. If this is the case, the line width would needs to be about 1.5 Å (FWHM) and at least 1.2 Å. If it is 1.5 Å, we estimate a line strength of 710-15 erg cm-2 sec-1, which is consistent with the upper limit to the weaker OVI line of 510-15 erg cm-2 sec-1.
The CIII 977 line is detected, with a line width of 1.4 Å, although it could be wider since the red side is absorbed by Galactic H2 lines; ignoring absorption by these lines, the line flux is 1.510-14 erg cm-2 sec-1, stronger than the OVI line. If the H2 absorption produces the decrease in the red side of the line, the line flux and line width would be about 30% larger.
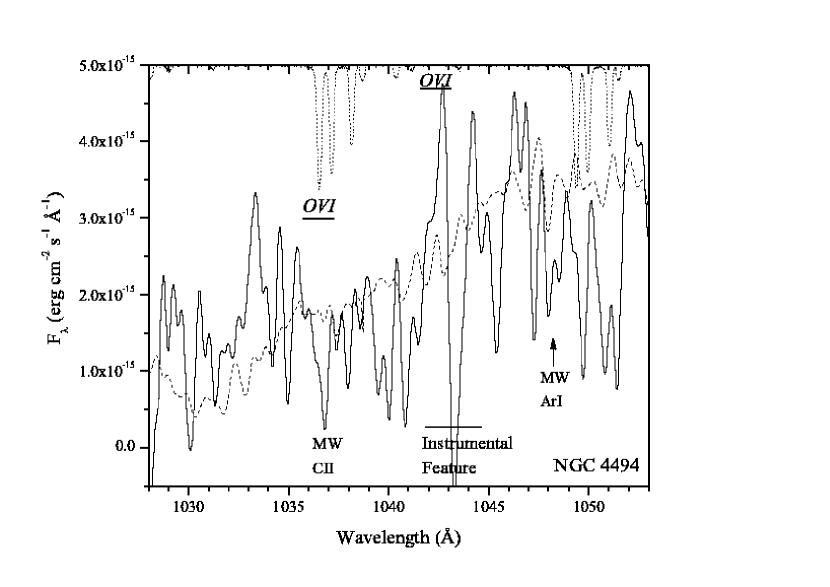
NGC 4494: The redshifted OVI 1032 line (1036.6 Å) lies in the Galactic CII absorption line (1036.34 Å), but there is no emission line on either side of the CII line (Figure 17). There is no evidence for the redshifted OVI 1038 line either, although it falls on an instrumental feature in the Lif1a channel. In the less sensitive Lif2b channel, there is no indication of either OVI line, and there is no instrumental feature near the weaker line.
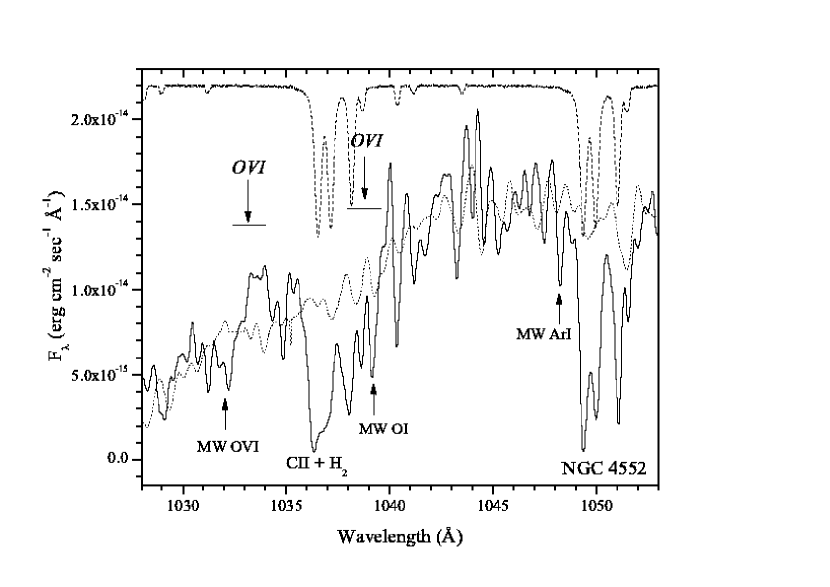
NGC 4552: This galaxy (M89) also lies in the Virgo cluster, but has slightly more extinction than most other members (2.561020 cm-2) and shows clear evidence of Galactic molecular hydrogen absorption. Although Galactic atomic and molecular absorption compromises our ability to detect the redshifted OVI 1038 line, the redshifted OVI 1032 line is in a part of the spectrum that is uncontaminated by Galactic absorption or airglow (Figure 18). There is an emission feature near the redshift of the systemic velocity of the galaxy (for the OVI 1032 line), although the center of the emission feature is redshifted relative to the systemic velocity by about 0.5 Å (150 km sec-1; the stellar velocity dispersion is 260 km sec-1, or an equivalent FWHM of 615 km sec-1, so the line shift is well within the velocity dispersion value). The OVI 1032 line is visible on both the Lif1a and Lif2b channels.
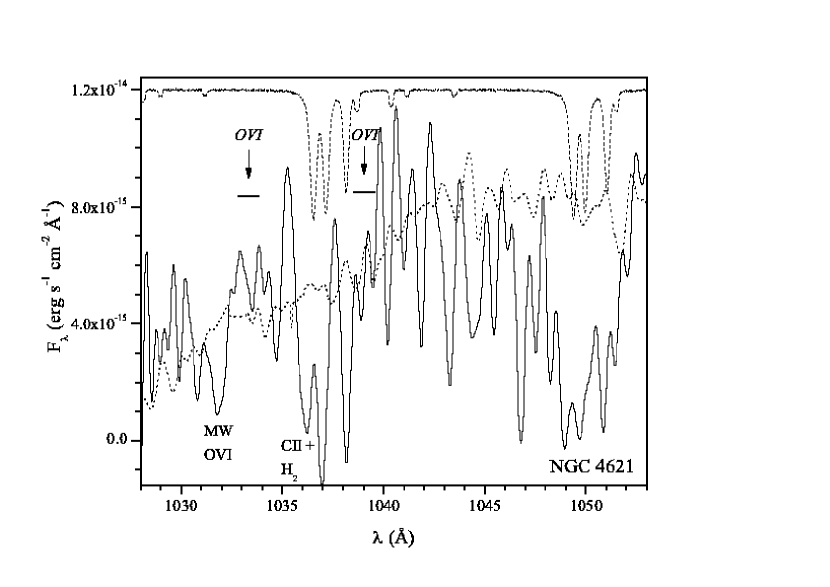
NGC 4621: This E5 galaxy (M59) lies about 3∘ west of M87 in the Virgo cluster, it has about the average extinction for the Virgo cluster (2.21020 cm-2), but it clearly shows Galactic H2 absorption along with the usual Galactic atomic absorption lines. However, the redshift of the galaxy places both OVI lines in uncontaminated regions and the spectrum is of moderately good S/N (Figure 19). There is no evidence for emission lines of either OVI line or of CIII.
NGC 4636: This Virgo cluster galaxy was presented by Bregman, Miller, and Irwin (2001), who reported the detection of both OVI lines. The width of the emission lines but not the line strength seems to depend upon the version of the pipeline used; these results employ pipeline version 2.4 (Figure 20). The CIII line may be detected, although the centroid is 120 km sec-1 (0.4 Å) blueward of the expected line center (the line would have a FWHM of 0.5 Å and a flux of 510-15 erg cm-2 sec-1, detected at about the 2 level).
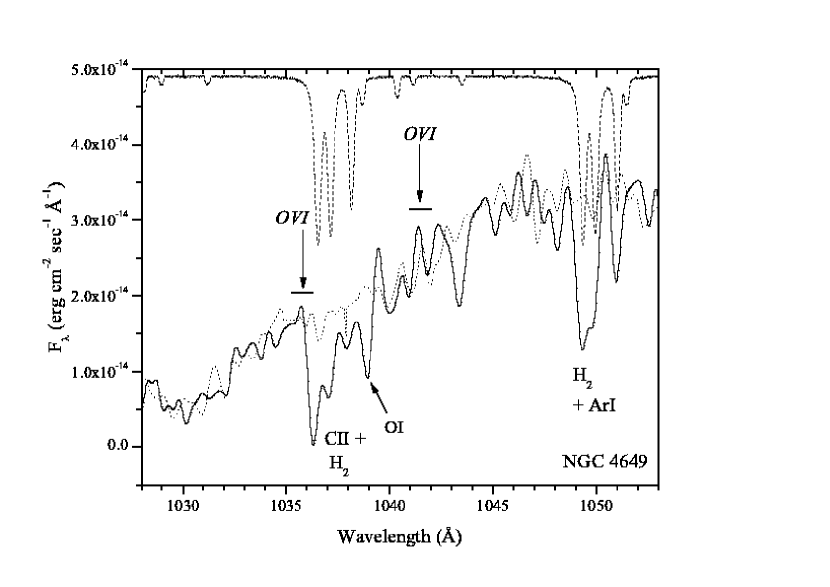
NGC 4649: The redshifted OVI 1032 line would be shifted (1035.8 Å) just to the blue side of the Galactic CII 1036 line (1036.3 Å), but there is no evidence for OVI emission above the level of the rather strong stellar continuum, which is similar to the continuum of NGC 1399 (Figure 21). There are moderately strong Galactic H2 lines and atomic absorption lines present, although these do not contaminate the locations of the OVI lines.
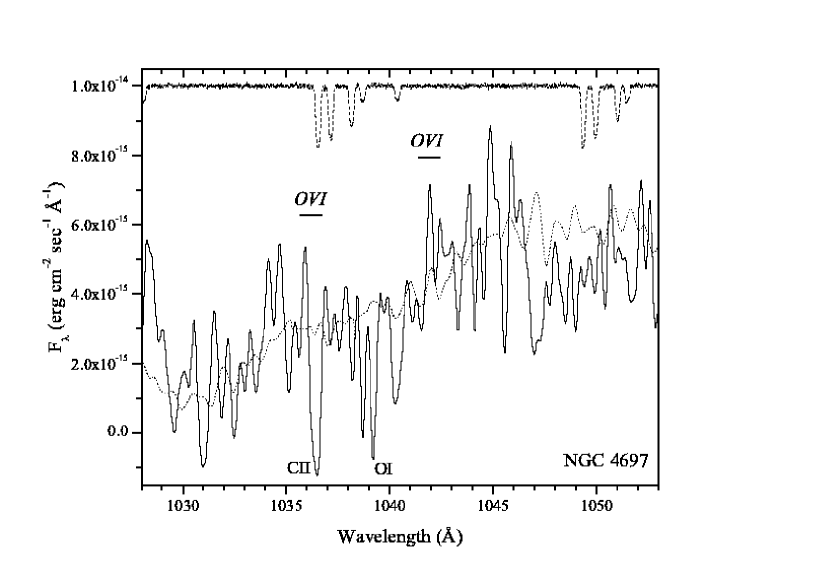
NGC 4697: The redshift of this galaxy would place the redshifted OVI 1032 line (1036.2 Å) into the strong Galactic CII absorption line (1036.34 Å). There is no strong line to the blue side of the CII line (Figure 22).
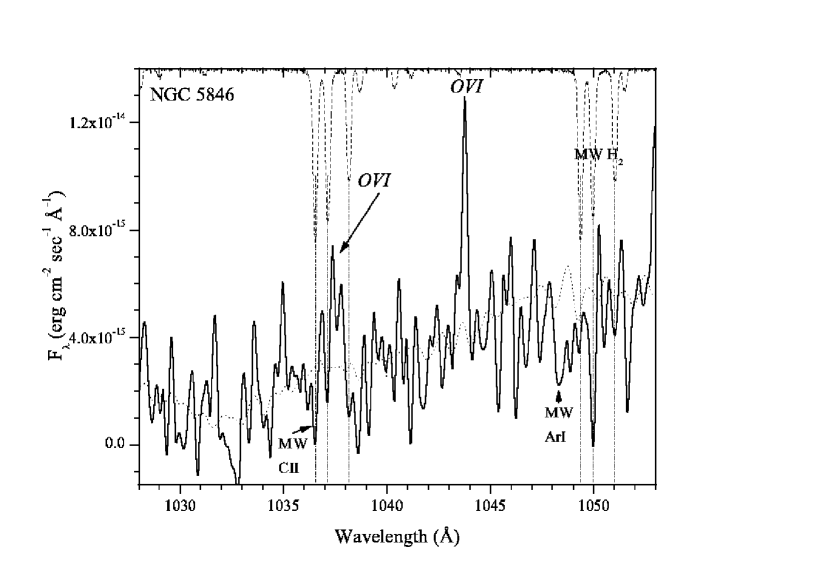
NGC 5846: This is the optically most luminous galaxy in the center of its group and it has a moderate amount of extinction (4.241020 cm-2), with evidence of absorption from Galactic molecular hydrogen and atomic lines. This is one of the more distant objects, so the continuum is fairly faint but is well-fit by the stellar continuum of NGC 1399 (Figure 23). Both the strong and weak redshifted OVI lines appear to be present, but not in the expected 2:1 ratio (for OVI 1032 to OVI 1038). The OVI 1032 line is broken up by Galactic molecular absorption features, so it could be significantly stronger. We cannot fit the H2 parameters well enough to make an accurate absorption correction for the OVI 1032 line. The usually weaker OVI 1038 line (redshifted to 1043.6 Å) falls close to a feature in the detector. Whereas this feature is stationary and well-known, we have seen instances of unusual absorption or emission near it, and this may contribute to the strength of this feature. The spectra in the Lif2b channel, while poorer, confirms the presence of the OVI 1032 line but not the OVI 1038 line. Consequently, we estimate the OVI luminosity from the OVI 1032 line. There is emission from the CIII 977 line at a flux of 7.710-14 erg cm-2 sec-1 (15% error), with a line width of 1.00.1 Å and a line center of 982.87 Å (at the systemic redshift, it would have been at 982.61 Å).
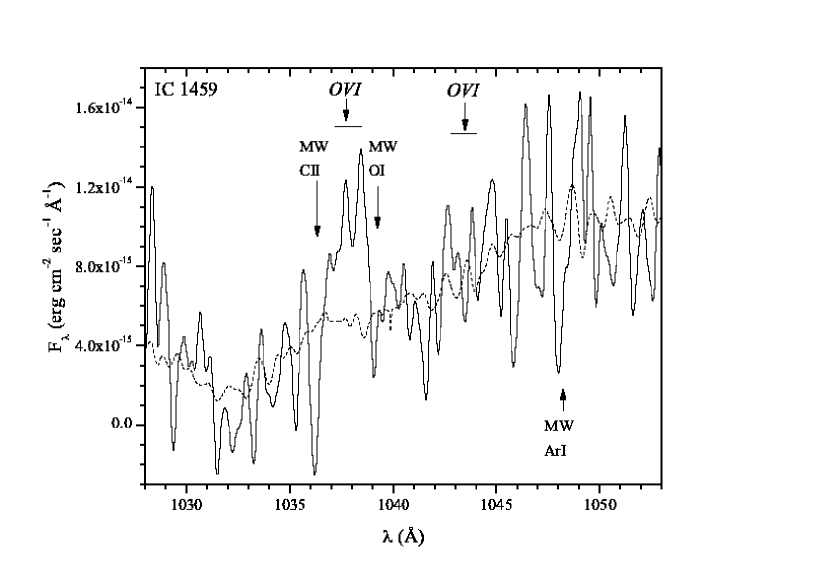
IC 1459: This galaxy has among the lowest Galactic HI column in the sample and very little reddening (1.191020 cm-2), although it has the usual Galactic atomic absorption lines that can be seen on the stellar continuum (Figure 24). The airglow lines are strong during the daytime observing, so although only 25% of the observing time was at night (only 2.5 ksec), the night-time data are better for the analysis of the OVI region, while the total data set is better for analysis in the CIII region. There is a broad emission line coincident with the strong redshifted OVI line, which is relatively uncontaminated by Galactic absorption features (also present in the Lif2b channel). The weaker OVI line is not detected at a statistically significant level, but as it is half the strength of the OVI 1032 line, this is not inconsistent with a detection of the OVI 1032 line. The CIII 977 line is also detected with a flux that is poorly determined because it is unclear where to mark the boundaries of the line. If we use the single peak, to the blue of line center, the line width is 0.8 Å (line flux of 1.310-14 erg cm-2 sec-1) and a line center at 982.0 Å (expected to be at 982.5 Å). If we use the weaker red part of the line as well, the line center is exactly that expected for the recession velocity, the line width becomes 2.1 Å (at a line flux of 2.110-14 erg cm-2 sec-1). Given the uncertainties associated with each of the lines, it is difficult to compare the OVI and CIII lines. This galaxy has a strong radio source and is known to be a LINER.
4 Analysis of the Sample
An important goal of the program is to test whether the X-ray cooling rate is a good predictor of the true cooling rate, which would be reflected in the OVI line luminosity, presumed to be a better measure of the net cooling rate. There certainly is not a one-to-one relationship between the X-ray value of () and the OVI value of (), such as for the galaxies NGC 1399 and NGC 1404, two of the most X-ray luminous sources but with no detectable OVI emission. However, there are statistical correlations between the X-ray and OVI cooling rates.
For the analysis of our sample, we have summarized the results in Table 3, where we give a variety of X-ray and optical properties, along with the OVI results. The measure of a detection is given by either upper limits, detections, or possible detections. The detections are lines whose strength exceeds 3 and where the signal appears clearly on the spectrum. Possible detections are generally near 3 threshold or where it has been difficult to establish the presence of the line unambiguously. There are a variety of issues, such as contamination from Galactic absorption line, airglow features, or uncertainties in the level of the underlying stellar continuum. For the purposes of scoring the detections in a simple non-parametic fashion, we assign 0 to upper limits, 0.5 to possible detections, and 1.0 to detections.
4.1 Determination of the OVI and X-Ray Cooling Rates
The conversion of the OVI luminosity to a cooling rate () has been calculated by Edgar and Chevalier (1986) and by Voit, Donahue, and Slavin (1994), and here we use the conversion L(1032) = 91038 erg/sec, where is in M⊙ yr-1 (as used in BMI). This is probably accurate to 30%, where the uncertainty derives from issues such as whether the cooling gas is isobaric or isochoric. This is most likely an uncertainty in the absolute calibration and is unlikely to cause an additional random scatter of 30%. The quantity is fairly insensitive to the metallicity provided that the metals remain the primary cooling agent (Edgar and Chevalier 1986). In the temperature range where OVI is the most prominent ion (near 105.3 K), this requirement is satisfied for metallicities greater than 10-2 of the Solar value (see Sutherland and Dopita 1993).
We wish to compare the OVI cooling rate to the X-ray cooling rate within the FUSE aperture, and this depends somewhat on whether gas cools primarily in the center or in a distributed manner throughout the galaxy. Effectively, the X-ray cooling rate is , where is the net cooling rate (the X-ray luminosity, if there is no opposing heat source) and E is the specific thermal energy of the gas. The factor represents the model correction due to fluid effects, such as gravitational reheating as gas flows inward or a sink of mass as gas cools out of the flow, which can be extracted from model calculations, such as Sarazin and Ashe (1989). We discussed the differences between the predictions in the various models previously (BMI) and here we use the value = 0.4, corresponding to the q = 1 model. In this q = 1 model, gas loss is distributed through the galaxy in the sense that hot gas is converted locally to cold gas at a rate inversely proportional to the instantaneous cooling time as given by .
There is a second consideration in calculating , having to do with the FUSE aperture, a square 30 on a side, or an effective radius of 17. This is smaller than the effective optical radius (Re, typically 30-60) or of the extent of the X-ray emission, which is similar to the optical size. If we were to adopt the cooling flow model without mass drop out, all of the cooling would occur within the FUSE aperture (although this makes an X-ray surface brightness profile that is too sharply peaked in the center). If there is mass drop-out with radius, then we need to correct for only enclosing part of the cooling gas in the FUSE aperture. As described in BMI, this is accomplished by multiplying the total by the fraction of the X-ray luminosity projected into the FUSE aperture. Here we use the value of for the distributed model (q=1), corrected to the size of the FUSE aperture. If we had used the model with no mass drop-out (q=0), the median predicted value of hardly changes, although for the most X-ray luminous galaxies in the sample (often the largest), the predicted could be a factor of two higher. The various values of and other relevant derived quantities, including the X-ray luminosity, , and the X-ray temperature, are given in Table 3.
4.2 A Correlation Between the OVI and X-Ray Cooling Rates
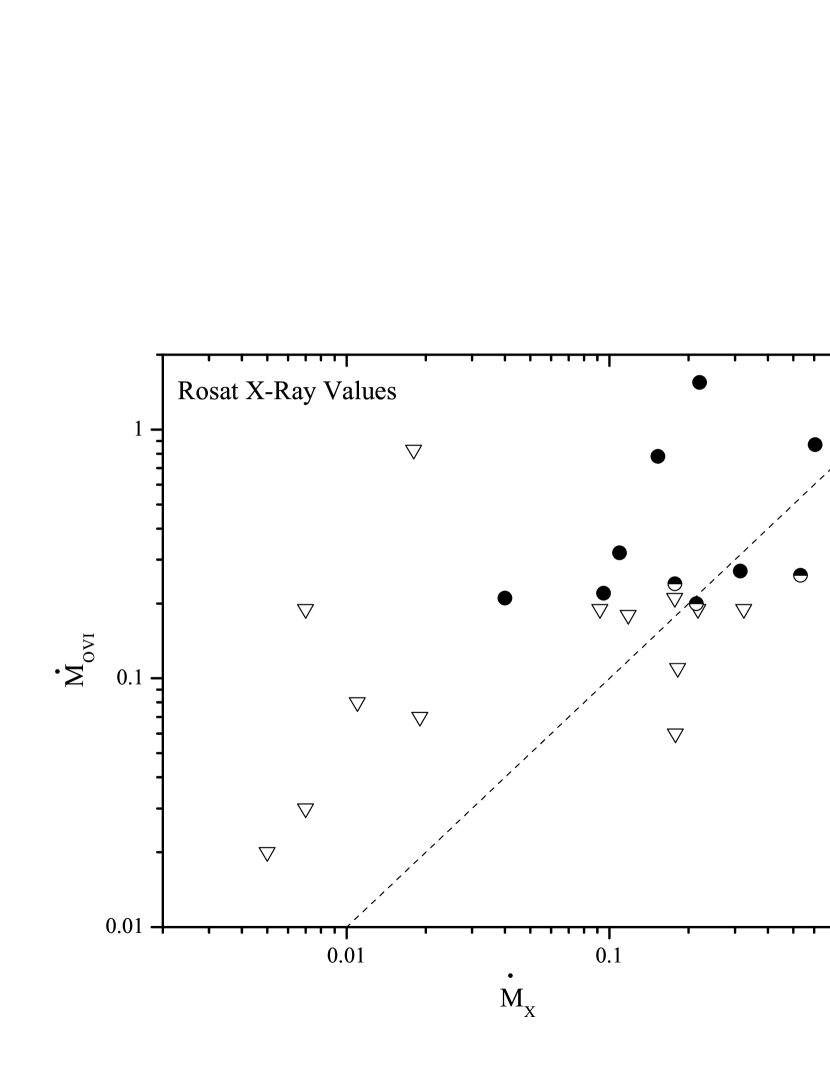
There is a complete set of ROSAT X-ray fluxes and luminosities for this sample, so we begin by comparing these to the OVI data. The nominal prediction was that there would be a connection between and the detection of OVI emission, but we examined other relationships as well. Some of those relationships investigated were between OVI and , , and , where no strong correlations were found and no strong relationships were predicted. However, there seems to be a correlation between the OVI and , as seen in Figure 25. We see that none of the six galaxies with the lowest values of have any OVI emission, yet the significance of this correlation is difficult to quantify. We would like to use the Kaplan-Meier estimator for the analysis of censored data (Isobe, Feigelson, and Nelson, 1986), but an underlying assumption is that the data are censored randomly. Here, the upper limits (censored data) are not randomly distributed, but preferentially occur at the lower values of . Also, we have introduced “possible” detections, which is difficult to incorporate in statistical schemes. Given these challenges, we can divide the sample into three bins by , using our scoring for detections, possible detections, and upper limits. We find that for galaxies with the lowest values, 1/8 have OVI, while 4.5/8 of the highest objects have OVI (and 3.5/8 of the intermediate objects have OVI). Using Poisson statistics, the joint probability that of the lowest objects, 1/8 (or fewer) have OVI while 4.5/8 (or more) of the highest objects have OVI would occur by chance 2.5% of the time (97.5% confidence level). The correlation is probably a bit stronger than this value since none of the lowest six object have either an OVI detection or possible detection. For a Kendall’s test or a Spearman’s test for the whole sample (treating upper limits and detections equally), the significance improves to 98-99.5% confidence, with the higher significance if the very poor upper limit object, NGC 3585 is eliminated from the sample. Conservatively, we conclude that the correlation exists at the 98% confidence level when using the ROSAT data.
A correlation is suggested between the OVI detectability and the radio luminosity, where the lowest third (in ) has 1.5/8 OVI detections, the middle third has 3/8 and the most luminous third has 4.5/8 OVI detections. When we divide the sample in halves instead of thirds, for the low radio luminosity group, only 1.5/12 have OVI detections while 7.5/12 of the radio luminous objects have OVI emission. This correlation is significant at the 93% confidence level (using Poisson statistics), so more objects would be required to confirm this result. If the correlation is real, it could be caused if the cooling gas eventually feeds the radio source, although there is not a good correlation between and . Alternatively, it might be possible for the AGN to heat the gas and produce OVI emission, and four of the radio luminous objects have CIII emission as well, although this could be consistent with cooling gas also.
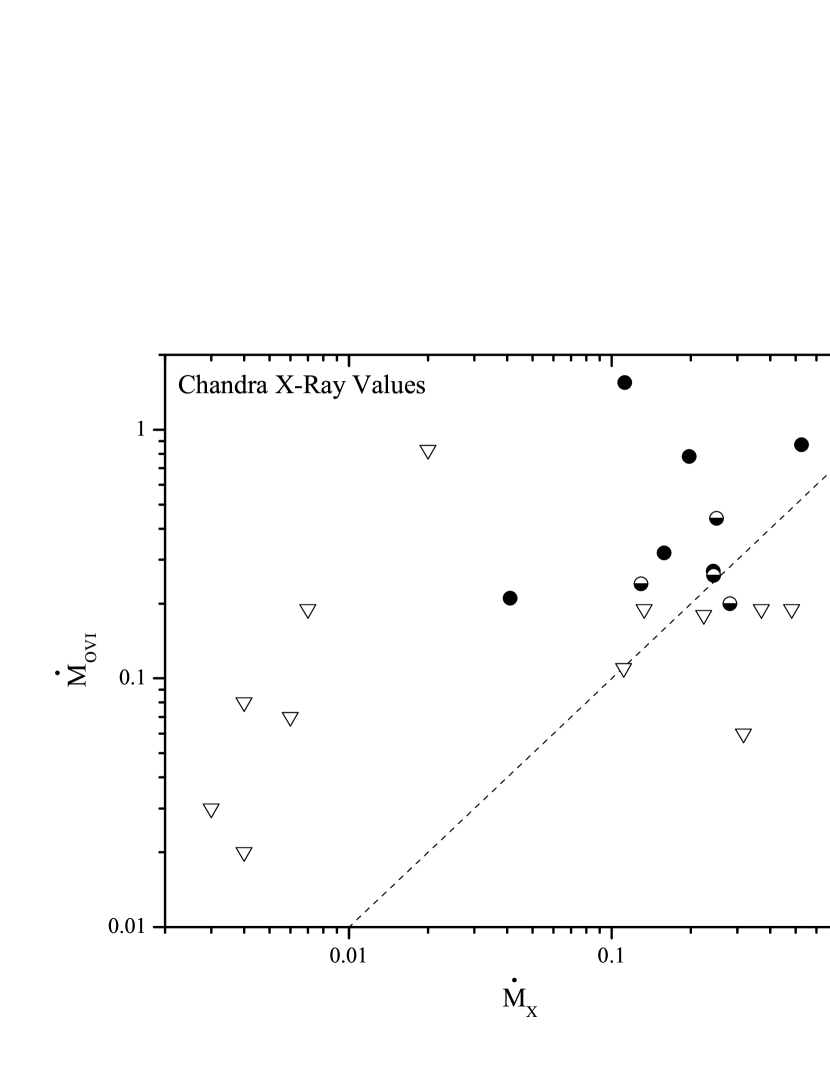
The Chandra data offer a number of advantages in determining X-ray properties, relative to the ROSAT data. First, the point sources can be removed from the observations, and a correction can be made for the unresolved point source contribution, yielding a more accurate measure of the properties of the X-ray emitting gas (Athey, 2003; Athey, Bregman, and Irwin, 2005). The most important observational quantities used to calculate are and (), with the surface brightness distribution, usually described by a model, being of less importance. The Chandra data not only provide better values for , but also for and for the model as well. However, the values of are typically in the range of 0.3-0.8 keV, so it is important to have observations that cover this low energy range adequately, and this is provided by the ACIS-S chip, which has sensitivity to 0.3 keV. The other detector used for imaging, ACIS-I, is three times less sensitive in the 0.5-1 keV range, it is insensitive below 0.5 keV, and it was subject to radiation damage during the early part of the mission. For these reasons, we do not include ACIS-I data in this program for galaxies where ROSAT data indicated that 0.5 keV. This affects two objects, NGC 1395 and NGC 3607, which are excluded from this analysis, making 22 objects with useful Chandra and FUSE data. This sample includes ACIS-I data for NGC 4486 (M87), a hotter galaxy, and we used the values given in the work of Matsushita et al. (2002).
Using the Chandra data, the relationship between and is little changed (Figure 26). The objects with the lowest values of are smaller in the Chandra data due to the removal of the X-ray point sources. The significance of the correlation is a bit lower for the Chandra data, mainly because of having two fewer objects (95% confidence of a correlation).
5 Interpretation of the Correlation and its Properties
The nominal cooling flow prediction is that there should be a relationship between and , but the relationship should be . This is nearly the case for the ROSAT data and is almost the case for the Chandra data, save appears to be about 20-30% too large, which is within the uncertainties in the model predictions. The more important discrepancy with the models is the very large scatter of for a fixed (the dispersion of the relationship). This occurs because there are several X-ray bright galaxies without OVI emission, such as NGC 4649 (the upper limit on is 5 times less than the prediction), NGC 1399 (2.6 time less than the prediction) and NGC 3923 (2 times below the prediction). These differences are much greater than the statistical uncertainties in the data. Also, there are some galaxies in which OVI is surprisingly bright: IC 1459 lies an order of magnitude above the predicted , NCG 1549 is five times above the prediction; and NGC 1316 is four times above the predicted value. Even if one were to suggest that an AGN were responsible for the high values of OVI, we are still left with the objects that are much fainter than predicted.
This broad dispersion about the relationship could be caused if cooling flows varied in time, as has been suggested for the cluster case (e.g., Kaiser and Binney 2003). Heating by an AGN could reheat the gas, choking off the cooling flow. If that were the case, one might expect that, in the moderate and high objects without OVI emission, the gas temperature would be above the velocity dispersion temperature, indicating that net heating is occurring. Similarly, the OVI emitters, at similar values of , should have temperatures at or below the stellar velocity dispersion temperature. However, we find no such trend in the data supporting this picture nor is there any correlation between the detection of OVI and -2 for the entire sample. Also, one might expect a division by radio properties, assuming that this is a proxy for AGN activity. Yet the objects furthest above the line, = , are not obviously different in their radio properties than those furthest below that line. Therefore, within the context of the cooling flow picture, time variation in the flow rate is necessary to explain the OVI detection properties, yet we do not find telltale signs that should accompany intermittent heating.
Another possibility is that the OVI emission is not a result of cooling gas, but a result of gas being heated, such as by thermal conduction. However, there is a very large difference in the emission line strength between gas that is radiatively cooling and gas that is being conductively heated. This difference, which is typically a factor of 103-104 (Canizares et al. 1993), means that to achieve the same line flux for conductively heated gas, the mass flux rate would have to be typically 102-103 M⊙ yr-1 instead of a cooling rate of 0.1-1 M⊙ yr-1. If this cold gaseous reservoir is HI or H2, the mass would have to be less than typical upper limits for the galaxies in this sample, about 108.5 M⊙, with some galaxies having significantly stricter upper limits (Roberts et al., 1991; Bregman, Hogg, and Roberts, 1992). At a conduction rate of 102.5 M⊙ yr-1, this would lead to a lifetime for the cold gas reservoir of 106 yr, so the gas would have to be replenished every 106 yr by the amount of gas found in galaxies about one-tenth the mass of the Milky Way. The orbital interaction time would be about 108 yr, so we should see many of these galaxies passing through the early-type galaxy, which is not the case. Consequently, it seems unlikely that conductive heating of gas could produce the lines that we observe.
A final issue is whether the gas is undergoing simple radiative cooling or whether turbulent mixing layers play a role (Slavin, Shull, and Begelman, 1993). In this case, the mixing would be between the hot ambient medium and gas that has already cooled, and this process can cause gas to spend less time at a given temperature compared to the pure radiative model. This has been suggested as a process within cluster cooling flows in order to remain consistent with the discrepancy between the observed and predicted strength of the X-ray OVII line within the cooling flow model (Fabian et al. 2001). A similar discrepancy exists for NGC 4636, where the OVII line is weaker than expected for gas cooling at the rate derived from the FUSE data (Xu et al. 2003). If turbulent mixing causes gas to effectively jump over the OVII temperature region ( 106 K), it could solve this issue, but it also makes the prediction that there will be emission from the CIV 1550 line at a luminosity greater than the OVI doublet. Unfortunately, there is presently no instrument that can measure the CIV 1550 line with the required sensitivity.
6 Future Prospects
The use of OVI emission has given a new insight into the properties of the hot gas in early-type galaxies, and this study highlights the need for further investigations. The greatest need is for a substantial increase in sensitivity, since most of the galaxies were not detected and even the detections are typically at the 3-5 level. For objects with short exposure times ( 5 ksec), it should be possible to double or even triple the S/N with moderate investments of observing time (this applies to six objects in the sample, four of which are detections or possible detections). The other objects generally have exposure times of 5-10 ksec, requiring an additional 15-30 ksec per object (generally of night data) to double the S/N. For the objects with upper limits, improving the S/N by 2-3 will not make these objects secure detections even if there is a weak feature present. Improved studies of these objects, or of more distant sources will require a new instrument with at least an order of magnitude greater sensitivity. This instrumental goal should be achievable as FUSE is a rather small instrument by the standards of any space-based optical telescope (or even most X-ray telescopes).
References
- Athey (2003) Athey, A. 2003, Ph.D., University of Michigan
- Athey et al. (2002) Athey, A., Bregman, J.N., Bregman, J.D., Temi, P., and Sauvage, M. 2002, ApJ, 571, 272
- Athey, Bregman, and Irwin (2005) Athey, A.E., Bregman, J.N., and Irwin, J.A. 2005, ApJS, submitted
- Bregman, Hogg, and Roberts (1992) Bregman, J.N., Hogg, D.E., and Roberts, M.S. 1992, ApJ, 387, 484
- Bregman, Miller, and Irwin (2001) Bregman, J.N., Miller, E.D., and Irwin, J.A. 2001, ApJ, 553, L125
- Bregman et al. (1998) Bregman, J.N., Snider, B.A., Grego, L., and Cox, C.V. 1998, ApJ, 499, 670
- Brown and Bregman (2000) Brown, B.A., and Bregman, J.N. 2000, ApJ, 539, 592
- Brown and Bregman (1998) Brown, B.A., and Bregman, J.N. 1998, ApJ, 5495, L75.
- Brown et al. (1997) Brown, T.M., Ferguson, H.C., Davidsen, A.F., and Dorman, B. 1997, ApJ, 482, 685
- Cappellaro, Evans, and Turatto (1999) Cappellaro, E., Evans, R., and Turatto, M. 1999, A&A, 351, 459
- David, Forman, and Jones (1991) David, L.P., Forman, W., and Jones, C. 1991, ApJ, 369, 121
- Dickey and Lockman (1990) Dickey, J., and Lockman, F.J. 1990, ARA&A, 28, 215
- Edgar and Chevalier (1986) Edgar, R.J., and Chevalier, R.A. 1986, 310, L27
- Faber et al. (1989) Faber, S.M., et al. 1989, ApJS, 69, 763
- Isobe, Feigelson, and Nelson (1986) Isobe, T., Feigelson, E. D., and Nelson, P. I. 1986, ApJ, 306, 490
- Kaiser and Binney (2003) Kaiser, C.R., and Binney, J. 2003, MNRAS, 338, 837
- Knapp, Gunn, and Wynn-Williams (1992) Knapp, G.R., Gunn, J.E., and Wynn-Williams, C.G. 1992, ApJ, 399, 76
- Mathews and Brighenti (2003) Mathews, W.G., and Brighenti, F. 2003, ARA&A, 41, 191
- Matsushita et al. (2002) Matsushita, K., Belsole, E., Finoguenov, A., Böhringer, H. 2002, A&A, 386, 77
- O’Sullivan, Forbes, and Ponman (2001) O’Sullivan, E., Forbes, D.A., and Ponman, T.J. 2001, MNRAS, 328, 461
- O’Sullivan, Ponman, and Collins (2003) O’Sullivan, E., Ponman, T.J., and Collins, R.S. 2003, MNRAS, 340, 1375
- Pellegrini and Ciotti (1998) Pellegrini, S., and Ciotti, L. 1998, A&A, 433, 444
- Roberts et al. (1991) Roberts, M.S., Hogg, D.E., Bregman, J.N., Forman, W.R., and Jones, C. 1991, ApJS, 75, 751
- Sarazin and Ashe (1989) Sarazin, C.L. and Ashe, G.A. 1989, ApJ, 345, 22
- Schlegel, Finkbeiner, and Davis (1998) Schlegel, D.J., Finkbeiner, D.P., and Davis, M. 1998, ApJ, 500, 525
- Slavin, Shull, and Begelman (1993) Slavin, J.D., Shull, J.M., and Begelman, M.C. 1993, ApJ, 407, 83
- Sutherland and Dopita (1993) Sutherland, R.S., and Dopita, M.A. 1993, ApJS, 88, 253
- van den Bergh and Tammann (1991) van den Bergh, S., and Tammann, G.A. 1991, ARA&A, 29, 363
- Voit, Donahue, and Slavin (1994) Voit, G.M., Donahue, M., and Slavin, J.D. 1994, ApJS, 95, 87
| Galaxy | Vel | B0T | Re | A(B) | D | D | texp(tot) | texp(Nt) | |
|---|---|---|---|---|---|---|---|---|---|
| (km/s) | (mag) | () | (km s-1) | (mag) | (km s-1) | (Mpc) | (sec) | (sec) | |
| NGC 1316 | 1760 | 11.34 | 80.1 | 174 | 0.09 | 1422 | 20.3 | 18861 | 9166 |
| NGC 1395 | 1717 | 11.02 | 45.1 | 258 | 0.10 | 1990 | 28.4 | 16573 | 9875 |
| NGC 1399 | 1425 | 10.55 | 42.4 | 310 | 0.06 | 1422 | 20.3 | 16523 | 10956 |
| NGC 1404 | 1947 | 10.89 | 26.7 | 225 | 0.05 | 1422 | 20.3 | 7751 | 6363 |
| NGC 1407 | 1779 | 10.57 | 72.0 | 285 | 0.30 | 1990 | 28.4 | 16282 | 10287 |
| NGC 1549 | 1220 | 10.58 | 47.4 | 205 | 0.05 | 1213 | 17.3 | 17900 | 11868 |
| NGC 3115 | 720 | 9.95 | 32.3 | 266 | 0.21 | 1021 | 14.6 | 11561 | 8080 |
| NGC 3379 | 911 | 10.43 | 35.2 | 201 | 0.11 | 857 | 12.2 | 4002 | 2565 |
| NGC 3585 | 1399 | 10.53 | 38.0 | 220 | 0.28 | 1177 | 16.8 | 2998 | 2998 |
| NGC 3607 | 935 | 10.53 | 65.5 | 248 | 0.09 | 1991 | 28.4 | 12918 | 9131 |
| NGC 3923 | 1788 | 10.52 | 52.2 | 216 | 0.36 | 1583 | 22.6 | 15667 | 10420 |
| NGC 4125 | 1356 | 10.57 | 58.4 | 229 | 0.08 | 1986 | 28.4 | 25129 | 9366 |
| NGC 4374 | 1060 | 10.13 | 54.5 | 287 | 0.17 | 1333 | 19.0 | 6444 | 3692 |
| NGC 4406 | -244 | 9.87 | 101.7 | 250 | 0.12 | 1333 | 19.0 | 5378 | 4248 |
| NGC 4472 | 997 | 9.32 | 103.6 | 287 | 0.10 | 1333 | 19.0 | 5381 | 3732 |
| NGC 4486 | 1307 | 9.52 | 103.6 | 361 | 0.10 | 1333 | 19.0 | 3612 | 3612 |
| NGC 4494 | 1351 | 10.69 | 45.1 | 124 | 0.09 | 695 | 9.9 | 18616 | 12679 |
| NGC 4552 | 340 | 10.84 | 30.0 | 261 | 0.18 | 1333 | 19.0 | 11013 | 8623 |
| NGC 4621 | 410 | 10.65 | 45.5 | 240 | 0.10 | 1333 | 19.0 | 6747 | 3413 |
| NGC 4636 | 938 | 10.20 | 101.1 | 191 | 0.12 | 1333 | 19.0 | 6457 | 5137 |
| NGC 4649 | 1117 | 9.77 | 73.4 | 341 | 0.11 | 1333 | 19.0 | 15771 | 7192 |
| NGC 4697 | 1241 | 10.03 | 73.5 | 165 | 0.13 | 794 | 11.3 | 11712 | 9446 |
| NGC 5846 | 1714 | 10.67 | 82.6 | 278 | 0.24 | 2336 | 33.4 | 9636 | 7739 |
| IC 1459 | 1691 | 10.88 | 34.0 | 308 | 0.07 | 2225 | 31.8 | 10358 | 2563 |
| Galaxy | OVI 1032 | OVI 1038 | Detect | F(OVI 1032) | Err | FWHM | Err | CIII |
|---|---|---|---|---|---|---|---|---|
| (Å) | (Å) | erg s-1 cm-2 | erg s-1 cm-2 | (Å) | (Å) | |||
| NGC 1316 | 1037.99 | 1043.71 | Y | 1.1E-14 | 2.0E-15 | 1.5 | 0.2 | Y |
| NGC 1395 | 1037.84 | 1043.56 | UL | 1.5E-15 | N | |||
| NGC 1399 | 1036.84 | 1042.55 | UL | 3.0E-15 | N | |||
| NGC 1404 | 1038.63 | 1044.36 | UL | 3.0E-15 | N | |||
| NGC 1407 | 1038.05 | 1043.78 | UL | 7.0E-16 | N | |||
| NGC 1549 | 1036.13 | 1041.84 | Y | 4.6E-15 | 8.0E-16 | 1.2 | 0.2 | N |
| NGC 3115 | 1034.41 | 1040.11 | UL | 1.5E-15 | N | |||
| NGC 3379 | 1035.07 | 1040.77 | UL | 2.5E-15 | N | |||
| NGC 3585 | 1036.75 | 1042.46 | UL | 1.0E-14 | N | |||
| NGC 3607 | 1035.15 | 1040.86 | Y | 1.6E-15 | 7.0E-16 | 0.5 | 0.1 | Y |
| NGC 3923 | 1038.08 | 1043.81 | UL | 1.0E-15 | N | |||
| NGC 4125 | 1036.60 | 1042.31 | UL | 8.0E-16 | N | |||
| NGC 4374 | 1035.58 | 1041.29 | Y | 4.0E-15 | 6.0E-16 | N | ||
| NGC 4406 | 1031.09 | 1036.78 | P | 3.8E-15 | 1.5E-15 | 1 | 0.2 | N |
| NGC 4472 | 1035.36 | 1041.07 | P | 3.2E-15 | 1.0E-15 | 0.4 | 0.1 | N |
| NGC 4486 | 1036.43 | 1042.14 | P | 7.0E-15 | 3.0E-15 | P | ||
| NGC 4494 | 1036.58 | 1042.30 | UL | 1.0E-15 | N | |||
| NGC 4552 | 1033.10 | 1038.80 | P | 3.0E-15 | 1.0E-15 | 1 | 0.2 | N |
| NGC 4621 | 1033.34 | 1039.04 | UL | 3.0E-15 | N | |||
| NGC 4636 | 1035.16 | 1040.87 | Y | 3.9E-15 | 6.0E-16 | 1 | 0.2 | P |
| NGC 4649 | 1035.77 | 1041.49 | UL | 9.0E-16 | N | |||
| NGC 4697 | 1036.20 | 1041.92 | UL | 1.4E-15 | N | |||
| NGC 5846 | 1037.83 | 1043.55 | Y | 3.0E-15 | 1.0E-15 | 0.6 | 0.2 | Y |
| IC 1459 | 1037.75 | 1043.47 | Y | 9.5E-15 | 4.0E-15 | 1.5 | 0.5 | Y |
Note. — Y signifies a detection, P a possible detection, and UL an upper limit.
| FUSE | FUSE | ROSAT | ROSAT | ROSAT | Chandra | Chandra | Chandra | |||
|---|---|---|---|---|---|---|---|---|---|---|
| Galaxy | OVI | logL(OVI) | log | F(1.4 GHz) | ||||||
| erg s-1 | M⊙ yr-1 | erg s-1 | keV | M⊙ yr-1 | erg s-1 | keV | M⊙ yr-1 | Jy | ||
| NGC 1316 | Y | 38.85 | 0.78 | 40.79 | 0.35 | 0.15 | 40.77 | 0.58 | 0.20 | 120 |
| NGC 1395 | UL | 38.29 | 0.21 | 40.75 | 0.44 | 0.18 | UL | |||
| NGC 1399 | UL | 38.24 | 0.19 | 41.15 | 0.94 | 0.22 | 41.16 | 0.77 | 0.48 | 2.5 |
| NGC 1404 | UL | 38.23 | 0.19 | 40.98 | 0.56 | 0.32 | 40.54 | 0.63 | 0.13 | 0.0039 |
| NGC 1407 | UL | 38.20 | 0.18 | 41.05 | 0.91 | 0.12 | 41.00 | 0.68 | 0.22 | 0.088 |
| NGC 1549 | Y | 38.29 | 0.21 | 39.75 | 0.19 | 0.040 | 39.70 | 0.29 | 0.041 | UL |
| NGC 3115 | UL | 37.84 | 0.08 | 39.45 | 0.45 | 0.011 | 38.88 | 0.61 | 0.004 | 0.0012 |
| NGC 3379 | UL | 37.78 | 0.07 | 39.49 | 0.26 | 0.019 | 39.15 | 0.61 | 0.006 | 0.0024 |
| NGC 3585 | UL | 38.87 | 0.83 | 39.55 | 0.31 | 0.018 | 39.59 | 0.53 | 0.020 | UL |
| NGC 3607 | Y | 38.30 | 0.22 | 40.53 | 0.37 | 0.095 | 0.0069 | |||
| NGC 3923 | UL | 38.23 | 0.19 | 40.61 | 0.55 | 0.092 | 40.63 | 0.29 | 0.37 | UL |
| NGC 4125 | UL | 37.99 | 0.11 | 40.72 | 0.33 | 0.18 | 40.46 | 0.37 | 0.11 | 0.0025 |
| NGC 4374 | Y | 38.46 | 0.32 | 40.80 | 0.70 | 0.11 | 40.72 | 0.50 | 0.16 | 2.95 |
| NGC 4406 | P | 38.37 | 0.26 | 41.72 | 0.67 | 0.53 | 41.35 | 0.67 | 0.24 | UL |
| NGC 4472 | P | 38.26 | 0.20 | 41.48 | 0.94 | 0.21 | 41.26 | 0.72 | 0.28 | 0.22 |
| NGC 4486 | P | 38.60 | 0.44 | 42.00 | 0.80 | 0.84 | 42.40 | 1.70 | 0.25 | 38.5 |
| NGC 4494 | UL | 37.19 | 0.02 | 38.99 | 0.30 | 0.005 | 38.78 | 0.48 | 0.004 | 0.0035 |
| NGC 4552 | P | 38.33 | 0.24 | 40.63 | 0.43 | 0.18 | 40.39 | 0.55 | 0.13 | 0.1 |
| NGC 4621 | UL | 38.24 | 0.19 | 39.50 | 0.63 | 0.007 | 39.25 | 0.63 | 0.007 | UL |
| NGC 4636 | Y | 38.38 | 0.27 | 41.52 | 0.72 | 0.31 | 41.26 | 0.68 | 0.24 | 0.079 |
| NGC 4649 | UL | 37.73 | 0.06 | 41.19 | 0.82 | 0.18 | 41.09 | 0.76 | 0.32 | 0.029 |
| NGC 4697 | UL | 37.50 | 0.03 | 39.84 | 0.30 | 0.007 | 39.30 | 0.60 | 0.003 | UL |
| NGC 5846 | Y | 38.90 | 0.87 | 41.72 | 0.73 | 0.61 | 41.55 | 0.63 | 0.53 | 0.021 |
| IC 1459 | Y | 39.14 | 1.55 | 40.90 | 0.6 | 0.22 | 40.30 | 0.59 | 0.11 | 0.97 |
Note. — Y signifies a detection, P a possible detection, and UL an upper limit.