Atmospheric Chemistry in Giant Planets, Brown Dwarfs, and Low-Mass Dwarf Stars II. Sulfur and Phosphorus
Abstract
Thermochemical equilibrium and kinetic calculations are used to model sulfur and phosphorus chemistry in giant planets, brown dwarfs, and extrasolar giant planets (EGPs). The chemical behavior of individual S- and P-bearing gases and condensates is determined as a function of pressure, temperature, and metallicity. The results are independent of particular model atmospheres and, in principle, the equilibrium composition along the pressure-temperature profile of any object can be determined. Hydrogen sulfide (H2S) is the dominant S-bearing gas throughout substellar atmospheres and approximately represents the atmospheric sulfur inventory. Silicon sulfide (SiS) is a potential tracer of weather in substellar atmospheres. Disequilibrium abundances of phosphine (PH3) approximately representative of the total atmospheric phosphorus inventory are expected to be mixed upward into the observable atmospheres of giant planets and T dwarfs. In hotter objects, several P-bearing gases (e.g., P2, PH3, PH2, PH, HCP) become increasingly important at high temperatures.
1 Introduction
The relatively cool, dense atmospheres of substellar objects – gas giant planets, brown dwarfs, and extrasolar giant planets (EGPs) – are ideal environments for the formation of molecules and condensates and the establishment of equilibrium chemistry. For this reason, thermochemical models have been essential for interpreting and guiding spectroscopic observations of the atmospheres of giant planets (e.g., see Lewis, 1969a, b; Barshay & Lewis, 1978; Fegley & Lewis, 1979; Fegley & Prinn, 1985, 1988; Fegley et al., 1991; Fegley & Lodders 1994, 94) and brown dwarfs (e.g., Fegley & Lodders, 1996). These models have also been useful for explaining how the optical and infrared spectra of substellar objects are influenced by CNO (Lodders & Fegley 2002, 02), alkali (Lodders, 1999a), Ti and V (Lodders, 2002), and condensation (e.g., Lodders & Fegley, 2006) chemistry.
After H, C, N, and O, sulfur and phosphorus are the next most abundant chemically reactive volatile elements in a solar system composition gas. Fegley & Lodders (1994; hereafter FL94) modeled the chemistry of all naturally occurring elements, including S and P, along the atmospheric profiles of Jupiter and Saturn. Recently, Lodders & Fegley (2002; hereafter LF02) modeled CNO chemistry in substellar objects as a function of pressure, temperature, and metallicity. Here we continue and extend these studies by employing thermochemical equilibrium and kinetic calculations to model sulfur and phosphorus chemistry in the atmospheres of substellar objects.
Our approach is similar to that of LF (02). We compute the chemistry of S- and P-bearing gases and condensates as a function of total pressure, temperature, and metallicity, and our abundance results are independent of any particular atmospheric profile. In principle, the pressure-temperature profile for any substellar object may be superimposed on our abundance contour diagrams to find the equilibrium composition along the profile.
The paper is organized as follows. In section (2) we describe our computational methods. In 3 we describe sulfur chemistry in a solar system composition gas: we identify major gases and condensates, and discuss the chemistry of individual S-bearing species as a function of total pressure, temperature, and metallicity. We then apply our results by examining the sulfur species along the atmospheric profiles of representative substellar objects. A similar treatment of phosphorus chemistry follows in 4. We discuss the relative roles of thermochemistry and photochemistry in 5, and conclude with a brief summary (6).
2 Computational Methods
Thermochemical equilibrium calculations were performed using a Gibbs free energy minimization code, previously used for modeling the atmospheric chemistry of Saturn (Visscher & Fegley, 2005). Where relevant, we considered the effects of vertical mixing on the abundances of gases (e.g., PH3) which serve as chemical probes of the deep atmospheres of Jupiter and Saturn. This was done using a chemical dynamical model described in Fegley & Prinn (1985). We generally focus on temperatures of 1000 K and higher, where thermochemistry is expected to be much more important than photochemistry in the atmospheres of extrasolar giant planets close to their primary stars. Further discussion of thermochemical vs. photochemical processes is given in §5.
Thermodynamic data for the equilibrium calculations were taken from the compilations of Gurvich et al. (1989-1994), Robie & Hemingway (1995), the fourth edition of the JANAF Tables (Chase, 1999), and the thermodynamic database maintained in the Planetary Chemistry Laboratory (FL, 94; LF, 02). This database includes additional thermodynamic data from the literature for compounds absent from the other compilations, as well as several important data revisions for the sulfur and phosphorus species SH, S2O, NS, PS, PH, PH3, PN, and Mg3P2O8 (s), which are incorrect in the JANAF tables (Lodders, 1999b, 2004a). Thermodynamic data for P4O6 was taken from the JANAF tables for reasons cited in FL (94).
All calculations were done with solar system (i.e., protosolar) elemental abundances from Lodders (2003). The effect of metallicity on sulfur and phosphorus chemistry was examined by running computations at [M/H] = -0.5 dex (subsolar), [M/H] = 0 dex (solar), and [M/H] = +0.5 dex (enhanced) metallicities, where M is any element of interest (e.g., S, P, C, O)111We use the conventional notation [M/H] .. The metallicity factor, , is defined as . Stellar abundance determinations show that element abundance ratios [M/H] for elements of interest here vary similarly with [Fe/H] between dex (Edvardsson et al., 1993; Gustafsson et al., 1999; Chen et al., 2000; Smith et al., 2001; Ecuvillon et al., 2004; Huang et al., 2005), consistent with what one may expect from galactic chemical evolution models (e.g., Timmes et al., 1995). The slopes for fits of [M/H] vs. [Fe/H] are about 0.61, 0.65, and 0.6 for M = C, S, and O, respectively, which justifies our approach of “uniform” metallicity variations for these elements (e.g., [S/H] [P/H] [C/H] [O/H] [M/H]) over the metallicity range considered here. Because phosphorus has weak lines, galactic chemical evolution models are used to estimate P abundances as a function of metallicity (e.g., Timmes et al., 1995; Samland, 1998). We thus assume a similar enrichment in phosphorus as for other heavy elements. However, the effects of metallicity on chemical equilibrium abundances are explicitly treated below and can be used to study effects from non-uniform elemental abundance enrichments.
For each S- and P-bearing species, we discuss how the most plausible representative net thermochemical formation reaction depends on temperature, total pressure, and metallicity. For example, consider the formation of thioxophosphino (PS) via the net thermochemical reaction
This endothermic reaction proceeds toward the right with increasing temperature and the PS abundance increases. According to LeChâtelier’s principle, this reaction also proceeds toward the right with decreasing pressure because there are 2 gas molecules on the left and 3.5 gas molecules on the right. Writing out the equilibrium constant () expression for PS in terms of the total pressure () and mole fractions222The mole fraction abundance for a gas is defined as .
shows that the mole fraction of PS is proportional to . The metallicity dependence of enters only through the PH3 and H2S abundances, whereas the H2 abundance is metallicity-independent by definition. Phosphine and H2S are typically the most abundant P- and S-bearing gases, respectively. Hence and must each be expanded with a metallicity factor , which results in an overall metallicity dependence for , assuming [S/H] = [P/H] (see above). This basic approach is used to describe the equilibrium chemical behavior of each S- and P-bearing species throughout the paper.
3 Sulfur Chemistry
3.1 Sulfur Gas Chemistry
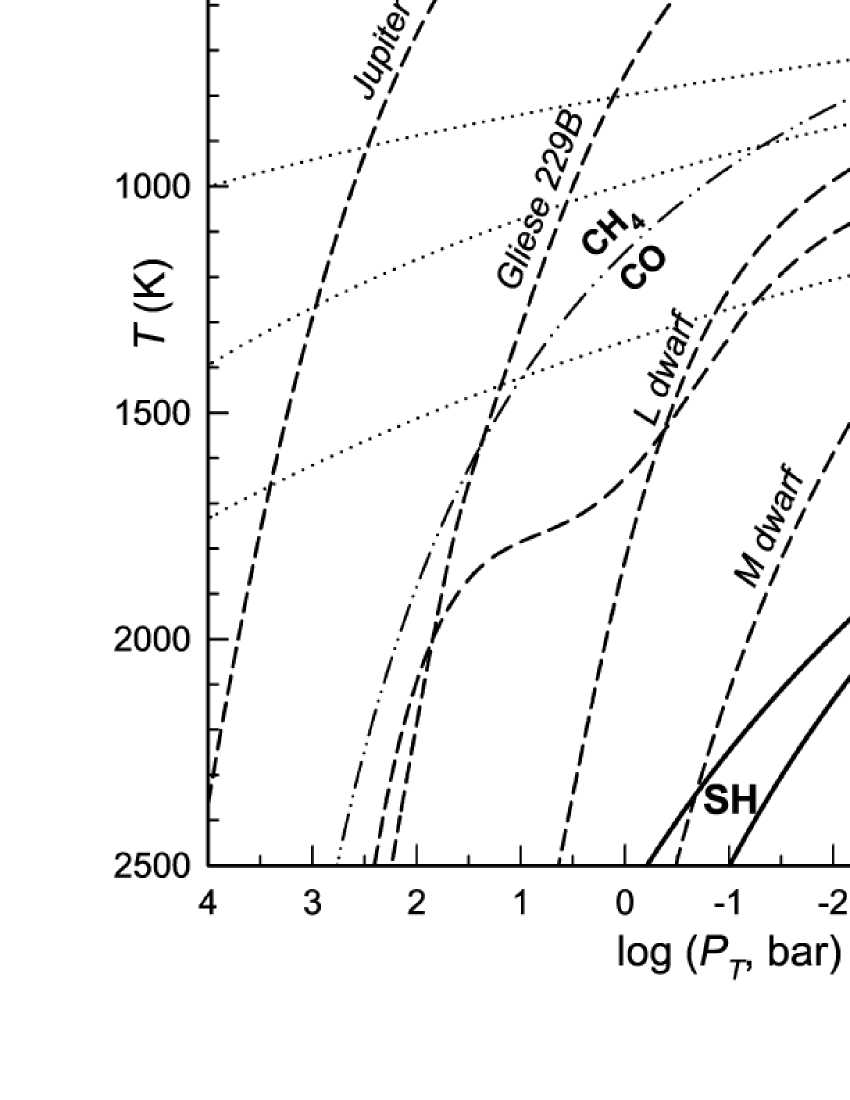
The sulfur equilibrium gas chemistry as a function of temperature and total pressure in a protosolar composition gas is illustrated in Figure 1. The most abundant gases are H2S, SH, or monatomic S, and the P-T regions where each gas is dominant are bounded by solid lines. Also shown are condensation curves (dotted lines) for S-bearing condensates (see 3.2) and the H2=H and CH4=CO equal abundance curves (dash-dot lines). Model atmosphere profiles for Jupiter ( = 124 K, ), the T dwarf Gliese 229B ( = 960 K, ; Marley et al., 1996), the close-orbiting EGP (or “Pegasi” planet) HD209458b ( = 1350 K, ; Iro et al., 2005), an L dwarf ( = 1800 K, ; Burrows et al., 2006), and an M dwarf ( = 2600 K, dust-free, ; Tsuji et al., 1996) are indicated by dashed lines. The overall chemistry in the atmospheres of Jupiter and Gliese 229B differs slightly from the chemistry of a solar metallicity gas because Jupiter has a heavy element enrichment comparable to [M/H] +0.5 dex (Lodders, 1999a; LF, 02), whereas Gliese 229B likely has a subsolar metallicity of [M/H] -0.3 dex (Saumon et al., 2000); their P-T profiles are shown here for reference. However, as described below, the P-T boundaries for the sulfur gases in Figure 1 are metallicity independent. This is because the P-T boundaries are defined by equal abundance ratios of the neighboring gases (e.g., H2S/SH, SH/S, H2S/S), so that the metallicity dependence cancels out.
Hydrogen sulfide (H2S) is the dominant S-bearing gas in substellar atmospheres under most P-T conditions considered here. The absolute H2S abundance is of course metallicity dependent (see 3.1.1). At high temperatures and low pressures, H2S is replaced by SH via the net thermochemical reaction
| (1) |
and SH becomes the dominant sulfur gas. The equilibrium constant expression for reaction (1) is
| (2) |
Rearranging and substituting for the temperature dependence of ( from 800 to 2500 K), the H2S/SH ratio is given by
| (3) |
The H2S/SH ratio is independent of metallicity because the dependence of each S-bearing gas in reaction (1) cancels out and the H2 abundance is essentially constant () over small metallicity variations. The solid line separating the H2S and SH fields in Figure 1 shows where these two gases have equal abundances. With and , equation (3) can be rewritten to give the H2S=SH equal abundance boundary:
| (4) |
which is independent of metallicity. The abundance of each sulfur gas does not drop to zero as this line is crossed; H2S is still present within the SH field and vice versa (see 3.1.2).
With increasing temperatures, SH dissociates and monatomic S becomes the dominant sulfur-bearing gas via
| (5) |
Using from 800 to 2500 K and rearranging, the SH/S abundance ratio is given by
| (6) |
This ratio is also independent of metallicity because the dependence of each S-bearing gas in reaction (5) cancels out. With and , equation (6) is rewritten to give the position of the metallicity-independent SH=S equal abundance line
| (7) |
At the lowest total pressures considered here, monatomic S is the major sulfur gas (see Figure 1). At temperatures below K, H2S directly converts to monatomic S via the net thermochemical reaction
| (8) |
The H2S/S abundance ratio follows from adding equations (3) and (6) as
| (9) |
and is independent of metallicity. Again, with and , the metallicity-independent position of the H2S=S boundary is approximated by
| (10) |
The H2S=SH, SH=S, and H2S=S boundaries intersect at the H2S-SH-S “triple point” at K and bar, indicated by the triangle in Figure 1 and represented by the net thermochemical equilibrium
| (11) |
The P-T position of the triple point is independent of metallicity because the intersecting boundaries in equations (4), (7), and (10) are each independent of metallicity. At the triple point, all three gases have equal abundances A(H2S) = A(SH) = A(S) (where S is the total elemental sulfur abundance) of one third of the total sulfur abundance.
As noted above, the H2 abundance is essentially constant () over the small metallicity range considered here. However, at high and low , H2 thermally dissociates to H via the net thermochemical reaction
| (12) |
The position of the H2=H equal abundance boundary is indicated by the dash-dot line in Figure 1. The abundance of H2 as a function of and in a solar system composition gas can be determined by solving the expression
| (13) |
where the variable is given by
| (14) |
At pressures and temperatures relevant for substellar atmospheres (Figure 1), approaches zero and .
3.1.1 Hydrogen Sulfide, HS gas
As shown in Figure 1, H2S is expected to be the most abundant S-bearing gas throughout the atmospheres of substellar objects (e.g. FL, 94; Fegley & Lodders, 1996). Aside from minor amounts of sulfur () removed by metal sulfide clouds (see 3.2), H2S approximately represents the atmospheric sulfur inventory until it is removed by very low temperature cloud formation and/or photochemical destruction. The H2S abundance also slightly decreases at atmospheric levels below the Mg-silicate clouds where SiS gas is relatively abundant (see 3.1.4 and 3.3). Within the H2S field and at the high temperatures below the metal sulfide clouds, the H2S abundance is given by
| (15) |
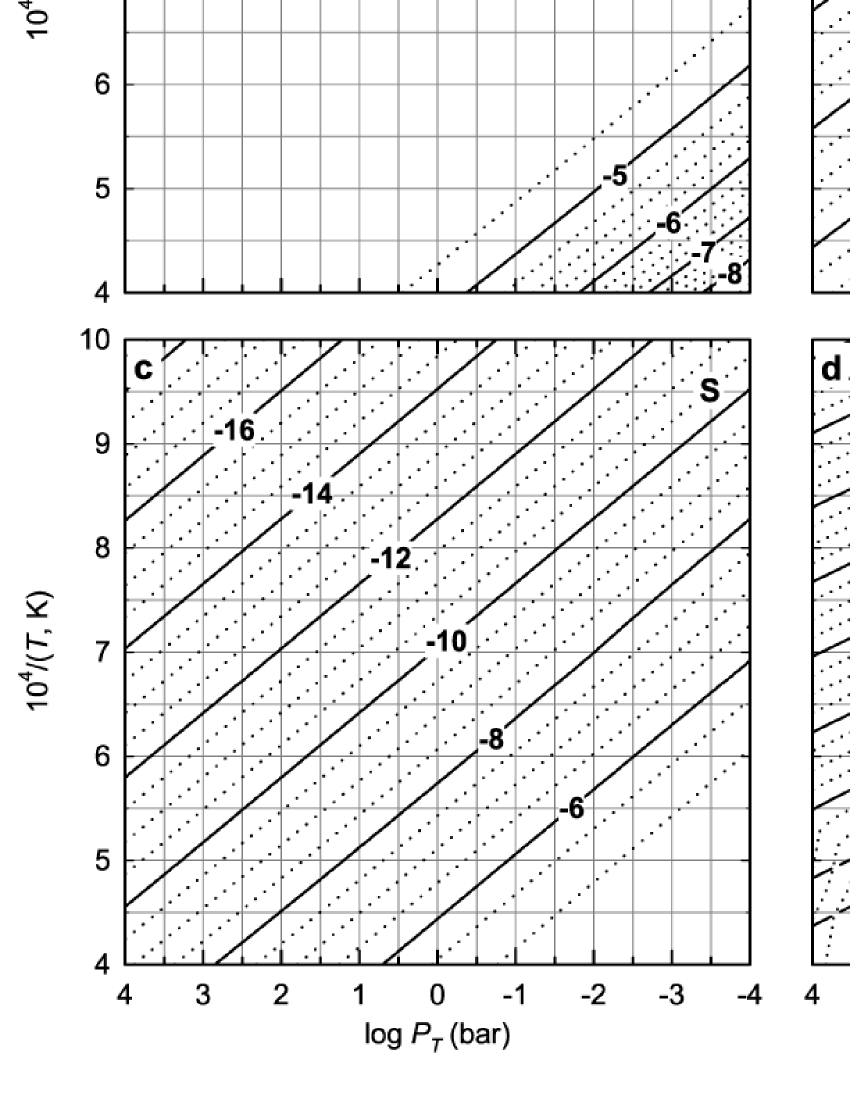
whereas above the metal sulfide clouds, the H2S abundance is
| (16) |
Figure 2a gives mole fraction contours (on a logarithmic scale) of H2S as a function of temperature and total pressure in a solar metallicity gas. The H2S abundance at higher or lower metallicities can be found by substituting for [S/H] in equations (15) and (16). As discussed above, H2S dissociates to SH and S at high temperatures. Inside the SH and S fields, the H2S abundance remains proportional to and decreases when moving toward higher temperatures and lower total pressures.
3.1.2 Mercapto, SH gas
Mole fraction contours of SH as a function of and are shown in Figure 2b. Within the H2S field ( and ), mercapto is governed by reaction (1). The SH abundance is given by substituting equation (15) into equation (3) and rearranging
| (17) |
proportional to and . At high temperatures, SH is replaced by S via reaction (5). Within the S field, the SH abundance is proportional to and decreases when moving away from the SH-S boundary to higher and lower .
3.1.3 Monatomic Sulfur, S gas
Mole fraction contours for monatomic S are shown in Figure 2c. Inside the H2S field, monatomic sulfur gas is governed by reaction (8). The S abundance is given by rearranging equation (9), using from equation (15) and to give
| (18) |
proportional to and . As illustrated in Figure 1, monatomic S is the dominant S-bearing gas () at high and low in a solar composition gas. Thermal ionization of S only becomes important at temperatures higher than those shown in Figure 1, e.g., at 6974 K ( bars), 5340 K ( bars), and 4326 K ( bars).
3.1.4 Silicon Sulfide, SiS gas
The chemistry of SiS in a solar metallicity gas is shown in Figure 2d. Also shown are dashed lines for the condensation curves of forsterite (Mg2SiO4) and enstatite (MgSiO3). Condensation of Mg-silicates efficiently removes Si gases from the atmospheres of gas giant planets and cool brown dwarfs (Fegley & Prinn, 1988; FL, 94). The SiS abundance is controlled by the net thermochemical reaction
| (19) |
The SiS abundance at high temperatures below the Mg-silicate clouds is given by
| (20) |
assuming [O/H] = [S/H] (see 2). Below the clouds, is relatively constant ( 5 ppm at [M/H] = 0) until H2S is replaced by monatomic S at high and low . The SiS abundance also decreases at bar as CO is replaced by CH4 (see Figure 1). This conversion increases the H2O abundance (see LF, 02), and drives reaction (19) toward the left to yield less SiS.
At lower temperatures, above the clouds, the SiO abundance is governed by the reaction
| (21) |
Combined with reaction (19), the abundance of SiS is given by
| (22) |
Although reaction (19) does not indicate a dependence on and suggests a linear dependence on the H2O abundance, the SiS abundance in equation (22) is proportional to and . These dependencies enter through the SiO abundance governed by reaction (21). The H2O abundance above the Mg-silicate clouds is approximated by
| (23) |
where
| (24) |
Substituting from equation (23) into equation (22) shows that is proportional to , assuming [O/H] = [S/H] (see 2). Curvature in the SiS abundance contours results from the dependence of the H2O abundance on the CH4/CO equilibrium (see LF, 02). For reference, in CH4-dominated objects and in CO-dominated objects with solar metallicity in atmospheric regions above the Mg-silicate clouds.
3.2 Sulfur Condensation Chemistry
With decreasing temperatures, sulfur condenses into MnS, Na2S, ZnS, and NH4SH cloud layers. Condensation affects the spectra of substellar objects by removing gases (and thus potential opacity sources) from the observable atmosphere, and by introducing cloud particles (Marley et al., 1996; Lodders, 1999a; Burrows et al., 2000a; Lodders & Fegley, 2006).
The formation of a sulfur-bearing cloud requires that its constituent elements were not removed by condensation into more refractory cloud layers at deeper levels. For example, one might naively expect FeS cloud formation because FeS is a well-known condensate in the equilibrium condensation sequence of the solar nebula gas. However, condensation of FeS is preceded by Fe metal condensation and in the high-gravity environment of substellar objects, iron settles into a deep cloud layer at high temperatures (e.g. Prinn & Olaguer, 1981; FL, 94; Lodders, 1999a; LF, 02; Lodders & Fegley, 2006). Hence no Fe metal is left at lower temperatures when FeS could condense. Note that if FeS condensation did occur, all H2S would be removed because Fe/S . However, the measured H2S abundance of times the protosolar H2S/H2 ratio in Jupiter’s atmosphere (Niemann et al., 1998; Wong et al., 2004) requires Fe metal cloud formation at deep atmospheric levels.
Sulfur thus condenses as other sulfides with metals (Mn, Na, Zn) that are not already removed into high-temperature condensates. The abundances of Mn, Zn, and Na are all lower than that of S and condensation of these sulfides only depletes the atmosphere of of its entire sulfur inventory. Therefore, H2S gas remains in T dwarfs, L dwarfs, and Pegasi planets, and is only depleted in objects with low enough temperatures for NH4SH condensation. Table 1 lists the calculated condensation temperatures of MnS, Na2S, ZnS, and NH4SH for HD209458b and a model L dwarf with [M/H] 0, for Jupiter ([M/H] +0.5), and for Gliese 229B ([M/H] -0.3), assuming uniform enrichments and/or depletions of heavy element abundances.
3.2.1 Alabandite, MnS, condensation
The most refractory S-bearing condensate in substellar atmospheres is MnS (Figure 1). Alabandite clouds form via the net thermochemical reaction
| (25) |
where the condensation temperature is approximated by
| (26) | |||||
assuming [Mn/H] = [S/H] (see 2). Because MnS condenses at sufficiently high temperatures (e.g. K at 1 bar), MnS clouds are expected in most substellar atmospheres. The Mn abundance is 2% that of sulfur and thus MnS cloud formation removes all Mn and 2% of all sulfur from the atmosphere.
3.2.2 Sodium Sulfide, NaS, condensation
The Na2S cloud layer forms via the net thermochemical reaction
| (27) |
The condensation temperature of Na2S as a function of and metallicity is approximated by
| (28) | |||||
assuming [Na/H] = [S/H] (see 2), and is shown in Figure 1 for a solar-metallicity gas. Below the Na2S cloud, monatomic Na is the most abundant Na-bearing gas, followed closely by NaCl. With decreasing temperatures, NaCl becomes increasingly important, but its abundance never exceeds that of monatomic Na below the cloud (Lodders, 1999a). Sodium sulfide condensation effectively removes all sodium and of all sulfur from the atmosphere because the protosolar Na abundance is 13% of the protosolar S abundance.
3.2.3 Sphalerite, ZnS, condensation
Sphalerite clouds form by the net thermochemical reaction
| (29) |
The condensation temperature of ZnS as a function of and metallicity is given by
| (30) | |||||
assuming [Zn/H] = [S/H] (see 2). Sphalerite cloud formation effectively removes all Zn and of H2S from the atmosphere.
3.2.4 Ammonium Hydrogen Sulfide, NHSH, condensation
Sulfur condenses as NH4SH via the net thermochemical reaction
| (31) |
in the cool upper atmospheres of giant planets (Figure 1), where H2S and NH3 are the major S- and N-bearing gases, respectively. The NH4SH condensation temperature as a function of and metallicity is approximated by
| (32) | |||||
assuming [N/H] = [S/H] (see 2). This expression differs slightly from LF (02) due to the revised solar elemental abundances of Lodders (2003). The formation of a NH4SH cloud is expected to efficiently remove all sulfur from the atmosphere because NH3 is times more abundant than H2S in a protosolar composition gas.
3.2.5 Hydrogen Sulfide, HS, condensation
Hydrogen sulfide cloud formation is only possible in cool objects (such as Uranus and Neptune) if NH3 is absent or less abundant than H2S, since ammonia will consume atmospheric sulfur to form NH4SH via reaction (31) (e.g., see Fegley et al., 1991). At sufficiently low temperatures, H2S condensation may occur via the net reaction
| (33) |
The H2S condensation temperature is approximated by
| (34) |
We found that no other S-bearing condensates are stable (OCS, SO2, elemental S) over this P-T range in a protosolar composition gas.
3.3 Sulfur Chemistry in Substellar Objects
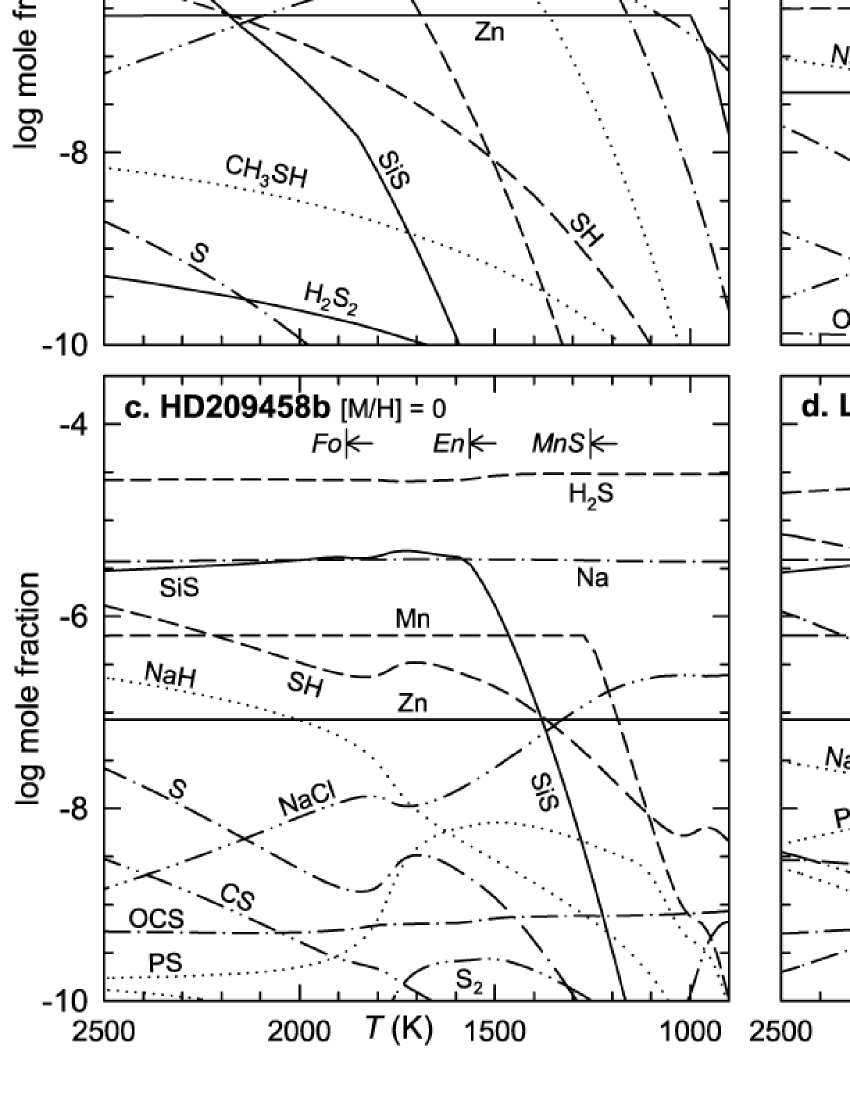
Figures 3a-3d summarize the equilibrium sulfur gas chemistry computed along the P-T profiles of four representative substellar objects: Jupiter ( K), the T dwarf Gliese 229B ( K), the Pegasi planet HD209458b ( K), and an L dwarf ( K) (see 3.1). The profiles for Jupiter and Gliese 229B were computed at and , respectively, assuming uniform enrichments and depletions in elemental abundances. The upper atmosphere of HD209458b is heated by a large incoming stellar flux, which is responsible for the shape of this planet’s P-T profile (Figure 1) and hence the curvature in all gas abundances near 1800 K . Also shown are gases which are strongly affected by S-bearing cloud formation (e.g., Na, NaCl, Mn, Zn). The condensation temperatures of Mg2SiO4 (Fo), MgSiO3 (En), MnS, Na2S, and ZnS are indicated by arrows (see Table 1). The Jupiter profile intersects the forsterite condensation curve at high temperatures outside the range of Figure 3a. The Gliese 229B profile intersects the ZnS condensation curve at 780 K, outside the range of Figure 3b. In contrast, ZnS does not condense in the atmospheres of HD209458b or the L dwarf.
Hydrogen sulfide is the most abundant S-bearing gas throughout the atmospheres of substellar objects (). The H2S abundance slightly increases when silicon in SiS is removed by Mg-silicate cloud formation (e.g., see Figures 3b-3d), and slightly decreases when sulfur is removed by metal sulfide cloud formation (e.g., see Figure 3a).
The Galileo entry probe measured H2S down to the 20 bar level on Jupiter (Niemann et al., 1998; Wong et al., 2004), where the observed H2S abundance of 2.4 times the solar H2S/H2 ratio should represent the total sulfur inventory in Jupiter’s atmosphere (e.g., Barshay & Lewis, 1978; FL, 94; Lodders, 2004b). Ground-based observations have failed to detect H2S on Jupiter and Saturn because of its removal by condensation, its short photochemical lifetime, and the lack of major H2S features in the 5 m window. Observations of Jupiter at 2.7 m by KAO (Larson et al., 1984) and at 8.5 m by Voyager (Bézard et al., 1983) provide only upper limits because these wavelengths probe atmospheric levels where H2S is depleted by NH4SH condensation. The HST detection of H2S in the Shoemaker-Levy 9 impact region suggested excavation of Jovian atmosphere from regions below the NH4SH cloud where H2S is more abundant (Noll et al., 1995; Zahnle et al., 1995).
Based on tropospheric NH3 and H2S abundances, NH4SH cloud formation is expected to occur near the 220 K, 2.4 bar level on Jupiter (cf. FL, 94). This should efficiently remove H2S from the gas because NH3/H2S in Jupiter’s atmosphere (Wong et al., 2004). The inferred NH4SH cloud layer detected by the Galileo entry probe nephelometer was thin and tenuous, presumably due to the probe’s entry in a relatively clear 5 m hot spot (West et al., 2004).
In contrast, NH4SH cloud formation is not expected in the warmer atmospheres of brown dwarfs or Pegasi planets because their P-T profiles do not intersect the NH4SH condensation curve (see Figure 1), and H2S gas remains. Measurements of H2S in these objects should therefore approximately represent their bulk atmospheric sulfur inventory (e.g. Fegley & Lodders, 1996). Saumon et al. (2000) investigated the observability of H2S and found that a H2S feature at 2.1 m is potentially detectable in the infrared spectrum of Gliese 229B. In the uppermost atmospheres of brown dwarfs and Pegasi planets, H2S is plausibly destroyed by photochemistry (see 5), as is expected for Jupiter (e.g., Prinn & Owen, 1976).
Over the P-T range considered here, the next most abundant S-bearing gases after H2S are SH (at low temperatures) or SiS (at high temperatures). The mercapto radical is generally the second or third most abundant sulfur gas throughout substellar atmospheres. Yamamura et al. (2000) identified SH at m in the published infrared spectrum of R Andromedae, a S-type star. Their inferred SH/H ratio of is consistent with thermochemical equilibrium (Tsuji, 1973, and Figure 2b). Berdyugina & Livingston (2002) identified SH at Å in the Sun’s photosphere. They do not give column densities, but computed synthetic spectra at 5250 and 4750 K. We calculated SH mole fractions of (5250 K) and (4750 K) using the solar model atmosphere of Edvardsson et al. (1993). Using the effective temperatures for reference, we also compute SH column densities of (960 K), (1350 K), and cm-2 (1800 K) on Gliese 229B, HD209458b, and the L dwarf, respectively, versus the SH column density of cm-2 in R Andromedae (Yamamura et al., 2000). The equilibrium SH abundances expected for brown dwarfs and Pegasi planets may be too low for reliable quantitative analysis.
The relative importance of SiS increases with increasing temperature, and peak SiS abundances of 6 ppm at [M/H] = 0 and 60 ppm at [M/H] = +0.5 are achieved at P-T conditions close to the condensation temperatures of the Mg-silicate clouds. With their condensation, silicon is removed from the atmosphere and the abundance of SiS and other Si-bearing gases drop. This makes SiS a potential tracer of weather in Pegasi planets and L dwarfs, analogous to FeH in T dwarfs (Burgasser et al., 2002), and gaps in the Mg-silicate cloud layers may expose regions where SiS is relatively abundant. In cooler objects, the SiS fundamental absorption band near 13.3 m may be difficult to distinguish from ammonia features as NH3 replaces N2 to become the dominant N-bearing gas; the first SiS overtone at 6.6 m has been observed in the carbon giant WZ Cas (Aoki et al., 1998), though this feature will likely be overwhelmed by H2O absorption in substellar atmospheres.
The increasing importance of NaCl instead of Na and the removal of Na by Na2S cloud formation is a plausible cause of the observed weakening of Na atomic lines throughout the L dwarf spectral sequence and their disappearance in early T dwarfs (e.g. Kirkpatrick et al., 1999; McLean et al., 2003); this is further enhanced by pressure broadening of the Na I doublet (e.g. Tsuji et al., 1996; Burrows et al., 2000b; Liebert et al., 2000). Sodium sulfide is expected to condense at the K level in Jupiter’s atmosphere and the K level in Gliese 229B (see Table 1). The L dwarf and the Pegasi planet HD209458b are too warm for Na2S condensation (assuming [M/H] 0; see Figure 1) and Na remains in the gas. This is consistent with the detection of Na in the atmosphere of HD209458b (Charbonneau et al., 2002), though the chemistry results of Lodders (1999a) suggest that limited Na2S cloud formation may occur on this planet if night-side temperatures are low enough (e.g., Fortney et al., 2003, 2005; Iro et al., 2005; Barman et al., 2005), or if its metallicity is sufficiently enhanced. However, while Na chemistry is strongly affected by Na2S condensation, S chemistry remains almost unchanged because Na2S cloud formation only removes 6% of all sulfur (see 3.2.2).
The formation of the MnS cloud layer effectively removes Mn from the atmospheres of substellar objects. Similarly, ZnS condensation removes Zn from the atmosphere of Jupiter ([M/H] +0.5) and Gliese 229B ([M/H] -0.3) above the 980 K and 780 K levels, respectively. In contrast, the atmospheres of L dwarfs and Pegasi planets are too warm for ZnS condensation and Zn will remain in the gas.
4 Phosphorus Chemistry
4.1 Phosphorus Gas Chemistry
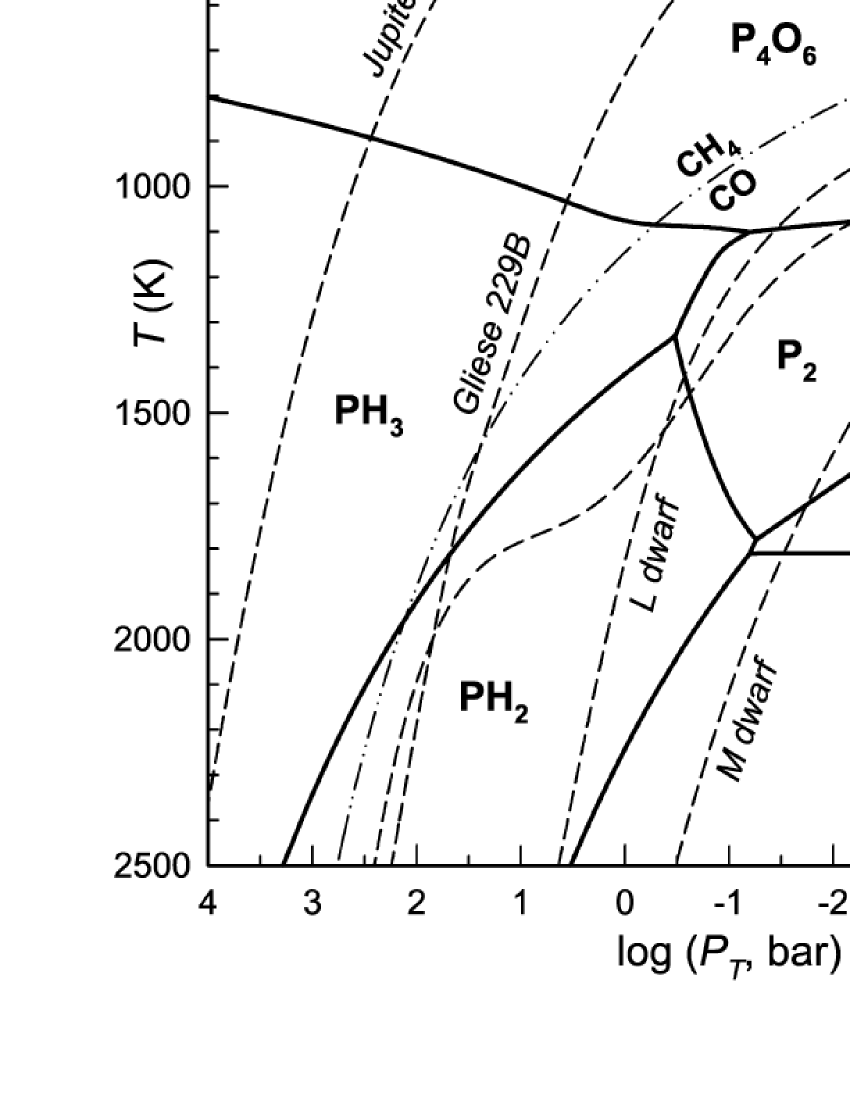
The phosphorus equilibrium gas chemistry as a function of temperature and total pressure in a protosolar composition gas is illustrated in Figure 4. The P-T regions indicating the most abundant phosphorus bearing gas are bounded by solid lines. Also shown is the condensation curve for NH4H2PO4 (dotted line), model atmosphere profiles for representative substellar objects (dashed lines; see 3.1), and the H2=H and CH4=CO equal abundance curves (dash-dot lines). Phosphorus chemistry is considerably more complex than that for C, N, O, and S, and several P-bearing species become abundant at elevated temperatures (Barshay & Lewis, 1978; Fegley & Lewis, 1980; FL, 94).
Under equilibrium conditions, P4O6 is the dominant phosphorus gas at low temperatures, and is replaced by PH3 or P2 as temperatures increase. The conversion of P4O6 to PH3 occurs by net thermochemical reaction:
| (35) |
In CH4-dominated objects, the PH3=P4O6 equal abundance boundary is approximated by
| (36) | |||||
assuming [O/H] [P/H] (see 2). The net reaction of P4O6 to P2 occurs at lower in CO-dominated objects:
| (37) |
and the position of the P2=P4O6 equal abundance boundary is approximated by
| (38) | |||||
assuming [O/H] [P/H] (see 2). The relative importance of reactions (35) and (37) depends on the position of an object’s P-T profile relative to the PH3-P4O6-P2 triple point at K and bar, where all three gases have equal abundances [A(PH3) = A(P4O6) = A(P2) P]. The positions of all the triple points shown in Figure 4 are listed in Table 2.
In L dwarf atmospheres, PH3 and P2 have similar abundances and are converted into each other by the net thermochemical reaction
| (39) |
The PH3=P2 equal abundance boundary in a solar metallicity gas is approximated by
| (40) |
from 1101 to 1330 K, and shifts to higher and lower with increasing metallicity. At deeper atmospheric levels, PH2 becomes the most abundant phosphorus gas. In T dwarfs and cool L dwarfs PH2 replaces PH3 via
| (41) |
The PH3=PH2 boundary is given by
| (42) |
and is independent of metallicity because the dependence for each P-bearing gas in reaction (41) cancels and the H2 abundance is essentially constant over small metallicity variations.
In Pegasi planets and hot L dwarfs, PH2 replaces P2 via
| (43) |
The position of the P2=PH2 boundary in a solar metallicity gas is approximated by
| (44) |
from 1330 to 1780 K, and shifts to higher and with increasing metallicity. The PH3=P2, PH3=PH2, and P2=PH2 boundaries intersect at K and bar, where all three gases have equal abundances [A(PH3) = A(PH2) = A(P2) P].
At even higher temperatures, PH2 thermally dissociates via
| (45) |
and monatomic P becomes the major P-bearing gas. The position of the PH2=P boundary given by
| (46) |
is independent of metallicity because the dependence for each P-bearing gas cancels out in reaction (45). As for sulfur, thermal ionization of P only becomes important at temperatures higher than those shown in Figure 4, e.g., at 6088 K ( bars), 4836 K ( bars), and 4054 K ( bars).
4.1.1 Tetraphosphorus Hexaoxide, PO gas
The equilibrium abundances of P4O6 as a function of and for solar metallicity are illustrated in Figure 5a. At high temperatures ( K), the P4O6 abundances depend on which P-bearing gas is dominant. For example, within the PH3 field, the P4O6 abundance is controlled by reaction (35) and is proportional to and , assuming [O/H] [P/H] (see 2). Inside the P2 field, the P4O6 abundance is controlled by reaction (37) and is proportional to and , assuming [O/H] [P/H] (see 2). In both cases, the P4O6 abundance rapidly decreases with temperature and is strongly dependent on metallicity.
At low temperatures ( K), P4O6 is the dominant P-bearing gas at equilibrium (Figure 4), and its abundance is proportional to , assuming [O/H] [P/H] (see 2). The maximum P4O6 abundance is because each molecule of P4O6 contains four phosphorus atoms. However, completely insignificant amounts of P4O6 are expected in the upper atmospheres of giant planets and T dwarfs because the PH3 to P4O6 conversion is kinetically inhibited inside the PH3 stability field where essentially no P4O6 exists (see 4.3).
4.1.2 Phosphine, PH gas
Chemical equilibrium abundances of PH3 are shown in Figure 5b as a function of and . At high temperatures ( K), PH3 abundances generally increase with but decrease with when other P-bearing gases are dominant. For example, within the P2 field the PH3 abundance is governed by reaction (39) and is approximated by
| (47) |
proportional to and . At higher total pressures, PH3 is the dominant P-bearing gas (see Figure 4), and its abundance is proportional to . The maximum PH3 abundance is . Phosphine therefore approximately represents the total phosphorus inventory in the deep atmospheres of giant planets and T dwarfs. Furthermore, rapid vertical mixing and phosphine quenching from deep atmospheric regions where PH3 dominates is expected to give disequilibrium abundances of in the observable atmospheres of giant planets and T dwarfs (see 4.3).
4.1.3 Diatomic Phosphorus, P gas
Mole fraction contours for P2 are given in Figure 5c as a function of and . In cooler objects (e.g., giant planets and T dwarfs), P2 is governed by reaction (39), and the mole fraction abundance of P2 within the PH3 field is
| (48) |
proportional to and . At lower total pressures ( bar), P2 is the dominant P-bearing gas (see Figure 4), and its abundance is proportional to . The maximum P2 abundance is because each molecule of P2 contains two phosphorus atoms. With increasing temperatures, P2 is replaced by PH2 via reaction (43) in the atmospheres of L dwarfs and Pegasi planets.
4.1.4 Phosphino, PH gas
Figure 5d illustrates the abundances of the PH2 radical, which is the most abundant P-bearing gas in the deep atmospheres of brown dwarfs and Pegasi planets. At lower temperatures, the PH2 abundance within the PH3 field is governed by reaction (41) and is given by
| (49) |
proportional to and . When P2 is the dominant phosphorus gas, the PH2 abundance is governed by reaction (43) and is given by
| (50) |
proportional to and . Equations (49) and (50) show that the PH2 abundances decrease with when PH3 dominates, and increase with when P2 dominates. This explains the curvature of the PH2 mole fraction contours in Figure 5d.
4.2 Phosphorus Condensation Chemistry
At low temperatures (Figure 4), equilibrium condensation of NH4H2PO4 is expected to occur via the net thermochemical reaction
| (51) |
The condensation temperature of NH4H2PO4 as a function of and metallicity is approximated by
| (52) |
assuming [O/H] = [N/H] = [P/H] (see 2). If equilibrium were attained (which is not the case for the giant planets in our Solar System), NH4H2PO4 condensation would efficiently remove phosphorus from the upper atmospheres of giant planets and the coolest T dwarfs because oxygen and nitrogen abundances are typically much larger than that of phosphorus. We found that neither P4O10 nor elemental P condense under equilibrium conditions over this P-T range from a solar system composition gas.
4.3 Phosphorus Chemistry in Substellar Objects
Figures 6a-6d illustrate equilibrium phosphorus gas chemistry along model atmosphere profiles Jupiter, Gliese 229B, HD209458b, and the L dwarf as done for sulfur in Figure 3. As before, the shape of the P-T profile of HD209458b (Figure 4) is responsible for the curvature in the phosphorus abundances near 1800 K.
Using the effective temperatures for reference, the major P-bearing gases expected from thermochemical equilibrium in the observable atmospheres are: P4O6 in giant planets and cool T dwarfs ( K), PH3 in hot T dwarfs and cool L dwarfs ( K), PH2 in hot L dwarfs ( K), P2 in Pegasi planets such as HD209458b ( K), and monatomic P in cool M dwarfs (e.g., K). The dominant P-bearing gas changes with increasing temperature, and the major phosphorus gases at depth are: PH2 in Pegasi planets, PH2 and P in L dwarfs, PH3 and PH2 in T dwarfs, and PH3 in giant planets (Figure 4).
However, thermochemical equilibrium does not apply to phosphorus chemistry in the upper atmospheres of giant planets and T dwarfs because the conversion from PH3 to P4O6 is kinetically inhibited (Prinn & Owen, 1976; Barshay & Lewis, 1978; Prinn et al., 1984; FL, 94), and timescales for the PH3 to P4O6 conversion () are larger than typical convective mixing timescales () in these atmospheres (Fegley & Prinn, 1985; FL, 94; Fegley & Lodders, 1996). The chemical lifetime of PH3 as a function of and for solar metallicity is given in Figure 7, using PH3 destruction kinetics described by Visscher & Fegley (2005). The quench temperature (where = ) for PH3 destruction is expected to be inside the PH3 field in the deep atmospheres of giant planets and T dwarfs. As a result, virtually no P4O6 forms and PH3 is mixed upward into their observable atmospheres at abundances approximately representative of the total atmospheric phosphorus inventory (). We therefore expect PH3 (instead of P4O6) to be the major P-bearing gas in giant planets and T dwarfs.
Indeed, spectroscopic observations of PH3 in the upper atmospheres of Jupiter and Saturn indicate tropospheric phosphine abundances of 1.1 ppm by volume on Jupiter (e.g., Lodders, 2004b, and references therein) and 4.5 ppm by volume on Saturn (e.g., Visscher & Fegley, 2005, and references therein). These measured PH3 abundances are 30 orders of magnitude higher than expected from thermodynamic equilibrium and imply rapid vertical mixing from deeper atmospheric levels where phosphine is more abundant. We expect PH3 abundances of ppm (for solar metallicity) in the upper atmospheres of Jupiter-type giant planets and cool T dwarfs such as Gliese 229B (e.g., Fegley & Lodders, 1996), and measurements of phosphine in these objects should approximately represent their bulk atmospheric phosphorus inventory. Noll & Marley (1997) discussed the observability of gases affected by vertical mixing and concluded that the 4.3 m feature of PH3 is potentially detectable in the infrared spectra of T dwarfs. Photochemistry may plausibly destroy PH3 in the uppermost atmospheres of these objects (see 5), as occurs on Jupiter and Saturn.
In hotter objects, PH3 may no longer represent the total atmospheric phosphorus inventory when P equilibrium chemistry is established and other abundant P-bearing gases are present. Phosphine abundances of ppb (for solar metallicity) remain at the 1350 K level on HD209458b and 1800 K in the model L dwarf. The PH3 feature at 4.3 m is potentially detectable in these objects if it can be distinguished from nearby CO bands (Noll & Marley, 1997; Saumon et al., 2003).
The abundant P-bearing gases at higher atmospheric temperatures include P2, PH, PH2, PH3, and HCP (Figures 6a-6d). The phosphino radical (PH2) is the dominant P-bearing gas in the observable atmosphere of the model L dwarf and in the deep atmospheres of T dwarfs and Pegasi planets. However, PH2 only represents about half of the total atmospheric phosphorus inventory because other P-bearing gases remain relatively abundant within the PH2 field. Equilibrium PH2 abundances of ppb, ppb, and ppb are expected (for solar metallicity) in the observable atmospheres of T dwarfs, Pegasi planets, and L dwarfs, respectively.
As temperatures decrease, PH2 is replaced by PH3 (in Gliese 229B, Figure 6b) and/or P2 (in HD209458b and the L dwarf, Figures 6c-6d) as the major P-bearing gas, depending on the position of the atmospheric P-T profile relative to the PH3-PH2-P2 triple point (see Figure 4 and 4.1). Although P2 is expected to be the dominant P-bearing gas in the observable atmospheres of Pegasi planets ( ppm at 1350 K) and the upper atmospheres of L dwarfs, the P2 bands expected near 0.2 m (Carroll & Mitchell, 1975) may be very difficult to detect in these objects. At temperatures below K, P2 is converted into P4O6, which is plausibly destroyed by photochemical processes in the uppermost atmospheres of L dwarfs and Pegasi planets (see 5).
The abundances of PH and HCP are negligible in the observable atmospheres of giant planets and T dwarfs. In warmer objects, these gases have equilibrium abundances (at solar metallicity) of ppb (PH) and ppb (HCP) on HD209458b (at 1350 K), and ppb (PH) and ppb (HCP) in the L dwarf model atmosphere (at 1800 K).
Under equilibrium conditions, NH4H2PO4 cloud formation would be expected near the 400 K level in the upper atmosphere of Jupiter (cf. Barshay & Lewis, 1978; FL, 94), but is precluded by quenching of PH3 (see above). Condensation of NH4H2PO4 is not expected in the warmer atmospheres of Gliese 229B, HD209458b, and the L dwarf because their P-T profiles do not intersect the NH4H2PO4 condensation curve (Figure 4).
5 Thermochemistry and Photochemistry
So far, our treatment of sulfur and phosphorus chemistry assumes the establishment of thermochemical equilibrium. The exception is phosphine, for which the kinetics of its destruction mechanism and convective vertical mixing must be considered for determining PH3 abundances (4.3). However, we must also consider photochemical reactions in the uppermost atmospheres of planets and brown dwarfs that are companions to stars. If ultraviolet flux causes photochemical reactions, the thermochemical reactions will be driven out of equilibrium. Photochemistry may also play a role in isolated brown dwarfs if their coronae are warm enough to produce an ultraviolet flux (Yelle, 1999).
For example, in Jupiter’s troposphere the major C-, N-, S- and O-bearing gases expected from thermochemical equilibrium are CH4, NH3, H2S, and H2O, respectively (FL, 94). However, Jupiter’s stratosphere contains photochemically produced hydrocarbons such as C2H6, C2H2, and C2H4 (Gladstone et al., 1996). Hence we must examine the relative roles of thermochemistry and photochemistry on S and P compounds in brown dwarfs, EGPs, and related objects.
5.1 Thermochemistry in Substellar Objects
Thermochemical equilibrium is readily achieved in the hot, deep atmospheres of substellar objects because gas phase reaction rates are generally much faster than convective mixing rates (i.e., ). To illustrate this, we consider the kinetics of the following elementary reactions:
| (53) | |||||
| (54) | |||||
| (55) | |||||
| (56) | |||||
| (57) | |||||
| (58) |
Here we use reaction (53) as an example for computing . The rate of disappearance of H2S in reaction (53) is given by
| (59) |
where (cm3 molecules-1 s-1) is the rate coefficient for reaction (53) and [H2S] and [H] are the molecular number densities (molecules cm-3) for H2S and H. The chemical lifetime for H2S is defined as
| (60) |
and is the time required for a 1/ reduction in the H2S abundance. Representative chemical lifetimes for reactions (53)-(58) at 1 bar total pressure and 1000, 1500, and 2000 K are listed in Table 1. Although the short chemical lifetimes in Table 1 indicate that these reactions proceed rapidly, we must also consider vertical mixing rates to determine if equilibrium is established. The timescale for convective mixing, is approximated by
| (61) |
where is the eddy diffusion coefficient. The pressure scale height, , is given by
| (62) |
where is the gas constant, is the mean molecular weight of the gas, and is gravity. For a solar system composition gas, g mol-1. A convective timescale of seconds is expected near the 1000 K level on Jupiter, using km () and cm2 s-1 (Fegley & Prinn, 1988). On Gliese 229B, we estimate seconds at the 1000 K level, assuming km (; Saumon et al., 2000) and cm2 s-1 (Griffith & Yelle, 1999). Because of its low gravity (; Iro et al., 2005) HD209458b has large mixing times of to seconds at the 1000 K level, depending on the assumed value ( to cm2 s-1). These timescales for convective mixing are typically many orders of magnitude greater than the chemical lifetimes listed in Table 3 (i.e., ). We therefore expect the rapid establishment of thermochemical equilibrium in the deep atmospheres of substellar objects. In instances where the rate of vertical mixing equals or exceeds the rate of chemical reactions (), disequilibrium species (e.g., PH3, see 4.3) are mixed into the upper atmospheres of substellar objects, as occurs on Jupiter and Saturn (e.g., CO, HCN, PH3, GeH4, AsH3; FL, 94) and Gliese 229B (e.g. CO, PH3, N2; Fegley & Lodders, 1996; Griffith & Yelle, 1999; Saumon et al., 2000).
5.2 Photochemistry on Pegasi Planets
In order to examine the relative importance of photochemical vs. thermochemical processes in substellar objects, we consider an extreme example: the strongly irradiated upper atmosphere of HD209458b. This Pegasi planet orbits a solar-type star at 0.05 AU and receives a stellar UV flux 10,000 times that for Jupiter (e.g., Liang et al., 2003). To determine the depth in the atmosphere where thermochemical processes become important, we compared the thermochemical equilibrium abundances of the reactive species OH, O, and H in our model with photochemical equilibrium abundances from Liang et al. (2003) for HD209458b. Plots comparing photochemical (dotted lines) and thermochemical (solid lines) abundances for these reactive species are shown in Figure 8, using the P-T profile for HD209458b from Figure 1 of Liang et al. (2003).
At very low pressures, in the uppermost atmosphere of HD209458b, photochemistry produces excess disequilibrium abundances of OH, O, and H, primarily via H2O photolysis (Liang et al., 2003). Thermochemistry becomes increasingly important with depth, as pressures and temperatures increase and the available stellar flux decreases. Eventually, the predicted thermochemical abundances surpass the photochemical abundances, indicating the establishment of equilibrium chemistry. In other words, the photochemical reactions are no longer driving the thermochemical reactions out of equilibrium. As shown in Figure 8, this crossover occurs near the to 10 mbar levels ( to 1140 K) for the reactive species OH, O, and H. Thermochemical processes are therefore expected to be important at pressures of mbar and higher on HD209458b, consistent with results showing that most of the incoming stellar flux is absorbed by the 1 bar level ( K) in its atmosphere (Iro et al., 2005). Furthermore, Fortney et al. (2005, 2006) point out that the infrared spectra of Pegasi planets appear to be most sensitive to opacity near 10 to 100 mbar ( to 1400 K). This suggests that thermochemical models will provide a useful basis for interpreting and guiding observations of Pegasi planet atmospheres.
6 Summary
Thermochemistry governs the chemical behavior of sulfur and phosphorus species in the hot, deep atmospheres of substellar objects. Hydrogen sulfide is the most abundant sulfur-bearing gas throughout substellar atmospheres, and observations of H2S in these objects should provide a good estimate of their atmospheric sulfur content. The condensation of metal sulfide clouds slightly lowers the atmospheric H2S abundance to of the total S inventory. These clouds also affect opacity by introducing condensed particles and by removing absorbing gases from the observable atmosphere. Mercapto (SH) and SiS are the next most abundant sulfur gases after H2S, and the relative importance of SiS increases with increasing effective temperature. Furthermore, the maximum SiS abundance occurs near the Mg-silicate cloud base and is a potential tracer of weather in Pegasi planets and L dwarfs.
Phosphorus speciation is considerably more complex than that for C, N, O, or S, and several phosphorus gases become relatively abundant at high temperatures. Disequilibrium abundances of PH3 are expected in the upper atmospheres of giant planets and T dwarfs via rapid vertical mixing from deeper levels. In addition, phosphine abundances in giant planets and T dwarfs are expected to approximately represent their atmospheric phosphorus inventories. In Pegasi planets and L dwarfs, P2 is the dominant phosphorus gas until replaced by P4O6 at low temperatures or PH2 at high temperatures. Phosphino (PH2) is the most abundant phosphorus gas in the deep atmospheres of brown dwarfs and Pegasi planets.
Appendix A Additional Compounds
Here we list additional sulfur and phosphorus compounds investigated but not discussed in detail above. This list includes unstable condensates and minor gases predicted to have very low abundances in a solar system composition gas at temperatures and total pressures relevant for substellar atmospheres. Depending on the prevailing sulfur, carbon, and phosphorus chemistry, the abundances of key gases are independent: H2S2 within the H2S field; OCS, CS, and CS2 within the CO field; CH3SH within the CH4 field; HPO, PH, and PN within the P2 field. However, their abundances are generally too low to serve as useful temperature probes in brown dwarf or EGP atmospheres. Some gases (H2S2, CH3SH) are potentially detectable via deep atmospheric entry probes on Jupiter and Saturn (FL, 94).
For a given metallicity, relatively constant OCS abundances are expected throughout the atmospheres of CO-dominated objects; however, maximum OCS abundances are only ppb (for solar metallicity) in L dwarfs and Pegasi planets. The equilibrium abundances of P, PO, and PS generally increase with and decrease with . These gases only become important at lowest total pressures considered here (see Figure 4). The behavior of HCP is similar to that of PH2; maximum HCP abundances are ppb (for solar metallicity) over the P-T range considered here.
Sulfur
S3, S4, S2O, SO, SO2, SO3, SOH, HSO, H2SO, H2SO4, SF, SF2, H2S2, OCS, CS, CS2, CH3SH, NS, PS, K2S, CaS, FeS, MgS, MnS, TiS, VS, ZrS, SiS2, TiS2, ZrS2, S(s,l), OCS(s,l), SO2(s,l)
Phosphorus
P3, P4, PO, PO2, P2O3, P2O4, P2O5, P3O6, P4O7, P4O8, P4O9, P4O10, PCl, PCl2, PCl3, PF, PF2, PF3, HPO, HCP, CP, PH, PN, PS, P(s), P4O10(s,l)
References
- Aoki et al. (1998) Aoki, W., Tsuji, T., & Ohnaka, K. 1998, A&A, 340, 222
- Arthur & Cooper (1997) Arthur, N. L., & Cooper, I. A. 1997, J. Chem. Soc. Faraday Trans., 93, 521
- Barman et al. (2005) Barman, T. S., Hauschildt, P. H., & Allard, F. 2005, ApJ, 632, 1132
- Barshay & Lewis (1978) Barshay, S. S., & Lewis, J. S. 1978, Icarus, 33, 593
- Baulch et al. (1992) Baulch, D. L., et al. 1992, J. Phys. Chem Ref. Data, 21, 411
- Berdyugina & Livingston (2002) Berdyugina, S. V., & Livingston, W. C. 2002, A&A, 387, L6
- Bézard et al. (1983) Bézard, B., Marten, A., Baluteau, J. P., Gautier, D., Flaud, J. M., & Camy-Peyret, C. 1983, Icarus, 55, 259
- Burgasser et al. (2002) Burgasser, A. J., Marley, M. S., Ackerman, A. S., Saumon, D., Lodders, K., Dahn, C. C., Harris, H. C., & Kirkpatrick, J. D. 2002, ApJ, 571, L151
- Burrows et al. (2000a) Burrows, A., Hubbard, W. B., Lunine, J. I., Marley, M. S. & Saumon, D. 2000, in Protostars and Planets IV, ed. V. Mannings, A. P. Boss, & S. S. Russell (Tuscon: Univ. of Arizona Press), 1339
- Burrows et al. (2000b) Burrows, A., Marley, M. S., & Sharp, C. M. 2000, ApJ, 531, 438
- Burrows et al. (2006) Burrows, A., Sudarsky, D., & Hubeny I. 2006, ApJ, 640, 1063
- Carroll & Mitchell (1975) Carroll, P. K., & Mitchell, P. I. 1975, Proc. Roy. Soc. Lon. A, 342, 93
- Charbonneau et al. (2002) Charbonneau, D., Brown, T. M., Noyes, R. W., & Gilliland, R. L. 2002, ApJ, 568, 377
- Chase (1999) Chase, M. W. 1999, J. Phys. Chem. Ref. Data, 28, monograph no. 9
- Chen et al. (2000) Chen, Y. Q., Nissen, P. E., Zhao, G., Zhang, H. W., & Benoni, T. 2000, A&AS, 141, 491
- Edvardsson et al. (1993) Edvardsson, B., Andersen, J., Gustafsson, B., Lambert, D. L., Nissen, P. E., & Tomkin, J. 1993, A&A, 275, 101
- Ecuvillon et al. (2004) Ecuvillon, A., Israelian, G., Santos, N. C., Mayor, M., Villar, V., & Bihain, G. 2004, A&A, 426, 619
- Fegley et al. (1991) Fegley, B. Jr., Gautier, D., Owen, T., & Prinn, R. G. 1991, in Uranus, ed. J. T. Bergstralh, E. D. Miner, & M. S. Matthews (Tuscon: Univ. of Arizona Press), 147
- Fegley & Lewis (1979) Fegley, B., Jr., & Lewis, J. S. 1979, Icarus, 38, 166
- Fegley & Lewis (1980) Fegley, B., Jr., & Lewis, J. S. 1980, Icarus, 41, 439
- FL (94) Fegley, B., Jr., & Lodders, K. 1994, Icarus, 110, 117; FL94
- Fegley & Lodders (1996) Fegley, B., Jr., & Lodders, K. 1996, ApJ, 472, L37
- Fegley & Prinn (1985) Fegley, B., Jr., & Prinn, R. G. 1985, ApJ, 299, 1067
- Fegley & Prinn (1988) Fegley, B., Jr., & Prinn, R. G. 1988, ApJ, 324, 621
- Fortney et al. (2003) Fortney, J. J., Sudarsky, D., Hubeny, I., Cooper, C. S., Hubbard, W. B., Burrows, A., & Lunine, J. I. 2003, ApJ, 589, 615
- Fortney et al. (2005) Fortney, J. J., Marley, M. S., Lodders, K., Saumon, D. & Freedman, R. 2005, ApJ, 627, L69
- Fortney et al. (2006) Fortney, J. J., Saumon, D., Marley, M. S., Lodders, K., & Freedman, R. S. 2006, ApJ, 642, 495
- Gladstone et al. (1996) Gladstone, G. R., Allen, M., & Yung, Y. L. 1996, Icarus, 119, 1
- Griffith & Yelle (1999) Griffith, C. A., & Yelle, R. V. 1999, ApJ, 519, L85
- Gurvich et al. (1989-1994) Gurvich, L. V., Veyts, I. V., & Alcock, C. B. 1989-1994, Thermodynamic Properties of Individual Substances, 4th ed., 3 vols. (New York: Hemisphere Publishing)
- Gustafsson et al. (1999) Gustafsson, B., Karlsson, T., Olsson, E., Edvardsson, B., & Ryde, N. 1999, A&A, 342, 426
- Huang et al. (2005) Huang, C., Zhao, G., Zhang, H. W., & Chen, Y. Q. 2005, MNRAS, 363, 71
- Husain & Marshall (1986) Husain, D., & Marshall, P. 1986, Int. J. Chem. Kin., 18, 83
- Iro et al. (2005) Iro, N., Bézard, B., & Guillot, T. 2005, A&A, 436, 719
- Kirkpatrick et al. (1999) Kirkpatrick, J. D., et al. 1999, ApJ, 519, 802
- Kurbanov & Mamedov (1995) Kurbanov, M. A., & Mamedov, Kh. F. 1995, Kinet. Catal. 36, 455
- Larson et al. (1984) Larson, H. P., Bjoraker, G. L., Davis, D. S., & Hofmann, R. 1984, Icarus, 60, 621
- Liang et al. (2003) Liang, M. C., Parkinson, C. D., Lee, A. Y. T., Yung, Y. L., & Seager, S. 2003, ApJ, 596, L247
- Liebert et al. (2000) Liebert, J., Reid, I. N., Burrows, A., Burgasser, A. J., Kirkpatrick, J. D., & Gizis, J. E. 2000, ApJ, 533, L155
- Lewis (1969a) Lewis, J. S. 1969, Icarus, 10, 393
- Lewis (1969b) Lewis, J. S. 1969, Icarus, 10, 365
- Lodders (1999a) Lodders, K. 1999a, ApJ, 519, 793
- Lodders (1999b) Lodders, K. 1999b, J. Phys. Chem. Ref. Data, 28, 1705
- Lodders (2002) Lodders, K. 2002, ApJ, 577, 974
- LF (02) Lodders, K., & Fegley, B., Jr. 2002, Icarus, 155, 393; LF02
- Lodders (2003) Lodders, K. 2003, ApJ, 591, 1220
- Lodders (2004a) Lodders, K. 2004a, J. Phys. Chem Ref. Data, 33, 357
- Lodders (2004b) Lodders, K. 2004b, ApJ, 611, 587
- Lodders & Fegley (2006) Lodders, K., & Fegley, B., Jr. 2006, in Astrophysics Update 2, ed. J. W. Mason (Springer-Praxis)
- Marley et al. (1996) Marley, M. S., Saumon, D., Guillot, T., Freedman, R. S., Hubbard, W. B., Burrows, A., & Lunine, J. I. 1996, Science, 272, 191
- McLean et al. (2003) McLean, I. S., McGovern, M. R., Burgasser, A. J., Kirkpatrick, J. D., Prato, L., & Kim, S. S. 2003, ApJ, 596, 561
- Niemann et al. (1998) Niemann H. B., et al. 1998, J. Geophys. Res., 103, 22831
- Noll et al. (1995) Noll, K. S., et al. 1995, Science, 267, 1307
- Noll & Marley (1997) Noll, K. S., & Marley, M. S. 1997, ASP Conf. Ser. 119: Planets Beyond the Solar System and the Next Generation of Space Missions, 119, 115
- Prinn & Owen (1976) Prinn, R. G., & Owen, T. 1976, in Jupiter, ed. T. Gehrels (Tuscon: Univ. of Arizona Press), 319
- Prinn & Olaguer (1981) Prinn, R. G., & Olaguer, E. P. 1981, J. Geophys. Res., 86, 9895
- Prinn et al. (1984) Prinn, R. G., Larson, H. P., Caldwell, J. J., & Gautier, D. 1984, in Saturn, ed. T. Gehrels & M. S. Matthews (Tuscon: Univ. of Arizona Press), 88
- Robie & Hemingway (1995) Robie, R. A., & Hemingway, B. S. 1995, US Geological Survey Bull. 2131
- Samland (1998) Samland, M. 1998, ApJ, 496, 155
- Saumon et al. (2000) Saumon, D., Geballe, T. R., Leggett, S. K., Marley, M. S., Freedman, R. S., Lodders, K., Fegley, B., Jr., & Sengupta, S. K. 2000, ApJ, 541, 374
- Saumon et al. (2003) Saumon, D., Marley, M. S., & Lodders, K. 2003, arXiv:astro-ph/0310805
- Smith et al. (2001) Smith, V. V., Cunha, K., & King, J. R. 2001, AJ, 122, 370
- Timmes et al. (1995) Timmes, F. X., Woosley, S. E., & Weaver, T. A. 1995, ApJS, 98, 617
- Tsuji (1973) Tsuji, T. 1973, A&A, 23, 411
- Tsuji et al. (1996) Tsuji, T., Ohnaka, K., & Aoki, W. 1996, A&A, 305, L1
- Twarowski (1995) Twarowski, A. 1995, Combust. Flame, 102, 41
- Visscher & Fegley (2005) Visscher, C., & Fegley, B, Jr. 2005, ApJ, 623, 1221
- West et al. (2004) West, R. A., Baines, K. H., Friedson, A. J., Banfield, D., Ragent, B., & Taylor, F. W. 2004, in Jupiter, ed. F. Bagenal, T. E. Dowling, & W. B. McKinnon (Cambridge: Cambridge Univ. Press), 79
- Woiki & Roth (1994) Woiki, D., & Roth, P. 1994, J. Phys. Chem., 98, 12958
- Wong et al. (2004) Wong, M. H., Mahaffy, P. R., Atreya, S. K., Niemann, H. B., & Owen, T. C. 2004, Icarus, 171, 153
- Yamamura et al. (2000) Yamamura I., Kawaguchi, K., & Ridgeway, S. T. 2000, ApJ, 528, L33
- Yelle (1999) Yelle, R. 1999, in From Giant Planets to Cool Stars, ASP Conference Series, Vol. 212, ed. C. A. Griffith & M. S. Marley (San Francisco: ASP), 267
- Yoshimura et al. (1992) Yoshimura, M, Koshi, M., Matsui, H., Kamiya, K., & Umeyama, H. 1992, Chem. Phys. Lett., 189, 199
- Zahnle et al. (1995) Zahnle, K., Mac Low, M.-M., Lodders, K., & Fegley, B. 1995, Geophys. Res. Lett., 22, 1593
| object | MnS | Na2S | ZnS | NH4SH |
|---|---|---|---|---|
| Jupiter | 1800 | 1370 | 970 | 220 |
| Gliese 229B | 1380 | 1000 | 780 | |
| HD209458b | 1260 | aanight-side condensation | ||
| L dwarf | 1270 | |||
| M dwarf |
Note. — Condensation temperatures computed using [M/H] +0.5 for Jupiter, [M/H] -0.3 for Gliese 229B, and [M/H] 0 for HD209458b and the model L dwarf.
| triple pointaae.g., where for phosphorus-bearing gases A, B, C. | , K | |
|---|---|---|
| PH3-P4O6-P2 | 1101 | -1.20 |
| PH3-PH2-P2 | 1330 | -0.48 |
| P2-PO-PS | 1389 | -3.93 |
| P2-PH2-PO | 1780 | -1.26 |
| PH2-P-PO | 1811 | -1.20 |
| chemical lifetime, s | |||||
|---|---|---|---|---|---|
| reaction | 1000 K | 1500 K | 2000 K | kinetic data | |
| 53 | Yoshimura et al. (1992) | ||||
| 54 | Kurbanov & Mamedov (1995) | ||||
| 55 | Woiki & Roth (1994) | ||||
| 56 | Husain & Marshall (1986) | ||||
| 57 | Twarowski (1995) | ||||
| 58 | Arthur & Cooper (1997) | ||||
Note. — Convective mixing timescales (in seconds) are (1000 K), (1500 K), and (2000 K) for Jupiter, (1000 K), (1500 K), and (2000 K) for Gliese 229B, and to (1000 K), to (1500 K), and to (2000 K) for HD209458b. See §5.1 for details.