B and I-band optical micro-variability observations of the BL Lac objects S5 2007+777 and 3C371
We have observed S5 2007+777 and 3C371 in the and bands for 13 and 8 nights, respectively, during various observing runs in 2001, 2002 and 2004. The observations resulted in almost evenly sampled light curves, hours long. We do not detect any flares within the observed light curves, but we do observe small amplitude, significant variations, in both bands, on time scales of hours and days. The average variability amplitude on time scales of minutes/hours is % and % in the case of S5 2007+777 and 3C371, respectively. The average amplitudes increase to % and %, respectively, on time scales of days. We find that the and band variations are highly correlated, on both short and long time scales. During the 2004 observations, which resulted in the longest light curves, we observe two well defined flux-decay and rising trends in the light curves of both objects. When the flux decays, we observe significant delays, with the band flux decaying faster than the flux in the band. As a result, we also observe significant, flux related spectral variations as well. The flux-spectral relation is rather complicated, with loop-like structures forming during the flux evolution. The presence of spectral variations imply that the observed variability is not caused by geometric effects. On the other hand, our results are fully consistent with the hypothesis that the observed variations are caused by perturbations which affect different regions in the jet of the sources.
Key Words.:
galaxies: active — galaxies: BL Lacertae objects: general — galaxies: BL Lacertae objects: individual: S5 2007+777, 3C371 — galaxies: jets1 Introduction
BL Lac objects constitute a class of active galactic nuclei whose optical spectra usually do not exhibit strong emission or absorption lines. They show high polarization and continuum variability at all wavelengths at which they have been observed, from X-rays to radio. Their overall spectral energy distribution shows two distinct components in the representation, peaking from mm to the X–rays and at GeV–TeV energies, respectively (e.g. Fossati et al.. 1998). The commonly accepted scenario assumes that the non-thermal emission from BL Lacs is synchrotron and inverse-Compton radiation produced by relativistic electrons in a jet oriented close to the line of sight.
The galaxy 3C371 is classified as an intermediate source between BL Lacertae objects and radio galaxies (Miller 1975). Nilsson et al. (1997) and Pesce et al. (2001) have reported the detection of an optical and X-ray jet, respectively, associated with the source. 3C371 was one of the first quasars found to be variable on time scales of years/months/days. Optical variability studies have been conducted by Oke (1967), Sandage (1967), Usher & Manley (1968), Miller & McGimsey (1978), and Webb et al. (1998). Carini et al. (1998) presented dense optical monitoring observations of the source in the band, over a period of five nights. They observed intra-night variations with of the order of mag hr-1.
S5 2007+777 was classified as a BL Lac object by Biermann et al. (1981) because of its featureless optical spectrum at the time of the observation. Wagner et al. (1990) did not detect any significant variations in the optical ( band) and radio bands, during observations over a period of a few nights. Recently, Peng et al. (2000) presented contemporaneous radio, mm, infra-red and optical ( band) observations of the source over a period of three weeks. The source was variable in all bands on time scales of the order of a few days.
In this work, we present simultaneous and band monitoring observations of both 3C371 and S5 2007+777, obtained from Skinakas Observatory, Crete, Greece over a period of 8 and 13 nights, respectively, in 2001, 2002 and 2004. The quality of the light curves is similar to those presented by Papadakis et al. (2003, 2004) in the case of BL Lac and S4 0954+658. The present observations offer detailed light curves, in two different bands, to study the intra-night flux and energy spectral variations of the two sources.
Our main aim is to use them in order to investigate the flux and spectral variations of the source on time scales as short as a few minutes/hours. We detect small amplitude variations that are associated with energy spectral variations in a a rather complex way. Our results support the idea that the fast, optical intra-night variations in BL Lac objects are mainly caused by perturbations which activate different emitting regions in the jet.
2 Observations and data reduction
3C371 was observed for 3 nights in 2001 and 5 nights in 2004 with the 1.3 m, f/7.7 Ritchey-Cretien telescope at Skinakas Observatory in Crete, Greece. The observations were carried out through the standard Johnson and Cousins filters. The CCD used was a SITe chip with a 24 m2 pixel size (corresponding to on the sky). The exposure time per frame was 300 and 120 s for the and filters, respectively. S5 2007+777 was observed for 3 nights in 2001, 4 nights in 2002 and 6 nights in 2004 with the same telescope and camera configuration as in the case of 3C371. The exposure time per frame was 540 and 240 s for the and filters, respectively.
In Table 1 we list the observation dates and the number of frames that we obtained each night for both 3C371 and S5 2007+777. We observed S5 2007+777 325 and 316 times in the B and I bands, respectively, during the 13 nights of observations, and 3C371 a total of 263 and 266 times, over a period of 8 nights, in the same bands.
During the observations, the seeing varied between . Standard image processing (bias subtraction and flat fielding using twilight-sky exposures) was applied to all frames using standard IRAF111 IRAF is distributed by the National Optical Astronomy Observatories, which are operated by the Association of Universities for Research in Astronomy, Inc., under cooperative agreement with the National Science Foundation. routines. For both 3C371 and S5 2007+777 we performed aperture photometry by integrating counts within a circular aperture centered on the objects. For 3C371 we used an aperture of and for S5 2007+777 an aperture of .
| Date | Galaxy | ||
|---|---|---|---|
| (nof) | (nof) | ||
| 14/05/01 | S5 2007+777 | 20 | 19 |
| 15/05/01 | S5 2007+777 | 28 | 16 |
| 16/05/01 | S5 2007+777 | 29 | 27 |
| 31/08/01 | 3C371 | 30 | 31 |
| 01/09/01 | 3C371 | 29 | 33 |
| 05/09/01 | 3C371 | 17 | 16 |
| 18/09/02 | S5 2007+777 | 20 | 21 |
| 19/09/02 | S5 2007+777 | 16 | 18 |
| 20/09/02 | S5 2007+777 | 13 | 12 |
| 21/09/02 | S5 2007+777 | 30 | 30 |
| 28/07/04 | 3C371 | 37 | 39 |
| 29/07/04 | 3C371 | 35 | 34 |
| 30/07/04 | 3C371 | 36 | 35 |
| 31/07/04 | 3C371 | 51 | 50 |
| 02/08/04 | 3C371 | 28 | 28 |
| 03/08/04 | S5 2007+777 | 26 | 27 |
| 04/08/04 | S5 2007+777 | 31 | 29 |
| 05/08/04 | S5 2007+777 | 22 | 23 |
| 06/08/04 | S5 2007+777 | 31 | 32 |
| 07/08/04 | S5 2007+777 | 28 | 29 |
| 08/08/04 | S5 2007+777 | 31 | 33 |
| TOTAL | S5 2007+777 | 325 | 316 |
| TOTAL | 3C371 | 263 | 266 |
| Star | B | I |
|---|---|---|
| 1 | ||
| 2 | ||
| 3 | ||
| 4 | ||
| 5 |
| Star | B | I |
|---|---|---|
| 1 | ||
| 2 | ||
| 3 | ||
| 4 | ||
| 5 |
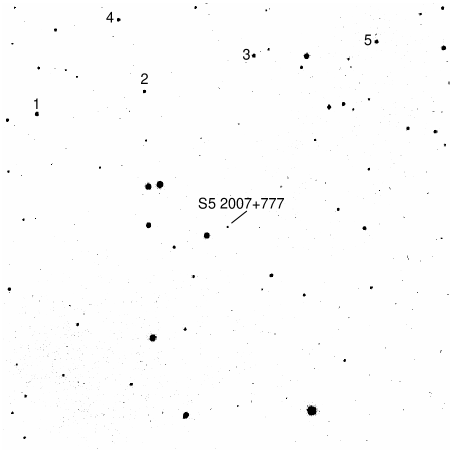
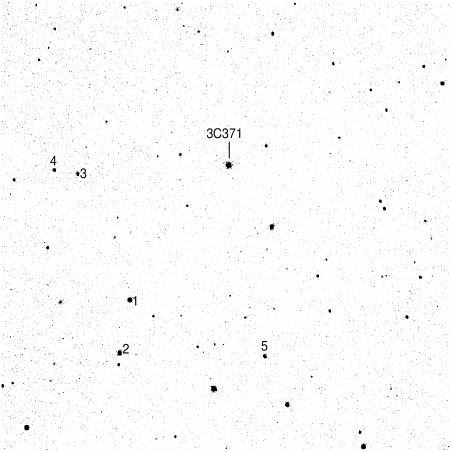
We did not find any published comparison star sequence in the fields of S5 2007+777 and 3C371 for both and bands. We therefore chose five unsaturated stars, close to S5 2007+777 (see Fig. 1) and five close to 3C371 (see Fig. 2) and carried out aperture photometry by integrating counts within circular aperture centered on each star. Their instrumental magnitudes were transformed to the standard system through observations of standard stars from Landolt (1992) during the nights of 5, 6 October 2001. Tables 2 and 3 list the magnitudes of the reference stars on the fields of S5 2007+777 and 3C371 respectively; quoted errors include both the uncertainty in the determination of the instrumental magnitudes (based on photon statistics) and the uncertainty associated with the transformation to the standard system. The uncertainty of the magnitude estimation of the BL Lac objects was computed using the standard “propagation of errors” formula (e.g. Bevington (1969), taking into account the photometry error of the source and standard stars’ measurements together with the uncertainty in the magnitude estimation of the comparison stars.
The calibrated magnitudes were corrected for Galactic reddening using the vales of and for S5 2007+777 and and for 3C371. These vales (taken from NED222The NASA/IPAC Extragalactic Database (NED) is operated by the Jet Propulsion Laboratory, California Institute of Technology, under contract with the National Aeronautics and Space Administration.) were extracted from the Schlegel et al. (1998) maps (calculated by using the versus relationship of Cardelli et al. 1989), and are representative of the Galactic absorption in the direction of the host galaxy.
We converted the dereddened magnitudes into flux, and we then corrected for the contribution of the host galaxy to the measured flux in each band as follows. We adopted the Scarpa et al. (2000), and Pursimo et al. (2002) host galaxy, R band magnitude estimates for S5 2007+777 and 3C371, respectively. We corrected them for Galactic absorption, and inferred the and magnitudes, using the elliptical galaxy colours of and (at redshift 0.2, appropriate for S5 2007+777) and and (at zero redshift, in the case of 3C371) from Fukugita et al. (1995). Assuming a de Vaucouleurs -law profile, we estimated the host galaxy contribution within the circular aperture used for the photometry, and subtracted it from our dereddened light curves of each object. Note that the subtraction of the host galaxy contribution in the case of 3C371 is necessary, otherwise this bright, “steady-state” flux contribution can seriously wash-out the intrinsic variability amplitude of the central source.
3 The observed light curves
3.1 S5 2007+777
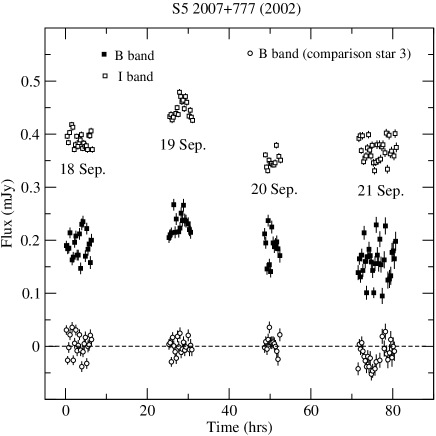
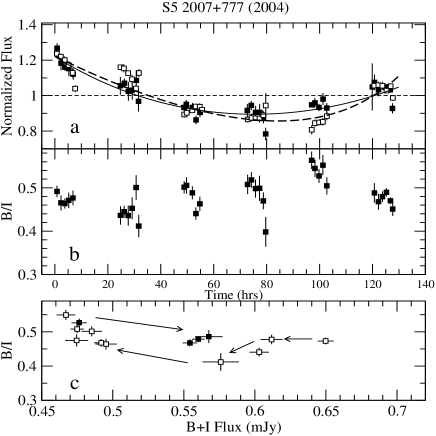
Figs. 3, 4 and 5 show the dereddened and light curves of S5 2007+777 during the 2001, 2002 and 2004 observations, respectively. In the same figures we also show the band light curve of the comparison star 3. S5 2007+777 was in a similar flux state during the three observing periods. The 2004 and 2002 light curves show min-to-max variations of the order of % on a time scale of days. During 2001, the variations are of smaller amplitude (%).
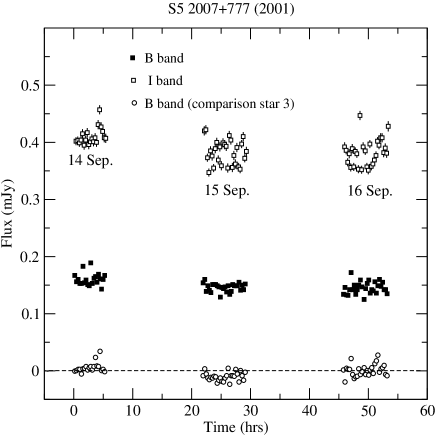
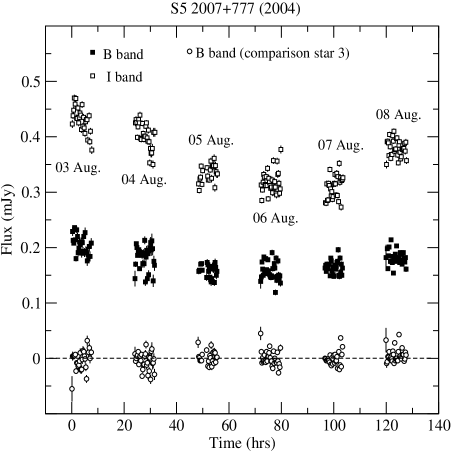
An unusual feature of the S5 2007+777 light curves is the large intra-night “scatter” that is observed in both band light curves (see for example the and band 21 Sep. 2002 observations). There seems to be little correlation between these intra-night, low amplitude variations in the two bands. If intrinsic, this is a rather unexpected result. However, for a source as faint as S5 2007+777, these variations may correspond to experimental uncertainties in the flux measurement of the source, which for some reason are not taken into account by the formal errors of the photometry. In order to investigate this issue further, we calculated the standard deviation of the and band light curves of the comparison stars 4 and 2 during each night (these are the faintest of the comparison stars in the respective bands). We find an average scatter of and mJy, for the and band light curves, respectively. These are slightly smaller than the intra-night standard deviation of the S5 2007+777 light curves.
In order to investigate this issue further, we employed the techniques described in Howell et al. (1988). Following their prescription, we investigated whether the very fast, small amplitude, erratic variations seen in the 2001 observations of S5 2007+777 are intrinsic or not. We chose stars 2 and 4 in Table 2 as our “C” and “K” comparison stars. Then, for each night, in each band, we used the individual CCD frames to estimate on a frame by frame basis (using their equation 13). We then calculated the average value, and the sample variances , using the differential magnitude intra-night light curves. The results from the application of the test statistic for variability that these authors suggest (equation 16 in their paper) do not confirm the band, intra-night variations during the 2001 observations of S5 2007+777 to be significant at a confidence level higher than 95%. The same holds true in other cases as well (for example the 21 September, 2002 intra-night variations). However, we do find that the intra-night, band variations observed during a few nights (e.g. during the August 03 and 04, 2004 observations) are significant at the 95% confidence level. In this case though, this result can be explained by the presence of well defined flux decay/rise trends rather than the scatter around them. The picture is different in the case of the band intra night light curves. With the exception of the September 14 2001 observations, we find that the observed scatter in the September 15 and 16 2001 observations, the observed small amplitude band variations are significant at the 99.9% confidence level. However, we note that both the “C” and “K” comparison stars are much brighter than S5 2007+777. Consequently, the average values are significantly larger than 1, i.e. the optimum cases according to Howell et al. (1988). It is not clear how this situation can affect our results, but these authors do warn that in cases like ours one is left with a less “strigent” test of variability.
We conclude that most of the observed band, intra-night, low-amplitude, erratic variations in the S5 2007+777 light curves are not intrinsic, while the opposite is true in the case of the band light curves. More band observations are required in order to verify this result, and more accurate band light curves in order to investigate whether similar variations are also present in them.
In order to reduce the experimental noise, we binned the light curves using bins of size 1.5 hrs. Typically, there are points in each bin of that size. We estimated their mean and standard deviation, which we accepted as representative of the uncertainty of the mean value in each bin. This has the positive effect of providing an empirical estimate of the error, despite the modest bin size, relying less heavily on theoretical calculations which may not take into account all “systematic” effects.
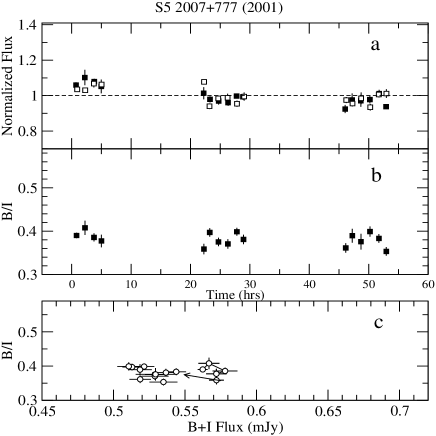
The resulting light curves, normalized to their mean, are plotted in Figs. 8a, 9a and 10a and are presented in the following section. The binned light curves show the same variability trends, already visible in Fig. 3, 4 and 5, but more clearly. A test indicates that they are all significantly variable.
Both the and band light curves show similar variations. During August 2004, the flux decreases slowly over a period of 4 days, and then increases in the following two nights. Flux decreasing or increasing trends are observed within individual nights as well (e.g. during the Aug. 3rd and 7th observations). During the September 2002 observations, the flux increases in the first two nights, and then decreases in the following two nights. Finally, during the 3 day long September 2001 observations we observe a steady, low amplitude (%) flux decrease in both light curves. There is no indication of a clear “flare-like” event, either during individual nights or over the whole period of each observing run.
The fractional variability amplitude, (defined as in Papadakis et al., 2003) of the band 2001, 2002 and 2004 light curves is 4.3%, 12.9% and 9.5%, respectively. The respective amplitude estimates for the band light curves are: 4.1%, 8.9%, and 12.4%. Within each night, the average amplitude of the observed variations during the 2002 and 2004 observations is: %, and %. These are comparable to the average variability amplitude of the S4 0954+658 observations on similar time scales, and lower than those we have measured in BL Lac, using light curves generated by a similar sampling pattern (Papadakis et al., 2003, 2004).
3.2 3C371
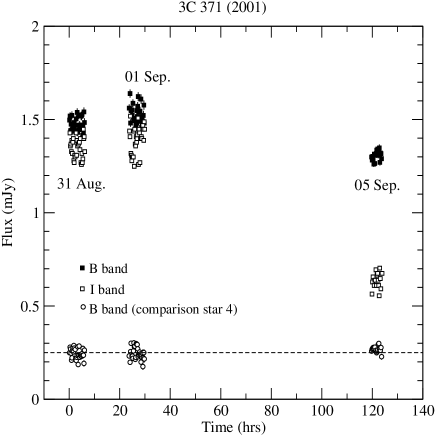
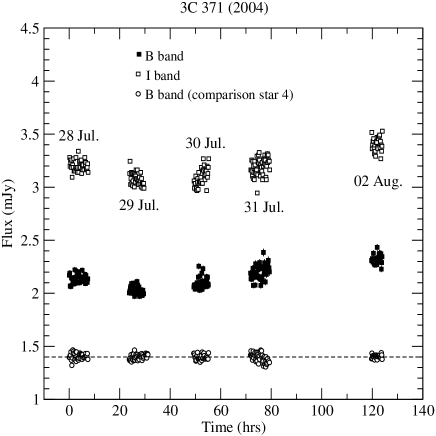
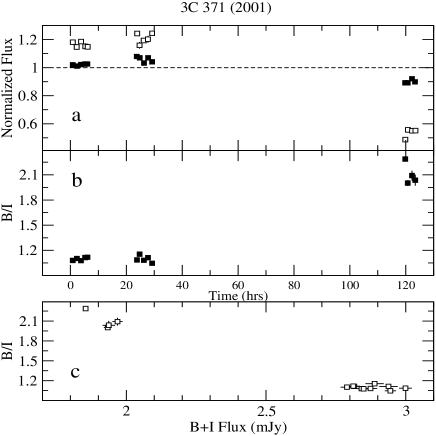
Figs. 6 and 7 show the dereddened and light curves of 3C371 during the 2001 and 2004 observations, respectively. In the same figures we also show the band light curve of comparison star 4. 3C371 was in a brighter flux state during the 2004 observing run.
Although 3C371 is a brighter source than S5 2007+777, considerable intra-night “scatter” is also observed in its light curves. In this case, the standard deviation of the comparison stars intra-night light curves is smaller than that of the 3C371 light curves. Therefore it is rather unlikely that the observed scatter is caused by unaccounted uncertainties in the photometry of the source or of the comparison stars. However, the host galaxy of 3C371 is very bright. It is possible then that the observed low amplitude, random variations in the object’s light curves are caused by the unavoidable variation of the host galaxy contribution to the measured flux in an aperture of fixed size due to small seeing variations within each night.
As with S5 2007+777, in order to reduce the scatter in the light curves, we binned them using bins of size 1.5 hrs. On average, there are 6 points in each bin (the resulting light curves, normalized to their mean, are plotted in Figs. 11a and 12a, presented in Section 4). The variability patterns evident in Figs. 6 and 7 are now more apparent in the binned light curves.
Both band light curves show similar variations. During the July/August 2004 observations the flux decreases the first two nights, and then increases in the following 4 nights by %, in both bands. The behaviour of the source is significantly different during the 2001 observations. First of all the band flux level is larger than that of the band (see Fig. 6). Then, although the flux remains almost constant during the first two nights, the band flux drops by more than half within 4 days (no comparison star light curve shows any sign of such a large flux drop in the same period). This is the largest amplitude variation observed in the present light curves of both objects. During the same period the band flux also decreases, but only by a factor of %.
The fractional variability amplitude, , of the band 2001 and 2004 light curves, taken as a whole, is 6.7%, and 4.6%, respectively. The respective amplitude estimates for the band light curves are: 30.5%, and 3.6%. Within each night, the average amplitude of the observed variations during the 2002 and 2004 observations is much smaller: %, and %. This is almost half the average variability amplitude of S5 2007+777 on similar time scales (i.e. of the order of a few hours). Note that this amplitude is estimated after the subtraction of the host galaxy contribution. Had we not subtracted it, the variability amplitude would be significantly reduced.
4 Spectral variability
In order to study the spectral variability of both sources, we calculated the ratio of the over the band flux using the 1.5 hrs binned dereddened light curve. Assuming a power-law like spectrum, the ratio is representative of the spectrum’s slope. Plots of the ratio light curves during the various observing periods are shown in Figs. 8b, 9b, and 10b in the case of S5 2007+777, and Figs. 11b and 12b in the case of 3C371. In the lower panel of the same figures we also plot the ratios versus the sum of the and source flux, which we consider as representative of the “total” source flux. These plots can be used to investigate whether the spectral variations are correlated with corresponding flux variations or not.
4.1 S5 2007+777
During the 2001 observations of S5 2007+777, the flux ratio stays roughly constant at . A test shows that, formally speaking, the flux ratio is variable ( for degrees of freedom, when we fit the data with a constant). However these variations are of small amplitude (%), like the small amplitude flux variations we observe in the light curves. Furthermore, as Fig. 8c shows, they are not correlated with the source flux, apart perhaps from the observations during September the 14th. The data from this night are connected with a solid line in this panel. The ratio appears to follow a small loop-like pattern, which evolves towards the clockwise direction as the flux evolves.
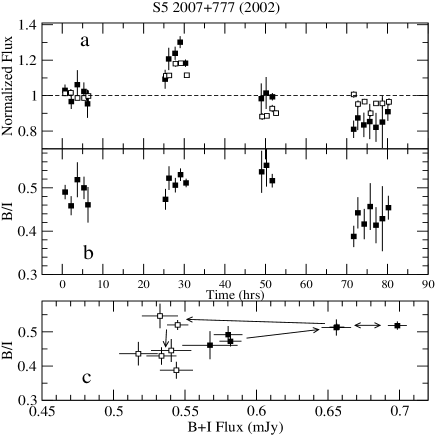
The situation is markedly different during the 2002 and 2004 observations. In both cases, the larger amplitude flux variations are associated with larger amplitude spectral variations as well: % and %, on average, respectively. What is even more important though is that the spectral variations are correlated with the source variations in these cases. Fig. 9c and 10c show the vs plots for the 2002 and 2004 observations. In order to show clearly that the spectral variations are indeed correlated with the flux changes, the ratios in these plots have been calculated using 3-hrs binned and light curves.
In the 2002 observations, as the flux rises during the first two nights (filled circles in Fig. 9c) the flux ratio increases as well, implying a “hardening” of the source’s spectrum. This “harder when brighter” behaviour is typical of BL Lac objects. Then, as the flux decreases in the following night, the flux ratio remains constant, and then decreases, although the source flux remains roughly constant (open squares in Fig. 9c). Clearly, the spectral slope does not evolve in the same way, i.e. it does not follow the same path in the vs plane during the flux rise and subsequent decay. Instead, it follows a clear loop-like pattern, which evolves in the anti-clockwise direction.
We observe flux related spectral slope variations during the 2004 observations as well (Fig. 10c; the flux ratios shown in this plot are calculated again using 3-hrs binned and light curves). During the first two nights, the flux decays and the spectrum becomes “softer”. However, although the flux keeps decreasing in the following two nights, the spectrum hardens (i.e. increases). Finally, as the flux is rising in the last two nights of observations, the spectrum softens once more (filled squares in Fig. 10c), but following a clearly different path than that during the original flux decaying phase. Although clearly related, the flux ratio does not vary with flux in a simple linear way. Instead, the evolution during the flux decay and subsequent rise defines a loop-like pattern which evolves on the clockwise direction.
In order to understand better the reason for the spectral variability observed during the 2004 observations we fitted the and band light curves with an empirical model which consists of the sum of two exponential functions, one decaying and the other rising, i.e. , where is the source flux, and are the characteristic rising and decaying time scales, respectively. The best fitting curves are also shown in Fig. 10a (solid and dashed lines for the and band light curves, respectively). Although they do not provide a formally acceptable fit to the observed light curves, they describe rather well the broad flux decaying and rising trends that they exhibit. The best fitting value of the characteristic rising and decaying time scales are hrs, hrs, and hrs, hrs.
These results provide an explanation for the spectral variations that we observe during the 2004 observations of the source. The band flux decreases faster at the beginning of the observations (i.e. ). In fact, as is evident from Fig. 10a, there seems to be a hrs delay between the and light curve minima. Later on, although the band flux still decreases, the band flux remains roughly constant. Consequently, the ratio increases although the total flux still decreases. Finally, as the the flux starts rising, the ratio decreases again, because the band flux increases faster than that in the band (i.e. ). However, since , the ratio does not follow the same path in the vs plane during the flux rise and decay phases, and the loop-like structure forms.
4.2 3C371
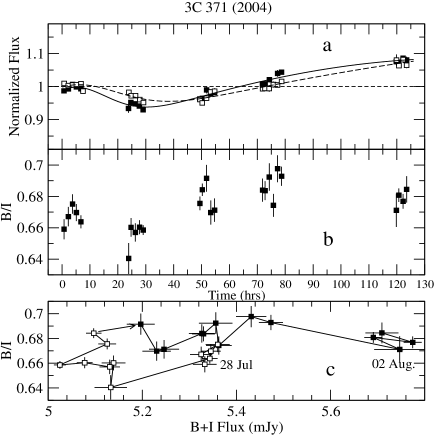
The 3C371 2004 observations also display flux related spectral variations. During the first two nights, as the flux decreases, the spectrum becomes softer (i.e. decreases) as well. In the following three nights, as the flux rises the ratio increases as well. The flux ratio does not follow a well defined linear trend in either case. Instead, a loop-like pattern which evolves in the clock-wise direction is visible in the vs plot of these observations (Fig. 12c).
In Fig. 12a, together with the normalised, binned and light curves, we also show two lines which describe rather well the flux evolution in the two bands during our observations (solid and dashed lines, for the and light curves, respectively). These lines correspond to the best fitting curves of a model which consists of the sum of two Gaussians, i.e. , where is the source flux (exponentially decaying and rising functions do not describe well the observed flux variations in this case). The rate of the flux variations is characterised by the width of the Gaussians; the wider the Gaussian (i.e. the larger the ) the slower the flux varies. Our best fitting values are: and hrs. These results suggest that the band decays and rises faster than the band light curve. Again, as in the case of the S5 2007+777 observations in 2004, there appears to be a hrs delay between the and light curves at minimum (with the band light curve leading).
As a result of the differences between the and rise and decay time scales, the ratio decreases as the flux decays, however, as it subsequently rises, the flux ratio increases because is rising faster than . Only during the last night of observations, when the light curve may have started to decay while is still rising, the flux ratio appears to decrease again.
Finally, during the first two nights of the 2001 observing run of 3C371, the ratio remains constant at , a value already larger than the flux ratio during the 2004 observations. Then, in the last night the flux ratio increases to , implying a remarkable spectral hardening despite the fact that the source flux decreases. As we mentioned in the previous section, the optical flux variability behaviour of the source during these observations is rather unusual for a BL Lac object.
5 Cross correlation analysis
In general, the presence of flux related spectral variations imply the existence of delays between the variations in different bands, caused by the different characteristic time scales on which they evolve (as we showed in the previous Section). In order to investigate this issue further, we estimated the cross-correlation function (CCF) using the “Discrete Correlation Function” of Edelson & Krolik (1988). We used the original light curves (i.e. without any binning), and estimated the CCF for the observations of S5 2007+777 in 2002 and 2004 observations, and for the observations of 3C371 in 2004, up to lags of hrs (a time scale which is roughly equal to half the duration of our observations each night). In all cases we used a lag of size 0.5 hrs. The CCFs are estimated in such a way so that a positive lag would imply that the band leads the band variations.
Our results are shown in Fig. 13. The two S5 2007+777 CCFs look very similar. For that reason we added them together to estimate a mean S5 2007+777 CCF, and this is what we plot in Fig. 13. Both the S5 2007+777 and the 3C371 CCFs show maxima of the order of . Furthermore, they are very broad, with no clear indication of any significant delays between the the and band variations. The large CCF maxima are in agreement with the fact that the and light curves of the two objects show almost identical variations within each individual night. The lack of any delays up indicates that the and band variations, on time scales of minutes/hours, happen almost simultaneously.
In the previous Section, based on the model fitting of the observed light curves, we found evidence of delays between the and band variations of the order of hrs, a time scale much longer than the lags on which we have estimated the CCFs shown in Fig. 13. Although the length of some of our light curves is considerably longer than 10 hrs, the CCF estimation on these long time scales is not easy, due to the presence of long gaps in them. Nevertheless, in the lower panel of Fig. 13 we plot the CCF of the 2004 S5 2007+777 observations, estimated up to lags of hrs, using a lag bin of size 4.5 hrs. This is the best of the available light curves for the estimation of the CCF on long time scales, because it has the largest number of consecutive nights with available observations.
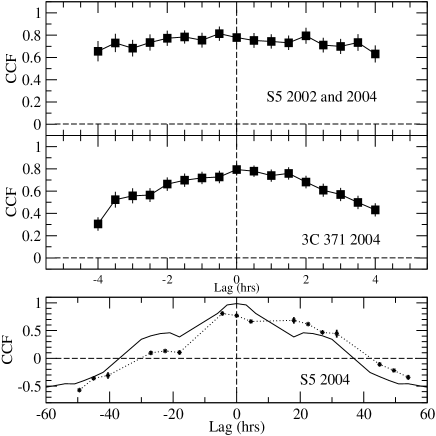
The CCF is not well defined, but there appears a clear asymmetry towards positive lags. This can be easily seen if one compares the observed CCF with the band auto-correlation function (ACF), which is also plotted in the same panel (solid line). At negative lags, and at lags hrs, the CCF points are consistently below the ACF, while the opposite is true at larger lags. This result implies that, at lags longer than hrs, the correlation of the band with the band light curve is stronger than that with itself (and vice versa for smaller and negative lags). In order to get an estimate of the average delay between the two light curves we fitted the observed CCF between lags and hrs with a Gaussian. We find a delay of hrs, (with the band leading), comparable to the delay in the and light curves minima that we had found in the previous section.
We conclude that, despite the low intra-night variability amplitude, the and light curves of S5 2007+777 and 3C371 are highly correlated on time scales of the order of a few hours. Any delays must be smaller than hour. On longer time scales though, at least during the S5 2007+777 2004 observations, there is an indications that the variations in the band light curve are leading those in the band light curve by hrs.
6 Discussion and conclusions
We have observed S5 2007+777 and 3C371 in the and bands for 14 and 8 nights, respectively, during various periods in 2001, 2002 and 2004. The light curves last for hours. There are points in each of them, almost evenly spaced, with an average sampling interval of hours, on average. These are the most detailed short term, optical monitoring observations in two bands of these two objects to date. Our results can be summarized as follows:
1) Both sources shows intrinsic, low amplitude variations (% and % in the case of S5 2007+777, and 3C371 respectively) on time scales as short as a few hours. On time scales of a few days we observe broad flux rising or decaying trends with an average amplitude of % (S5 2007+777) and % (3C371). In the case of the 2001, band light curve of 3C371 we observed a large amplitude variation, of the order of %, within 5 days.
2) The observed small amplitude intra-night variations in the two bands are highly correlated, with no delay larger than hr detected in any case.
3) The 2004 3C371 and S5 2007+777 observations resulted in the longest and best sampled light curves. They show well defined broad decaying and rising flux patterns. We find that the flux rising and decaying time scales are not equal, neither within or between the two band light curves. In both objects, we also observe a hrs delay between the flux minima in the and light curves. In the case of S5 2007+777, this result is also supported by the CCF analysis, which reveals a similar delay between the and band observations.
4) We observe spectral variations in almost all cases. They are clearly correlated with the flux variations in the case of the 2002 and 2004 S5 2007+777, and 2004 3C371 observations. We have observed the usual “harder when brighter/softer when fainter” behaviour (during the S5 2007+777 observations in 2002 and 2004, respectively) but we have also observed “unusual” behaviour like spectral softening while the flux increases (during the S5 2007+777 observations in 2004) and the significant hardening of the spectrum during a large flux decrease in the 2001 3C371 observations.
5) In general, the relation between flux and spectral variations is not linear. Instead, we have detected loop-like patterns in the “spectral slope vs flux” plane which evolve in the clockwise (during S5 2007+777 and 3C371 2004 observations) and anti-clockwise direction (during the S5 2007+777 2002 observations).
Variability observations of BL lac objects in more than one bands can in principle impose significant constraints on the mechanism that causes the observed variations in the source. To this end, we briefly investigate below some consequences of our results from the 2004 observations of both objects mainly.
The continuum emission in BL Lacs is believed to arise from a relativistic jet oriented close to the observer, i.e. the emitted radiation is highly beamed in the forward direction. One possible mechanism that can explain the observed variations in some cases is if the optical emission is produced in discrete blobs moving along magnetic fields, and the viewing angle (i.e. the angle between the blob velocity vector and the line of sight) varies with time. In this case the beaming or Doppler factor should vary accordingly and, since the observed flux depends on this, viewing angle variations can result in flux variations (see e.g. Wagner et al. (1993) in the case of S4 0954+658 optical variations). A change of less than 0.5 degrees only can explain flux variations of the order of % (Ghisellini et al. 1997). In this case, we would expect the variations to be “achromatic” (assuming no spectral break within the considered optical bands). However, during the present observations, we do observe significant spectral variations which are correlated with the associated flux variations. Therefore, we conclude that the observed variability in the light curves of these sources do not have a geometric origin.
On the other hand, the significant, flux related, energy spectral variations that we observe can be explained if a perturbation activates a region in the jet, filled with energetic particles which emit through synchrotron radiation. In this case, the important time scales which govern the spectral evolution of the source are the acceleration, cooling, escape and light travel time scales.
The first obvious constrain that our results can impose on this class of models stems from the fact that the decay and rising time scales are not equal during the 2004 observations of both objects. The conclusion is that the flux evolution is not determined by the light source crossing time. If both the particle injection and cooling process were operating on time-scales shorter than (where is the source radius) we should expect the flux rise and decay to be symmetric. Therefore, either the injection/acceleration or/and the cooling time scales must affect the observed variations.
We find that during the first part of the 2004 S5 2007+777 and 3C371 light curves, the flux decays faster in the band, hence the time difference between the minimum in the and band light curves. This could be explained by the cooling of the emitting particles due to synchrotron and self-Compton radiative losses. For a particle of energy , emitting at an observed frequency of , the cooling time is . The ratio of the and band median frequencies is roughly 1.8, implying that . This value is very close to the ratio of that we estimated in section 3.1, in the case of the 2004 S5 2007+777 data, and to the ratio of in the case of the 3C371 light curves. It is indeed possible then, that the flux evolution during the first part of these observations is governed by the radiative losses of the emitting particles.
The spectral evolution is different in the second part of the S5 2007+777 and 3C371 light curves, when the flux starts rising. In S5 2007+777, we observe the band flux rising faster than the flux in the band. This situation could correspond to the initial stages of the passage of a shock front in the emitting region. In particular, the decrease of the flux ratio with increasing flux that we observe during the flux rising phase (filled squares of Fig. 10c) is expected in the case when the cooling and acceleration time scales of the emitting particles are comparable. In this case, particles are gradually accelerated into the radiating window, and the information about the onset of a flare initially propagates from lower to higher energy (Kirk, Rieger & Mastichiadis 1998). Indeed, the spectral slope vs flux evolution that we observe is almost identical to the spectral evolution during the initial phase of the flare as shown in Fig. 4 of Kirk et al.(1998).
On the other hand, during the flux rising phase of the 2004 3C371 light curves, we observe the opposite effect: the flux rising first in the and then in the band. This behaviour is expected in the case when the source is injected with particles at high energies for a long period (which could be comparable to ). In this case, the emission starts increasing at high energies (i.e. in the band) for as long as the injection continues and the emitting volume increases accordingly. The particles start emitting at lower frequencies (i.e. in the band) only after some time equal to the cooling time scale, hence the delay in the increase of the flux in the band.
The unusual behaviour of 3C371 during the 2001 observations is difficult to explain. The fact that can result in the case when the peak synchrotron emission frequency has moved above the optical band and the optical spectral slope is larger than . However, this peak emission frequency increase is usually caused by the onset of a major jet perturbation which also produces a significant flux increase. Since the source flux during the 2001 observations is lower than that in the 2004 observations, this is probably not a valid scenario. The opposite effect, i.e. a significant decrease in the peak emission frequency, is another possibility. Perhaps the band is already dominated by the Compton component (produced by particles of small energy, whose cooling time is long) at the beginning of the observations while the sudden, large amplitude flux drop in the band between 1st and 5th of September, marks the transition of the band flux from the synchrotron to the Compton regime. However, due to the sparse sampling of the available light curves no further conclusions can be drawn.
The observed spectral and flux variations of 3C371 and S5 2007+777 are similar to those observed by us in BL Lac and S4 0954+658, using multicolour light curves of similar length and sampling pattern. All these four objects are “Low-Frequency peaked BL lacs” (LFBs), i.e. the synchrotron peak in their spectrum is located at mm/IR/optical wavelengths (see e.g. Peng et al. 2000 in the case of S5 2007+777, and Sambruna. Maraschi & Urry, 1996, in the case of 3C371). Their optical emission corresponds to a frequency range around and above the synchrotron flux maximum, and should be emitted by the most energetic particles with the in the jet. Their cooling time scales can be quite small, and, depending on the acceleration time scale and the size of the source, multi-band optical monitoring of these sources could be particularly beneficial as it can reveal all sorts of complicated flux related spectral variations, even on time scales of minutes/hours.
Our results offer direct evidence that the fast, low amplitude variations in the optical light curve of these 4 LBLs are caused by rapid perturbations in the jet, which evolve on time scales of hours/days (except from S4 0954+658 where some of the short term variations could have a geometric origin). As shock fronts overrun different regions in the jet, we expect to observe flux related energy spectral variations, as we do. The fact that we do not observe the same variability behavior at all times within each source, or between different sources, implies that these perturbations do not always evolve on the same time scale, and they affect regions of different size in the jet.
Acknowledgements.
We thank the anonymous referee for useful comments. Skinakas Observatory is a collaborative project of the University of Crete, the Foundation for Research and Technology-Hellas, and the Max–Planck–Institut für extraterrestrische Physik. Part of this work was supported by the European Commission under the TMR program, contract number HPRN-CT-2002-00321.References
- (1) Bevington, P.R. 1969, Data Reduction and Error Analysis for the Physical Sciences. (New York: McGraw-Hill)
- (2) Biermann, P., Duerbeck, H., Eckart, A., et al. 1981, ApJ, 247, 53
- (3) Cardelli, J.A., Clayton, G.C., & Mathis, J.S. 1989, ApJ, 345, 245
- (4) Carini, M.T.; Noble, J.C., Miller, H.R. 1998, AJ, 116, 2667
- (5) Edelson, R.A., & Krolik, J.H. 1988, ApJ, 333, 646
- (6) Fukugita, M., Shimasaku, K., Ichikawa, T. 1995, PASP, 107, 945
- (7) Fossati, G., Maraschi, L., Celotti, A., Comastri, A., & Ghisellini, G. 1998, MNRAS, 299, 433
- (8) Ghisellini, G, Villata, M., Raiteri, C.M., et al. 1997, A&A, 327, 61
- (9) Howell, S.B., Mitchell, K.J., Warnock III, A., 1988, AJ, 95, 247
- (10) Kirk, J.G., Rieger, E.M., & Mastichiadis, A. 1998, A&A, 333, 452
- (11) Landolt, A.U. 1992, AJ, 104, 340
- (12) Miller, H.R. 1975, ApJ, 201, 109
- (13) Miller, H.R., McGimsey, B.Q. 1978, ApJ, 220, 19
- (14) Nilsson, K., Heidt, J., Pursimo, T., Sillanpaeae, A., Takalo, L.O., Jaeger, K. 1997, ApJ, 484, 107
- (15) Oke, J. B. 1967, ApJ, 147, 901
- (16) Peng, B., Kraus, A., Krichbaum, T.P., et al. 2000, A&A, 353, 937
- (17) Pesce, J.E., Sambruna, R.M., Tavecchio, F., Maraschi, L., Cheung, C.C., Urry, C.M., Scarpa, R. 2001, ApJ, 556, 79
- (18) Papadakis, I.E., Boumis, P., Samaritakis, V., Papamastorakis, J. 2003, A&A, 397, 565
- (19) Papadakis, I. E., Samaritakis, V., Boumis, P., Papamastorakis, J. 2004, A&A, 426, 437
- (20) Pursimo, T., Nilsson, K., Takalo, L. O., Sillanp, A., Heidt, J., Pietil, H. 2002, A&A, 381, 810
- (21) Sambruna, R., Maraschi, L., & Urry, M.C. 1996, ApJ, 463, 444
- (22) Sandage, A. 1967, ApJ, 150, 177
- (23) Scarpa, R., Urry, C.M., Falomo, R., Pesce, J.E., & Treves, A. 2000, ApJ, 532, 740
- (24) Schlegel, D.J., Finkbeiner, D.P., & Davis, M. 1998, ApJ, 500, 525
- (25) Usher, P.D., Manley, O.P. 1968, ApJ, 151, 79
- (26) Wagner, S. J., Sanchez-Pons, F., Quirrenbach, A. & Witzel, A. 1990, A&A, 235, L1
- (27) Wagner, S. J.,Witzel, A., Krichbaum, T. P., et al. 1993, A&A, 271, 344
- (28) Webb, J.R., Freedman, I.; Howard, E., et al. 1998, AJ, 115, 2244