Quasars in the MAMBO blank field survey††thanks: Based on observations with the 100-m telescope of the MPIfR (Max-Planck-Institut für Radioastronomie) at Effelsberg, with the IRAM Plateau de Bure Interferometer and the IRAM 30m MRT at Pico Veleta, with the NRAO VLA, with the Spitzer Space Telescope, which is operated by the Jet Propulsion Laboratory, California Institute of Technology under NASA contract 1407, and with the Gemini Observatory, which is operated by the Association of Universities for Research in Astronomy, Inc., under a cooperative agreement with the NSF on behalf of the Gemini partnership: the National Science Foundation (United States), the Particle Physics and Astronomy Research Council (United Kingdom), the National Research Council (Canada), CONICYT (Chile), the Australian Research Council (Australia), CNPq (Brazil) and CONICET (Argentina). IRAM is supported by INSU/CNRS (France), MPG (Germany) and IGN (Spain). The National Radio Astronomy Observatory (NRAO) is a facility of the National Science Foundation operated under cooperative agreement by Associated Universities, Inc.
Our MAMBO 1.2 mm blank field imaging survey of sqd has uncovered four unusually bright sources, with flux densities between 10 and 90 mJy, all located in the Abell 2125 field. The three brightest are flat spectrum radio sources with bright optical and X-ray counterparts. Their mm and radio flux densities are variable on timescales of months. Their X-ray luminosities classify them as quasars. The faintest of the four mm bright sources appears to be a bright, radio-quiet starburst at , similar to the sources seen at lower flux densities in the MAMBO and SCUBA surveys. It may also host a mildly obscured AGN of quasar-like X-ray luminosity. The three non-thermal mm sources imply an areal density of flat spectrum radio sources higher by at least 7 compared with that expected from an extrapolation of the lower frequency radio number counts.
Key Words.:
Galaxies: active – Galaxies: high redshift – Galaxies: starburst – Galaxies: individual: MMJ1540+6605, MMJ1541+6630, MMJ1541+6622, MMJ1543+6621 – quasars: general – Submillimeter1 Introduction
Blank field surveys with the SCUBA and MAMBO bolometer arrays were able to resolve a good fraction of the extragalactic far-infrared (FIR) background radiation that was discovered by COBE (Puget et al. 1996) into point sources, revealing a population of previously unknown dust-enshrouded, optically faint starburst galaxies at high redshifts (Smail et al. 1997; Hughes et al. 1998; Barger et al. 1998; Bertoldi et al. 2002; Blain et al. 2002; Chapman et al. 2005). One aim of the MAMBO survey was to cover a large field, in order to better constrain the abundance and nature of the brightest mm background sources. By now, about 2700 arcmin2 have been imaged to rms depths ranging from 0.5 to 3 mJy per 11 arcsec beam (Bertoldi et al. 2000; Dannerbauer et al. 2002, 2004; Eales et al. 2003; Greve et al. 2004). Most of the MAMBO and SCUBA sources show faint radio (20 cm) counterparts. Their radio-to-mm spectral energy distributions (SEDs) are similar to starburst galaxies, which are dominated in the radio by synchrotron emission, and in the (sub)mm by a steeply rising thermal dust emission spectrum.
The estimated infrared luminosities of the (sub)mm background sources imply star formation rates of order 1000 M⊙ yr-1, which to sustain would require them to be very massive systems, comparable to the massive spheroids in the local universe. Recent CO detections in seven SCUBA and MAMBO galaxies imply luminous and dynamical masses of order M⊙ (Neri et al. 2003; Greve et al. 2005).
It has been a main motivation for the wide field MAMBO surveys to constrain the volume density of the most massive starburst galaxies at high redshifts. We here report first results of our shallow wide field surveys, focusing on the detection of the four brightest sources ever found in mm or submm blank field surveys.
2 Observations
Using the Max-Planck Millimeter Bolometer (MAMBO, Kreysa et al. (1998, 2002)) 1.2 mm (250 GHz) 37- and 117-element arrays at the IRAM 30 m telescope we have imaged four fields: the Abell 2125 field covers an area of about 1600 arcmin2 (Fig. 1), the COSMOS field covers 500 arcmin2, the Lockman Hole covers 400 arcmin2 and the NTT deep field covers 200 arcmin2, adding up to 2700 arcmin2 imaged to an rms noise level ranging from 0.5 to 3 mJy per 11 arcsec beam. More than 60 significant () sources have been detected, most of which show a faint (Jy) 1.4 GHz radio counterpart (Bertoldi et al., in preparation).
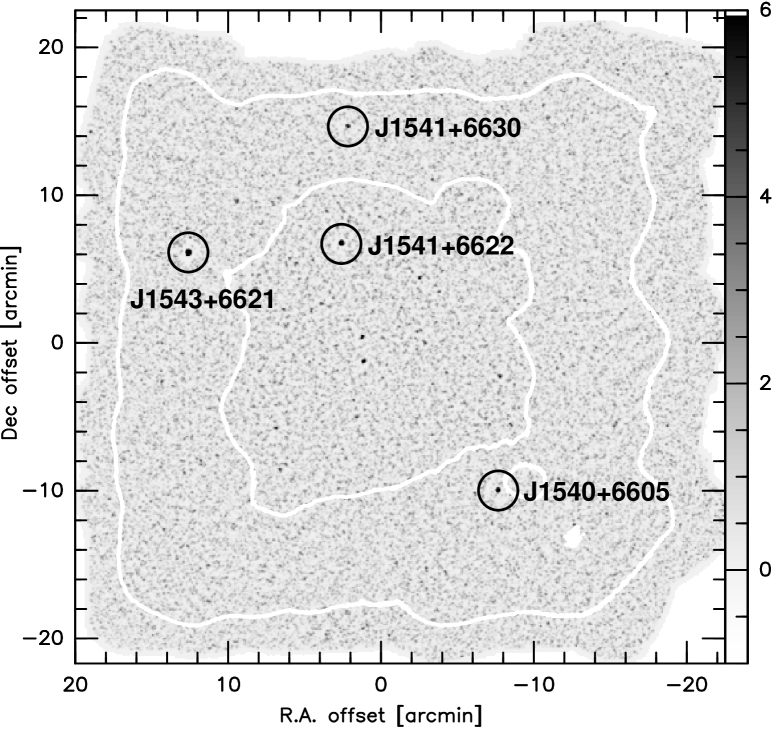

We discovered four previously unknown sources with mJy in this MAMBO survey (Tables 1 and 2). They are all located in the Abell 2125 field, which is centered on the diffuse, low density galaxy cluster Abell 2125 at (Owen et al. 1999). Their mm flux densities were monitored with MAMBO pointed observations, showing considerable variability on timescales of months for the three brighter sources MMJ1540+6605, MMJ1541+6622 and MMJ1543+6621 (Fig. 2). Those were also observed simultaneously at 1 mm and 3 mm with the Plateau de Bure interferometer (PdBI), showing them to have spectra declining with frequency (Fig. 4).
Deep ( Jy rms) VLA 20 cm images (Owen et al. 2005a) show likely radio counterparts to all four sources, providing positions to about 0.5 arcsec accuracy. Short observations were also made a 4.86 and 8.46 GHz in August 2000 with the VLA D configuration, which are reported by Owen et al. (2005b), and 324 MHz observations were made in April 2002 (Owen & Clarke, private communication). We performed near-simultaneous cross-scan observations of MMJ1540+6605, MMJ1541+6622 and MMJ1543+6621 with the Effelsberg 100 m telescope at 4.85, 8.35, 10.45 and 14.6 GHz on March 24th, 2005, and cross-scans at 1.41 GHz were taken at Effelsberg two month earlier. These near-simultaneous observations show flat radio spectra. Further cross-scan measurements were taken at 4.85 and 10.45 GHz nine and eight month earlier, showing radio fluxes that are variable on timescales of months for all three sources.
We found 1.4 GHz flux measurements for the three brighter sources also in the NVSS catalog (Condon et al. 2002), for two of them at 325 MHz in the WENSS catalog (Rengelink et al. 1997), and at 5 GHz in the 87GB catalog (Gregory & Condon 1992).
All four sources are covered by our mapping of the Abell 2125 MAMBO field with the Spitzer Space Telescope, using the Multiband Imaging Photometer for Spitzer (MIPS) in photometry mode at 24 m (rms Jy) and the Infrared Array Camera (IRAC) at 3.6 m (rms Jy) and 5.8 m (rms Jy). Three of the sources are also covered by the IRAC 4.5 and 8.0 m (rms and 2.5 Jy) parallel observations. The basic calibrated data have been further reduced using the mopex software package. A median filter was applied to substract the background from the images. The source flux densities were measured by fitting a point response function that was determined from bright sources in the field. MMJ1540+6605, MMJ1541+6622 and MMJ1543+6621 were detected in all bands, while MMJ1541+6630 was not detected in any band.
Spectroscopic redshifts for MMJ1540+6605 and MMJ1541+6630 are not available. Miller et al. (2004) report that MMJ1541+6622 has a redshift of 1.382 based on the C III] and Mg II lines. These broad lines indicate that the object is a quasar.
A long slit spectrum of MMJ1543+6605 was obtained using Gemini-N and GMOS on June 30th, 2003 for a total exposure of 30 minutes. The B600 grating was used which produced a spectrum with about 3.3Å resolution. The spectrum shows one strong wide emission line (Fig. 5) with a number of associated pairs of absorption lines. This combination and the wavelength separation of the absorption doublets clearly indicates that the line is Mg II. The redshift we derive is 1.2362. Also the low level emission near 6600 Å is very consistent with the Fe II emission line complex at the same redshift.
We estimate a photometric redshift of 3 for MMJ1541+6630 (Fig. 3), using the correlation between the radio and FIR luminosities found in the local star-forming galaxies (Condon 1992; Carilli & Yun 1999, 2000).
We found X-ray counterparts for MMJ1540+6605, MMJ1541+6622 and MMJ1543+6621 in the ROSAT 1WGA catalog (White et al. 1994). MMJ1541+6630 is detected in a 20 ksec ROSAT PSPC observation. MMJ1540+6605 is detected in a 83 ksec archival Chandra observation (Fig. 6; Wang et al. (2004)). The 0.5-10 keV flux measured by Chandra is erg cm-2 s-1.
The offsets of all identifications to the VLA positions are less than the positional error quoted in the catalogs, except for the NVSS counterpart of MMJ1543+6621 and the ROSAT counterpart of MMJ1541+6630, for which the offsets are within the positional error.


| Source (J2000) | ||||||||||
|---|---|---|---|---|---|---|---|---|---|---|
| [mJy] | [mJy] | [mJy] | [mJy] | [mJy] | [mJy] | [mJy] | [mJy] | |||
| 154000.01+660551.6 | 24–26 | 5–41 | 21–28 | 261 | 12–19 | unclear | ||||
| 154137.19+663031.3 | 0.100.02 | 102 | 3 | |||||||
| 154141.01+662237.9 | 68–89 | 39–89 | 26–66 | 28–62 | 59–68 | 372 | 11–28 | 1.382 | ||
| 154321.31+662154.5 | 43–61 | 72–121 | 62–112 | 895 | 29–92 | 1.2362 |
Origin of the measurements: 0.3 GHz: VLA & Westerbork; 1.4 & 8 GHz: VLA, Effelsberg;
4.9 GHz: Effelsberg, VLA & Green Bank 300ft; 10 & 15 GHz: Effelsberg; 95 GHz: PdBI; 250 GHz: PdBI & MAMBO
The spectral index is defined as in
this paper.
| Source (J2000) | R | 0.1–2.4 keV | Hardness | ||||||
|---|---|---|---|---|---|---|---|---|---|
| [Jy] | [Jy] | [Jy] | [Jy] | [Jy] | [mag] | [erg cm-2 s-1] | [erg s-1] | ||
| 154000.01+660551.6 | 20.9 | ||||||||
| 154137.19+663031.3 | |||||||||
| 154141.01+662237.9 | 20.7 | ||||||||
| 154321.31+662154.5 | 19.3 |
Origin of the measurements: 24 m - 3.6 m: Spitzer MIPS & IRAC; R: KPNO; 0.1–2.4 keV: ROSAT PSPC
Hardness: ROSAT HR1 is defined as ()/() where
are the countrates in the 0.5–1.3, 1.5–2.1 and 0.1–0.3 keV bands.
For the luminosities we assumed , and
km s-1 Mpc-1. For MMJ1540+6605 we assumed a redshift
of 0.5, which is suggested by optical photometry.

3 Discussion
To quantify the significance of our source identifications, we calculated the corrected Poissonian probability, , of a chance association (Browne & Cohen 1978; Downes et al. 1986). For the identifications from the NVSS, WENSS and 87GB catalogs, %, so that the found counterparts correspond to the MAMBO sources with % confidence. For the ROSAT identifications the confidence is 93%, 83%, 98% and 99% for MMJ1540+6605, MMJ1541+6630, MMJ1541+6622, and MMJ1543+6621, respectively.
As the absorption of X-rays by hydrogen decreases with increasing photon energy, the hardness ratios can be used for rough estimates of the absorbing column densities. Three of the sources show absorption by cm-2, comparable to the galactic value of cm-2 toward the Abell 2125 field estimated from the Leiden/Dwingeloo survey (Hartmann & Burton 1997). For MMJ1540+6605 we estimate cm-2, which hints at intrinsic absorption.
3.1 MMJ1541+6630: A thermal source
MMJ1541+6630 has a faint 1.4 GHz radio counterpart with a flux density typical of the MAMBO or SCUBA galaxies. The 1.4 GHz flux density measurement and the upper limits at 4.9 and 8 GHz indicate a falling radio spectrum, consistent with a typical synchrotron spectrum with (). The ratio between the 1.4 and 250 GHz flux densities is consistent with a typical starburst galaxy SED at . No optical counterpart could be identified down to an R magnitude of 27.2, which is not unusual for even the brightest mm galaxies, e.g. MMJ120456-0741.5 (Dannerbauer et al. 2002, 2004). The standard interpretation of these data is that this object is a luminous high redshift starburst.
In starforming galaxies in which no AGN contributes significantly to the X-ray emission the radio and the FIR luminosity are also found to be well correlated with the X-ray luminosity (Ranalli 2004). The X-ray source close to the radio position of MMJ1541+6630 is detected at a low signal to noise ratio, making the position determination uncertain. The confidence of an association of the X-ray source and MMJ1541+6630 is 83%. In the following we assume that the ROSAT source is associated with MMJ1541+6630. The inferred X-ray luminosity is times higher than that expected from the correlations between X-ray, radio and mm luminosities for starforming galaxies. This X-ray excess reveals the presence of a radio-quiet AGN, which is also not unusual for (sub)mm galaxies: Alexander et al. (2004) suggest that % of the (sub)mm galaxies host AGN, which however contribute less then 20% to the IR bolometric luminosity. Following the classification scheme suggested by Hasinger (2003), the implied X-ray luminosity classifies MMJ1541+6630 as a quasar.
Taking the SED of the local ULIRG Arp 220, redshifted to , and fitting it to the mm and radio measurements of MMJ1541+6630 would yield flux densities in the Spitzer IRAC bands that are 3.5 to 20 times higher than the measured IRAC upper limits. A typical ULIRG SED with emission from hotter dust ( K) than that in Arp 220, located at higher redshifts than 3 would still match the radio and mm measurements (Blain 1999) but would yield lower flux densities in the IRAC bands. It could be that MMJ1541+6630 is therefore at .
Scaling the average SED for a radio-quiet quasar from Elvis et al. (1994) to match the observed X-ray flux, we would expect MMJ1541+6630 to have an R magnitude of 20.5, much brighter than what is observed. The expected flux densities in the Spitzer IRAC and MIPS 24 m bands would also exceed the measurements by an order of magnitude. Dust obscuration by magnitudes at m (rest frame) could explain the optical faintness. Assuming galactic dust properties this would translate to an . To match the flux densities observed in the Spitzer bands, with galactic dust properties needs to be of order , which is not atypical for starburst galaxies; e.g. in Arp 200 . Assuming a galactic gas to dust ratio of 150, would imply a hydrogen column density cm-2, which is about two orders of magnitude larger than the value inferred from the X-ray hardness. Due to the low signal to noise ratio of the ROSAT measurement, the X-ray inferred column density is uncertain by at least a factor of five. Another uncertainty arises from the high redshift, whereby the soft part of the X-ray spectrum, which is most affected by absorption, is shifted out of the ROSAT bandpass, so that much higher column densities would still be consistent with the observed hardness ratio (see e.g. Alexander et al. 2004). The difference in inferred column densities might also hint on different line of sights toward the starburst and the quasar.
Studies of quasars at mm wavelengths show almost no correlation between the optical emission of quasars and their mm emission (Omont et al. 2003, and references therein). Radio quiet quasars studied at cm and (sub)mm wavelengths show the same ratio of cm and (sub)mm inferred luminosities as known from starforming galaxies (Petric et al. in preparation; Beelen et al. in preparation). Besides this indirect evidence for a significant, if not dominant dust heating by a starburst in quasars, for the high redshift quasars PSS J2322+1944 (Carilli et al. 2003), SDSS J114816.64+525150.3 (Bertoldi et al. 2003) and the Cloverleaf (H1413+117, Weiß et al. 2003) a starburst could directly be identified as the dominant dust heating source. The Spitzer measurements of MMJ1541+6630 rule out a significant contribution to the dust heating by an AGN, except if this source were a heavily obscured quasar with moderate star forming activity.
With these uncertainties in mind, we find the properties of MMJ1541+6630 consistent with typical X-ray luminous (sub-)mm galaxies such as those studied by Alexander et al. (2004). In the following we shall assume that MMJ1541+6630 is a quasar with its FIR emission dominated by star formation.
For a dust temperature of 50 K and an emissivity index , typical for local starburst galaxies (Dunne & Eales 2001), at MMJ1541+6630 would have an infrared luminosity of L⊙, making it one of the most luminous starbursts known. It would be more luminous in the (sub)mm and X-rays than the type-1 quasar SMMJ04135 that was recently discovered in SCUBA blank fields (Knudsen et al. 2003), or the type-2 quasar SMMJ02399 (Ivison et al. 1998; Genzel et al. 2003). Note that the relation between 250 GHz flux density and infrared luminosity is nearly independent of redshift from to 10.
With a Salpeter initial mass function and a starburst age of Myr (Omont et al. 2001) the inferred star formation rate would be 4500 M⊙ yr-1. Such a high star formation rate would imply a very massive object. Adopting a dust emissivity cm2 g-1 (Hildebrand 1983) the inferred dust mass of MMJ1541+6630 is M⊙.
The likely detection of a massive starburst associated with a quasar adds to the growing evidence that the growth of central supermassive black holes and the formation of the first stellar populations are closely linked (e.g. Haehnelt & Kauffmann 2000, and references therein). Today we see the fossil records of this connection in the correlation between black hole and stellar bulge masses in local galaxies (Magorrian et al. 1998; Ferrarese & Merritt 2000; Gebhardt et al. 2000). Following Omont et al. (2001), for MMJ1541+6630 we estimated the ratio between star formation rate, , and black hole growth rate, , as well as the bulge to black hole mass ratio, . The former is estimated by relating the FIR luminosity to the bolometric luminosity arising from the quasar, which we calculate from the X-ray luminosity using the average radio-quiet quasar SED from Elvis et al. (1994). For the latter estimate we assume the dust properties mentioned above.
We find 3400. This is times higher than expected if black holes and stars formed simultaneously with the same ratio of bulge mass to black hole mass as observed in local galaxies. For SMMJ02399 we find 2200, still a factor of higher. For we find 1200 and for MMJ1541+6630 and SMMJ02399 respectively, a factor of above the value found in local galaxies. Given the uncertainties in our estimate and the scatter in for local galaxies, the estimated ratios are similar to those in local galaxies. Compared with the optically selected quasars of Omont et al. (2001), the bolometric luminosities of the (sub)mm selected quasars MMJ1541+6630 and SMMJ02399 appear to be dominated by the starburst activity.
3.2 Flat spectrum sources
The flat and time-variable radio to mm SEDs of the three brightest sources, their relatively bright optical counterparts and their high X-ray luminosities indicate that these sources are flat spectrum, radio loud quasars. The broad emission lines in the optical spectrum of MMJ1541+6622 also indicate that this source is a quasar. The Spitzer SEDs of MMJ1541+6622 and MMJ1543+6621 can well be fit with the average SEDs of radio loud quasars (Elvis et al. 1994) shifted to the spectroscopically measured redshifts. The 95 to 230 GHz spectral index measured with the PdBI also suggests a non-thermal spectrum, which is however steeper by –1 than the radio spectrum between 1 and 95 GHz. The fact that the radio spectrum is flat up to 95 GHz indicates that the steepening occurs very close to this frequency. A similar mm-break is also seen e.g. in 3 quasars selected from the 3C catalog (van Bemmel & Bertoldi 2001).
Flat spectrum radio sources (FSS) are well studied at radio wavelengths, but little is known about their SEDs at frequencies above 90 GHz and below the MIR. To see how the mm bright FSS relate to the radio selected FSS, we used the 90 GHz observations of Holdaway et al. (1994), as interpreted by the model of Holdaway & Owen (2005), to extrapolate the source counts up to 250 GHz. This model uses 90 GHz observations of flat spectrum quasars selected at cm wavelengths to sample the spectral index distribution of the sources’ compact cores from 8.4 GHz to 90 GHz. To push the model to frequencies above 90 GHz, Holdaway and Owen determined plausible distributions of turnover frequencies in these FSS, assuming the spectral index turns over to 0.8 above these frequencies.
The sampling of the spectral index distribution of the FSS population up to 90 GHz builds on the work of Patnaik et al. (1992), who selected sources with mJy and 1.4 to 5 GHz spectral index . The 1.4 GHz data (Condon & Broderick 1985, 1986) and the 5 GHz data (Condon et al. 1989) that defined their survey were taken with the NRAO 91 m telescope. Patnaik et al. (1992) observed their FSS sample with the VLA A array at 8.4 GHz. Holdaway et al. (1994) defined a subsample of Patnaik’s sample, selecting 367 sources with 8.4 GHz core fluxes ranging from 200 mJy to 35 Jy. Holdaway et al. (1994) observed these sources with the NRAO 12 m telescope. As the 8.4 GHz observations with 0.2 arcsecond resolution provided excellent core fluxes, and from 8.4 GHz to 90 GHz, the steep spectrum emission is decreased by a factor between 10 and 100, a good spectral index distribution for the FSS cores between 8.4 GHz and 90 GHz was obtained. No evidence was found for a spectral index distribution depending on core flux.
Condon (1984) presents source counts of FSS at 5 GHz, complete down to 10 mJy, from a variety of single dish observations. These counts, which included contributions from both a flat spectrum core and steep spectrum extended emission, were reduced by a mean core fraction of 0.8 and then scaled up to 90 GHz with the 8.4 GHz to 90 GHz spectral index distribution. To scale the FSS counts to other frequencies, we need a model for how the spectral index varies at higher frequency. Such a model is hinted at by the distribution of spectral index between 8.4 GHz and 90 GHz, which can be decomposed into two Gaussian components, indicating that 81% of the observed sources have “turned over” to a steep spectral index by 90 GHz, and 19% of the observed sources remain flat at 90 GHz. By combining the theoretical knowledge that flat spectrum quasars have a spectral index of about 0.0, and that steep spectrum, optically thin synchrotron emission has a spectral index of about 0.8, and by making reasonable assumptions on the spread about those spectral index values, Holdaway & Owen (2005) were able to solve for a distribution of turn over frequencies. This distribution of turn over frequencies can then be combined with the well-studied 5 GHz FSS counts and the core fraction correction to estimate the FSS counts at any frequency above 8.4 GHz.
One thing remains undetermined in this model: what happens to those 19% of still-flat spectrum sources above 90 GHz? An upper limit to source counts at 250 GHz can be obtained by assuming that these sources remain flat spectrum through 250 GHz. A lower limit can be obtained by assuming they all turn over right at 90 GHz. A “best guess” can be obtained by continuing the best fit power law distribution of turn over frequencies up to 181 GHz, at which point all of the remaining flat spectrum sources have turned over.

The extrapolated number counts are shown in Fig. 7, with no spectral steepening up to 250 GHz and with the “best guess” model for spectral steepening. The FSS source counts from the MAMBO fields are a factor of or higher than predicted from the extrapolation with and without steepening, respectively. Lensing amplification is unlikely to be a cause for the observed source overdensity since the four sources are far from the inner arcmin region of the galaxy cluster where mild lensing amplification could be expected. It could be that the number of FSS in the MAMBO field is high by chance. With Monte Carlo methods we simulated a field of 1000 square degrees with source counts that are consistent with the model and sources at random positions. We took 1600 independent small fields of the MAMBO survey size from the large simulation and analysed the distribution of source counts for the small fields. We found that less than 0.4% of these artificial fields contain three or more sources brighter than 10 mJy. This discrepancy might also be due to a deviation from the found spectral index distribution for sources below the 90 GHz detection limit of 75 mJy. Although the spectral index distribution was found not to depend on radio flux density, this is based on the brighter sources ( mJy) that were also detected at 90 GHz. It is possible that some fainter sources have flatter or more inverted spectra and thus contribute noticeably to the mm number counts.
The four sources are among the first quasars to be discovered in mm or submm blank field surveys. Although based on small number statistics, they allow a first study of the contribution of non-thermal sources in (sub)mm observations. Figure 7 shows the cumulative source counts for the MAMBO and SCUBA deep field surveys. We have fitted the counts with a model of a population of dust enshrouded starburst galaxies. The model is based on the Saunders 60 m luminosity function of local galaxies (Saunders et al. 1990) which consists of a flat power law for low luminosities and a steep power law for luminosities above L⊙. An additional exponential cutoff at L⊙, and a luminosity and density evolution with redshift were applied to match the (sub)mm number counts and their redshift distribution. The model was found to be consistent with the SED of the extragalactic FIR background. Including MMJ1541+6630 in the number counts, we find that they are in good agreement with the extrapolation of the fainter source counts. The three brightest sources however indicate a flattening in the source counts at 250 GHz flux densities mJy. The mm background appears to change from a declining population of high redshift starbursts to a shallower distribution of less distant, radio loud quasars.
Acknowledgements.
We thank Jürgen Kerp from RAIUB and Thomas Boller from MPE Garching for their help with the ROSAT data and Matthias Kadler from the MPIfR for his help with the Chandra data. We thank Endrik Krügel from MPIfR for his useful comments on optical dust properties, Emmanouil Angelakis and Alex Kraus from the MPIfR for their help on Effelsberg observations, and the IRAM staff for their great support of this project. CC acknowledges support from the Max-Planck-Forschungspreis, granted by the Alexander von Humboldt Foundation and the Max-Planck Society. HV is member of the International Max Planck Research School (IMPRS) for Radio and Infrared Astronomy. This research has made use of the NASA/IPAC Extragalactic Database (NED) which is operated by the Jet Propulsion Laboratory, California Institute of Technology, under contract with the NASA, and of data obtained through the High Energy Astrophysics Science Archive Research Center Online Service, provided by the NASA/Goddard Space Flight Center.References
- Alexander et al. (2004) Alexander, D. M., Bauer, F. E., Chapman, S. C., et al. 2004, arXiv:astro-ph/0401129
- Barger et al. (1998) Barger, A. J., Cowie, L. L., Sanders, D. B., et al. 1998, Nature, 394, 248
- Bertoldi et al. (2000) Bertoldi, F., Carilli, C. L., Menten, K. M., et al. 2000, A&A, 360, 92
- Bertoldi et al. (2003) Bertoldi, F., Cox, P., Neri, R., et al. 2003, A&A, 409, L47
- Bertoldi et al. (2002) Bertoldi, F., Menten, K. M., Kreysa, E., Carilli, C. L., & Owen, F. 2002, Highlights in Astronomy, 12, 473
- Blain (1999) Blain, A. W. 1999, MNRAS, 309, 955
- Blain et al. (2002) Blain, A. W., Smail, I., Ivison, R. J., Kneib, J.-P., & Frayer, D. T. 2002, Phys. Rep., 369, 111
- Browne & Cohen (1978) Browne, I. W. A. & Cohen, A. M. 1978, MNRAS, 182, 181
- Carilli et al. (2003) Carilli, C. L., Lewis, G. F., Djorgovski, S. G., et al. 2003, Science, 300, 773
- Carilli & Yun (1999) Carilli, C. L. & Yun, M. S. 1999, ApJ, 513, L13
- Carilli & Yun (2000) Carilli, C. L. & Yun, M. S. 2000, ApJ, 530, 618
- Chapman et al. (2005) Chapman, S. C., Blain, A. W., Smail, I., & Ivison, R. J. 2005, ApJ, 622, 772
- Condon (1984) Condon, J. J. 1984, ApJ, 287, 461
- Condon (1992) Condon, J. J. 1992, ARA&A, 30, 575
- Condon & Broderick (1985) Condon, J. J. & Broderick, J. J. 1985, AJ, 90, 2540
- Condon & Broderick (1986) Condon, J. J. & Broderick, J. J. 1986, AJ, 91, 1051
- Condon et al. (1989) Condon, J. J., Broderick, J. J., & Seielstad, G. A. 1989, AJ, 97, 1064
- Condon et al. (2002) Condon, J. J., Cotton, W. D., Greisen, E. W., et al. 2002, VizieR Online Data Catalog, 8065, 0
- Dannerbauer et al. (2002) Dannerbauer, H., Lehnert, M. D., Lutz, D., et al. 2002, ApJ, 573, 473
- Dannerbauer et al. (2004) Dannerbauer, H., Lehnert, M. D., Lutz, D., et al. 2004, ApJ, 606, 664
- Downes et al. (1986) Downes, A. J. B., Peacock, J. A., Savage, A., & Carrie, D. R. 1986, MNRAS, 218, 31
- Dunne & Eales (2001) Dunne, L. & Eales, S. A. 2001, MNRAS, 327, 697
- Eales et al. (2003) Eales, S., Bertoldi, F., Ivison, R., et al. 2003, MNRAS, 344, 169
- Elvis et al. (1994) Elvis, M., Wilkes, B. J., McDowell, J. C., et al. 1994, ApJS, 95, 1
- Ferrarese & Merritt (2000) Ferrarese, L. & Merritt, D. 2000, ApJ, 539, L9
- Gebhardt et al. (2000) Gebhardt, K., Bender, R., Bower, G., et al. 2000, ApJ, 539, L13
- Genzel et al. (2003) Genzel, R., Baker, A. J., Tacconi, L. J., et al. 2003, ApJ, 584, 633
- Gregory & Condon (1992) Gregory, P. C. & Condon, J. J. 1992, VizieR Online Data Catalog, 8014, 0
- Greve et al. (2005) Greve, T. R., Bertoldi, F., Smail, I., et al. 2005, MNRAS, 359, 1165
- Greve et al. (2004) Greve, T. R., Ivison, R. J., Bertoldi, F., et al. 2004, MNRAS, 354, 779
- Haehnelt & Kauffmann (2000) Haehnelt, M. G. & Kauffmann, G. 2000, MNRAS, 318, L35
- Hartmann & Burton (1997) Hartmann, D. & Burton, W. B. 1997, Atlas of galactic neutral hydrogen (Cambridge; New York: Cambridge University Press, ISBN 0521471117)
- Hasinger (2003) Hasinger, G. 2003, arXiv:astro-ph/0310804
- Hildebrand (1983) Hildebrand, R. H. 1983, QJRAS, 24, 267+
- Holdaway & Owen (2005) Holdaway, M. A. & Owen, F. N. 2005, ALMA memo, 520
- Holdaway et al. (1994) Holdaway, M. A., Owen, F. N., & Rupen, M. P. 1994, MMA memo, 123
- Hughes et al. (1998) Hughes, D. H., Serjeant, S., Dunlop, J., et al. 1998, Nature, 394, 241
- Ivison et al. (1998) Ivison, R. J., Smail, I., Le Borgne, J.-F., et al. 1998, MNRAS, 298, 583
- Knudsen et al. (2003) Knudsen, K. K., van der Werf, P. P., & Jaffe, W. 2003, A&A, 411, 343
- Kreysa et al. (1998) Kreysa, E., Gemuend, H., Gromke, J., et al. 1998, in Proc. SPIE Vol. 3357, p. 319-325, Advanced Technology MMW, Radio, and Terahertz Telescopes, Thomas G. Phillips; Ed., 319–325
- Kreysa et al. (2002) Kreysa, E., Gemünd, H.-P., Raccanelli, A., Reichertz, L. A., & Siringo, G. 2002, in AIP Conf. Proc. 616: Experimental Cosmology at Millimetre Wavelengths, 262–269
- Magorrian et al. (1998) Magorrian, J., Tremaine, S., Richstone, D., et al. 1998, AJ, 115, 2285
- Miller et al. (2004) Miller, N. A., Owen, F. N., Hill, J. M., et al. 2004, ApJ, 613, 841
- Neri et al. (2003) Neri, R., Genzel, R., Ivison, R. J., et al. 2003, ApJ, 597, L113
- Omont et al. (2003) Omont, A., Beelen, A., Bertoldi, F., et al. 2003, A&A, 398, 857
- Omont et al. (2001) Omont, A., Cox, P., Bertoldi, F., et al. 2001, A&A, 374, 371
- Owen et al. (2005a) Owen, F. N., Keel, W. C., Ledlow, M. J., Morrison, G. E., & Windhorst, R. A. 2005a, AJ, 129, 26
- Owen et al. (2005b) Owen, F. N., Keel, W. C., Wang, Q. D., Ledlow, M. J., & Morrison, G. E. 2005b, in preperation
- Owen et al. (1999) Owen, F. N., Ledlow, M. J., Keel, W. C., & Morrison, G. E. 1999, AJ, 118, 633
- Patnaik et al. (1992) Patnaik, A. R., Browne, I. W. A., Wilkinson, P. N., & Wrobel, J. M. 1992, MNRAS, 254, 655
- Puget et al. (1996) Puget, J.-L., Abergel, A., Bernard, J.-P., et al. 1996, A&A, 308, L5+
- Ranalli (2004) Ranalli, P. 2004, arXiv:astro-ph/0407140
- Rengelink et al. (1997) Rengelink, R. B., Tang, Y., de Bruyn, A. G., et al. 1997, A&AS, 124, 259
- Saunders et al. (1990) Saunders, W., Rowan-Robinson, M., Lawrence, A., et al. 1990, MNRAS, 242, 318
- Smail et al. (1997) Smail, I., Ivison, R. J., & Blain, A. W. 1997, ApJ, 490, L5+
- van Bemmel & Bertoldi (2001) van Bemmel, I. M. & Bertoldi, F. 2001, A&A, 368, 414
- Wang et al. (2004) Wang, Q. D., Owen, F., & Ledlow, M. 2004, ApJ, 611, 821
- Weiß et al. (2003) Weiß, A., Henkel, C., Downes, D., & Walter, F. 2003, A&A, 409, L41
- White et al. (1994) White, N. E., Giommi, P., & Angelini, L. 1994, Bulletin of the American Astronomical Society, 26, 1372