AGN Feedback Causes Downsizing
Abstract
We study the impact of outflows driven by active galactic nuclei (AGN) on galaxy formation. Outflows move into the surrounding intergalactic medium (IGM) and heat it sufficiently to prevent it from condensing onto galaxies. In the dense, high-redshift IGM, such feedback requires highly energetic outflows, driven by a large AGN. However, in the more tenuous low-redshift IGM, equivalently strong feedback can be achieved by less energetic winds (and thus smaller galaxies). Using a simple analytic model, we show that this leads to the anti-hierarchical quenching of star-formation in large galaxies, consistent with current observations. At redshifts prior to the formation of large AGN, galaxy formation is hierarchical and follows the growth of dark-matter halos. The transition between the two regimes lies at the peak of AGN activity.
Subject headings:
galaxies: evolution – quasars: general1. Introduction
Downsizing is not a recent trend. For the past 10 billion years, the characteristic stellar mass of forming galaxies has been decreasing, as demonstrated by a variety of observations. Space-based near-ultraviolet (NUV) measurements show that the typical star-formation rate in galaxies was over an order of magnitude higher at than at (Arnouts et al. 2005). Ground-based optical and near-infrared (NIR) searches indicate that the largest galaxies were already in place by while smaller ones continued to form stars at much lower redshifts (Fontana et al. 2004; Glazebrook et al. 2004; van Dokkum 2004; Treu et al. 2005). And both optical and X-ray surveys detect a steady decrease in the characteristic luminosity of active galactic nuclei (AGN) below (Pei 1995; Ueda et al. 2003), which is likely to parallel the formation history of early-type galaxies (e.g. Granato et al. 2001).
Yet despite such widespread evidence, galaxy downsizing (Cowie et al. 1996) was unexpected. The Cold Dark Matter (CDM) model, while in spectacular agreement with observations (e.g. Spergel et al. 2003), is a hierarchical theory, in which gravitationally-bound subunits merge and accrete mass to form ever-larger objects. Superimposed on this DM distribution is the observed baryonic component. In canonical models, this gas falls into potential wells, is shocked heated to the viral temperature, and must radiate this energy away before forming stars (Rees & Ostriker 1977; Silk 1977). The larger the structure, the higher its virial temperature, and the longer it takes to cool. Also, in most semi-analytical models, the dynamical time-scale is adopted for the rate of star formation via the Schmidt-Kennicutt law, and this time-scale increases systematically with halo mass. Thus larger galaxies were expected to form later not only because they occur in later-forming dark matter halos, but because the cooling and star formation times within such halos are longer.
Two recent lines of inquiry have modified this picture. Theoretically, simulations have shown that cooling is greatly enhanced by gas inhomogeneities, allowing galaxies to form with stellar masses over ten times larger than observed (Suginohara & Ostriker 1998; Davé et al. 2001). In fact, virializing shocks may even be completely absent in smaller halos (Birnboim & Dekel 2003). Observationally, it has been discovered that the main heating source for groups and small galaxy clusters is nongravitational (e.g. Arnaud & Evrard 1999). As these are the gaseous halos that were slightly too massive to form into galaxies, the clear implication is that nongravitational heating also played a key role in the history of large galaxies.
Furthermore, the keV per gas particle necessary to preheat the intracluster medium (ICM) appears to exceed the energy available from supernovae (e.g. Valageas & Silk 1999; Wu et al. 2000; Kravtsov & Yepes 2002). At the same time, active galactic nuclei (AGN) are observed to host high-velocity outflows with kinetic luminosities that may equal a significant fraction of their bolometric luminosity (e.g. Chartas 2002; Pounds et al. 2003; Morganti 2005; see however Sun et al. 2005). Such outflows would naturally preheat the ICM to the necessary levels (Roychowdhury et al. 2004; Lapi et al. 2005), placing this gas at an entropy at which it can never cool within a Hubble time (Voit & Brian 2001; Oh & Benson 2003). This results in a feedback-regulated picture of galaxy formation fundamentally different from the canonical approach (Scannapieco & Oh 2004; Binney 2004; Di Matteo et al. 2005).
In this letter, we explore the connection between this developing picture and the widespread observations of downsizing, structuring our investigation as follows: In §2 we develop a simple cooling model for galaxy formation, which illustrates how hierarchical formation naturally arises in the canonical approach. In §3 we modify our model to include AGN feedback, and show how this leads to a radically different, anti-hierarchical history. We compare these results with recent observations and conclude with a short discussion in §4.
2. A Cooling-Regulated Model of Galaxy Formation
Throughout this study, we assume a CDM model with parameters , = 0.3, = 0.7, , , and , where is the Hubble constant in units of 100 km s-1 Mpc-1, , , and are the total matter, vacuum energy, and baryonic densities in units of the critical density, is the variance of linear fluctuations on the scale, and is the “tilt” of the primordial power spectrum (e.g. Spergel et al. 2003). The Eisenstein & Hu (1999) transfer function is adopted in all cases.
We begin with a model of cooling-regulated galaxy formation and adopt as simple an approach as possible, to highlight the key physical issues. Unlike more sophisticated approaches (e.g. Kauffmann et al. 1993; Somerville & Primack 1999; Benson et al. 2000), we do not attempt to trace the detailed history of a sample of DM halos through the use of statistical “merger trees.” Instead, we use the fit described in van den Bosch (2002), which gives the average history of a DM halo with a present total mass of as
| (1) |
where , is the mass of this system at some redshift , and is defined implicitly through the relation with being the linear growth factor and being the variance of linear fluctuations within a sphere enclosing a total mass
Following the canonical picture, we assume that at each redshift gas flows onto the growing halo along with the dark matter, is shocked to its virial density and temperature at that redshift [ times the mean density and K, respectively], and is finally added to the pool of cold gas that forms stars after a delay of
| (2) |
Here is the average number of electrons per cm3 in the shocked gas, is a “clumping factor,” which accounts for inhomogeneities, is the temperature in units of K, and is the radiative cooling rate of the gas in units of ergs cm3 s Near 1 keV K, is roughly a constant but in general it is a function of temperature and metallicity. For simplicity we adopt the Sutherland & Dopita (1993) equilibrium values for this rate at a fixed metallicity of the level of pre-enrichment of G dwarf stars in the solar neighborhood (Ostriker & Thuan 1975) and in large neighboring galaxies (Thomas et al. 1999). Finally in keeping with previous semianalytical models, we ignore gas inhomogeneities, taking . Adopting a larger value, consistent with simulations, would result in the same overall trends, but with galaxies that were much too large.
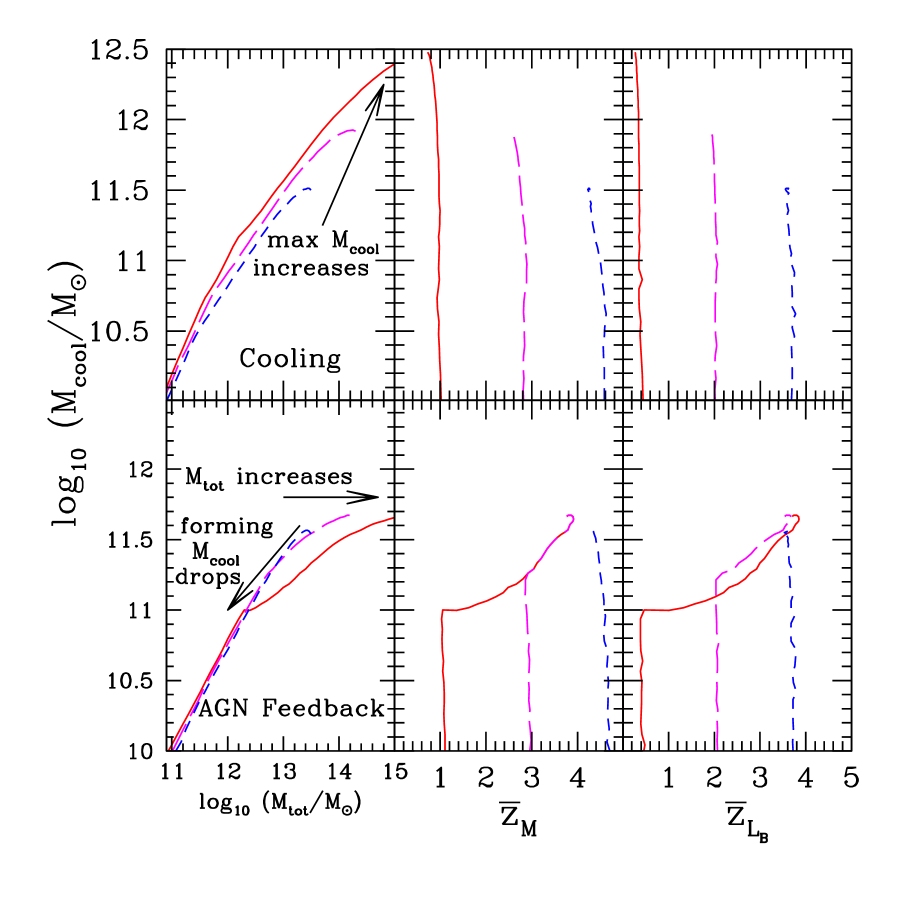
We then compute the mass of cooled gas as a function of the total mass and redshift of observation, as illustrated in Figure 1. Here we see the classic behavior first described in Rees & Ostriker (1977) and Silk (1977). As their cooling times are short, in small objects, while for larger masses with longer cooling times In this picture the maximum is the largest gas mass that has time to virialize and cool, a value that increases with time. Roughly one can estimate this scaling as where and are the final time and redshift at which the gas cools while is computed at the initial redshift at which the gas falls on the halo. For the accretion histories described by eq. (1), depends only weakly on redshift, which allows us to rewrite this as
In Figure 1 we also compute the average redshift of formation of the resulting stars, adopting both a mass average, that is where
| (3) |
and a -band luminosity-weighted average, that is where
| (4) |
and is the -band mass to light ratio of a population of stars with an age assuming a Salpeter initial mass function as computed by Bruzual & Charlot (2003). In all cases and are very close to the observed redshifts, meaning that in objects of all masses and redshifts, most of the stellar mass and luminosity comes from recently-formed stars.
3. A Feedback-Regulated Model of Galaxy Formation
We now modify our model to include AGN feedback, adopting an approach that parallels Scannapieco & Oh (2004), itself an extension of Wyithe & Loeb (2003). These papers showed that imposing an relationship between black-hole mass and halo circular velocity (Ferrarese 2002) and assuming that these objects shine at their Eddington luminosity for a fraction of the dynamical time after each major merger gives a good fit to the observed AGN luminosity function. In particular, each merger with a mass ratio less than 4:1 was associated with an AGN with a total bolometric energy (in units of ergs) of
| (5) |
where is the mass of cooled gas in units of
Each AGN was then taken to host an outflow, with a total kinetic energy equal to of the total bolometric energy. Adopting a Sedov-Taylor model this resulted in a postshock temperature of where is the total gas mass contained with a radius in units of Our simple model here does not distinguish between merger events, and so instead we relate the change in temperature at a radius to the change in cooled mass by replacing with
| (6) |
Apart from this additional contribution to the temperature, our model exactly parallels that in §2, with two minor modifications. First, if a parcel of gas remains at a temperature above the final virial temperature of the halo for a time longer than its dynamical time, we assume it escapes from the gravitational potential. Secondly, we choose the clumping factor to be consistent with simulations, which show that roughly 40% of the gas cools onto galaxies by in the absence of feedback (Davé 2001; Balogh et al. 2001). This requires us to raise (without feedback) by a factor 30, which corresponds to
With these modifications, and adopting a fiducial value of , we constructed plots of and as in §2. These are shown in the lower panels of Figure 1. As in our cooling model, in small halos, where feedback is weak. At large masses, however, feedback causes to evolve radically differently. Now the maximum scale of star-forming galaxies drops at lower redshifts. This is the direct result of the decrease in the cosmological gas density and the fact that at lower redshifts smaller AGNs (and hence smaller galaxies) can heat this gas to temperatures that will not cool within a dynamical time. The scaling of this “quenching threshhold” (Faber et al. 2005) can be estimated by setting the dynamical time equal to the post-AGN feedback cooling time given by eqs. (2) & (5). For the keV objects we are interested in this gives .
Galaxies with the largest values () are already in place at and continue to fall into larger halos at lower without increasing in stellar mass. Somewhat smaller galaxies can recover from an AGN outflow at , but not at the lowest redshifts. Finally galaxies with have can hold onto their gas, even at Note, however, that our simple models do not include supernova feedback, which is likely to be important in galaxies with (Martin 1999). This mechanism should behave qualitatively differently, as it depends primarily on momentum transfer rather than heating (Thacker et al. 2002). Note also that we do not account for the possibility of initial positive AGN feedback before quenching occurs, as may be required by observations of efficient star formation in massive high-redshift galaxies (Silk 2005).
The anti-hierarchical trend in our model is also apparent from the mass and -band luminosity-weighted ages. In small galaxies, most of the stars are relatively young and were formed at redshifts close to the redshifts of observation. Stars in large galaxies, however, are much older, and their ages increase as a function of .
4. Comparison with Observations and Discussion
The features of the simple models developed in §2 and §3 can be directly compared with observations. As a measure of the typical star formation rate, we compute the absolute AB magnitude at 1500 Å for our model galaxies, assuming that of the cooled gas is in the form of stars, adopting the Bruzual & Charlot (2003) population synthesis models, and ignoring dust. We do not attempt to construct a luminosity function of galaxies, since doing so would require us to use a full merger-tree formalism. Rather, for both cooling and AGN feedback models, we impose a halo mass limit of at each redshift, to exclude excessively rare peaks. For the CDM power spectrum at these redshifts, , such that the corresponding virial temperature
| Model | Characteristic | Characteristic | Characteristic | Trends |
|---|---|---|---|---|
| at high- | at low- | SFR at low- | ||
| Cooling | Tracks | Cooling-regulated | Bigger galaxies are | |
| roughly constant | young and blue | |||
| AGN | Tracks | Feedback-regulated | Bigger galaxies are | |
| Feedback | older and redder |
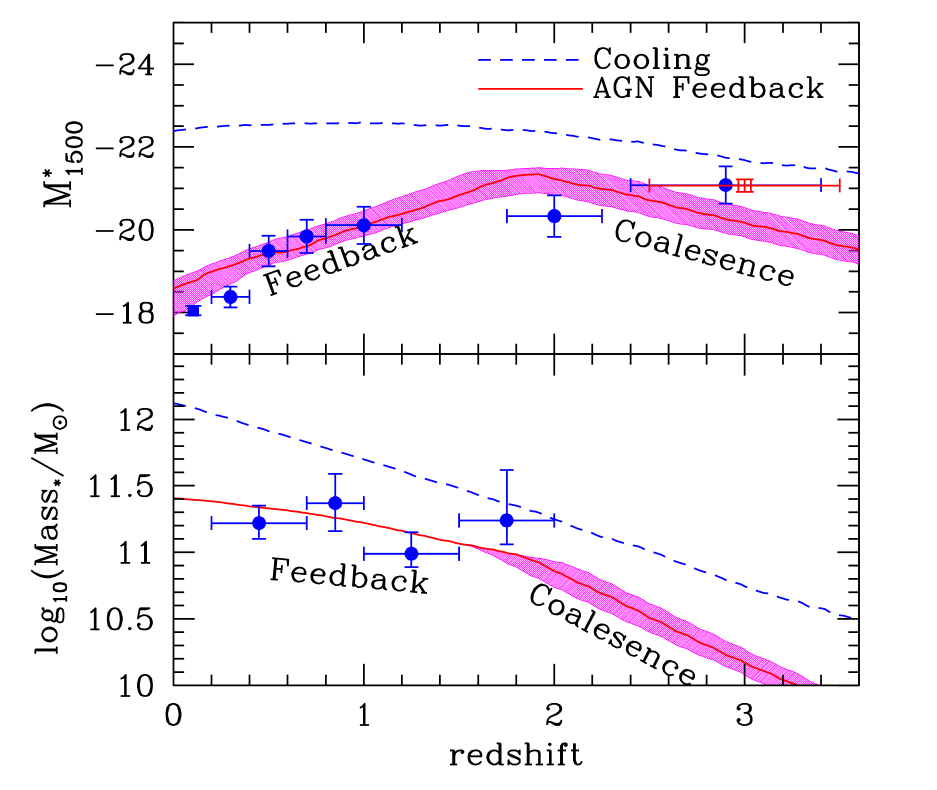
We then find the most luminous galaxy at 1500 Å within the remaining halos, and plot its absolute magnitude as a function of redshift in the upper panel of Figure 2. This is compared with the observed evolution of to which is divided into two regions. At high redshift, it brightens along with the nonlinear mass scale over the dynamical time. At low redshift, the most luminous galaxies no longer lie in the largest halos. Rather fades along with the AGN quenching mass scale over The redshift at which these two scales cross marks a distinct transition between hierarchical and anti-hierarchical growth, which occurs at the peak of AGN activity (e.g. Pei 1995; Ueda et al. 2003).
The shaded regions in this figure show the impact of varying which shifts the peak value of Modifying our other assumptions (, cold fraction in stars, etc.) would result in similar changes. In particular, dust would cause to saturate at due to the larger attenuation factors of large starbursts (e.g. Wang & Heckman 1996; Adelberger & Steidel 2000; Martin et al. 2005). Our point is not to fit these particular parameters to the data, howevever, but rather that substantial high-redshift brightening and lower-redshift fading of are general and unavoidable features of AGN-regulated galaxy formation.
Coincidentally, this sharp peak in is now starting to be seen observationally. Whereas it has been known for several years that brightens monotonically from to in the UV and bluer optical bands (e.g. Gabasch et al. 2004; Arnouts et al. 2005), recent measurements at (Ouchi et al. 2004; Bouwens et al. 2005) now also show a downturn relative to lower redshifts, implying that is most luminous around . Remarkably, this is very close to the peak in AGN activity, suggesting that represents the key epoch for gas accretion onto massive systems.
Turning our attention to the evolution of the maximum stellar mass, as shown in the bottom panels, similar trends are apparent. While the maximum mass in the cooling model increases monotonically, the AGN feedback model is divided into two regions: one at high redshift in which the maximum stellar mass increases along with the nonlinear mass scale, and one at low redshift in which the maximum stellar mass stays fixed as the scale at which new galaxies are forming becomes smaller. The general properties of cooling and AGN feedback models are summarized in Table 1.
Finally, we point out that not only the temporal, but the spatial distribution of AGN in our feedback model is suggestive of recent observations. Using over 20,000 galaxies from the 2dF QSO Redshift Survey, Croom et al. (2005) have studied the spatial clustering of QSOs near the characteristic scale in the optical luminosity function. They measure bias values which, when converted into values using standard expressions (Mo & White 1996), evolve from at down to at The characteristic scale of low-redshift AGN is downsizing from the rarest to the most common objects, spreading the heated gas that extinguishes the formation of galaxies to this day.
References
- (1)
- (2) Adelberger, K. L., & Steidel, C. C. 2000, ApJ, 544, 218
- (3) Arnaud, A., & Evrard, A. E. 1999, MNRAS, 305, 631
- (4) Arnouts, S. et al. 2005, ApJ, 619, L43
- (5) Balough, M. L., Pearce, F. R., Bower, R. G., & Kay, S. T. 2001, MNRAS, 326, 1228
- (6) Benson, A J., Cole, S., Frenk, C. S., Baugh, C. M., & Lacey, C. G. 2000, MNRAS, 311, 793
- (7) Binney, J. 2004, MNRAS, 347, 1093
- (8) Birnboim, Y., & Dekel, A. 2003, MNRAS, 345, 349
- (9) Bouwens, R. J., Illingworth, G.D., Blakeslee, J.P., & Franx, M. 2005, ApJ, in press (astro-ph/0509641)
- (10) Bruzual, G. & Charlot. S. 2003, MNRAS, 344, 1000
- (11) Chartas, G., Brandt, W. N., Gallagher, S. C. & Garmire, G. P. 2002, ApJ, 569, 179
- (12) Cowie, L. L., Songaila, A., Hu, E. M., & Cohen, J. G. 1996, ApJ, 112, 839
- (13) Croom et al. 2005, MNRAS, 356, 415
- (14) Davé et al. 2001, ApJ, 552, 473
- (15) Di Matteo, T., Springel, V., & Hernquist, L. 2005, Nature, 433, 604
- (16) Eisenstein, D. J. & Hu, W. 1999, ApJ, 511, 5
- (17) Faber, S. M. et al. 2005, ApJ, submitted (astro-ph/0506044)
- (18) Ferrarese, L. 2002, ApJ, 578, 90
- (19) Fontana, A. et al. 2004, A&A, 424, 23
- (20) Gabasch, A. et al. 2004, A&A, 421, 41
- (21) Granato, G. L. et al. 2001, MNRAS, 324, 757
- (22) Glazebrook, K. et al. 2004, Nature, 430, 181
- (23) Kauffmann, G., White, S. D. M., & Guiderdoni, B. 1993, 264, 201
- (24) Kravtsov, A. V., & Yepes, G. 2000, MNRAS, 318, 227
- (25) Lapi, A., Cavaliere, A., & Menci, N. 2005, ApJ, 619, 60
- (26) Martin, C. D., et al. 2005, ApJ, 619, 1
- (27) Martin, C. L. 1999, ApJ, 513, 156
- (28) Mo, H. J., & White, S. D. M. 1996, MNRAS, 283, 347
- (29) Morganti, R., Tadhunter, C. N., & Oosterloo, T. A. 2005, A&A, in press (astro-ph/0510263)
- (30) Oh, S. P., & Benson, A. 2003, MNRAS, 342, 664
- (31) Ouchi, M., et al. 2004, ApJ, 611, 660.
- (32) Pei, Y. C. 1995, ApJ, 438, 623
- (33) Perlmutter, S. et al. 1999, ApJ, 517, 565
- (34) Pounds, K., King, A. R., Page., K. L., O’Brien, P. T. 2003, MNRAS, 346, 1025
- (35) Rees, M. J., & Ostriker, J. P. 1977, MNRAS, 179, 541
- (36) Roychowdhury, S., Ruszkowski, M., Nath, B. B., & Begelman, M. C. 2004, ApJ, 615, 681
- (37) Scannapieco, E., & Oh, S.P. 2004, 608, 62
- (38) Silk, J. 1977, ApJ, 211, 638
- (39) Silk, J. 2005, MNRAS, in press (astro-ph/0509149)
- (40) Somerville, R. S. & Primack, J. R. 1999, MNRAS, 301, 1087
- (41) Spergel, D. N. et al. 2003, ApJS, 14, 175
- (42) Steidel, C. C., Adelberger, K. L., Giavalisco, M., Dickinson, M., & Pettini, M. 1999, ApJ, 519, 1
- (43) Suginohara, T., & Ostriker, J. P. 1998, ApJ, 507, 16
- (44) Sun, M., Jerius, D., & Jones, C. 2005, ApJ, in press (astro-ph/0501501)
- (45) Sutherland, R. S., & Dopita, M. A. 1993, ApJS, 88, 253
- (46) Ostriker, J. P., & Thuan, T. X. 1975, ApJ 202, 353
- (47) Thacker, R. J., Scannapieco, E., & Davis, M. 2002, ApJ, 581, 836
- (48) Thomas, D., Greggio, L., & Bender, R. 1999, MNRAS, 281, 323
- (49) Treu, T., Ellis, R. S., Liao, T. X., & van Dokkum, P. G. 2005, ApJ, 622, L5
- (50) Ueda, Y., Akiyama, M., Ohta, K., & Miyaji, T. 2003, ApJ, 598, 886
- (51) van den Bosch, F. C. 2002, MNRAS, 331, 98
- (52) van Dokkum et al. 2004, ApJ, 611, 703
- (53) Valageas, P., & Silk, J. 1999, A&A, 350 725
- (54) Voit, M., & Brian, G. 2001, 2001, Nature, 414, 425
- (55) Wang, B, & Heckman, T. M. 1996, 457, 645
- (56) Wu, K. K. S., Fabian, A., & Nulsen, P. E. J. 2000, MNRAS, 318, 889
- (57) Wyithe, J. S. B., & Loeb, A. 2003, ApJ, 595, 614
- (58)