FUSE and HST/STIS far-ultraviolet observations of AM Herculis in an extended low state11affiliation: Based on observations made with the NASA/ESA Hubble Space Telescope, obtained at the Space Telescope Science Institute, which is operated by the Association of Universities for Research in Astronomy, Inc., under NASA contract NAS 5-26555, and on observations made with the NASA-CNES-CSA Far Ultraviolet Spectroscopic Explorer. FUSE is operated for NASA by the Johns Hopkins University under NASA contract NAS5-32985.
Abstract
We have obtained FUSE and HST/STIS time-resolved spectroscopy of the polar AM Herculis during a deep low state. The spectra are entirely dominated by the emission of the white dwarf. Both the far-ultraviolet (FUV) flux as well as the spectral shape vary substantially over the orbital period, with maximum flux occurring at the same phase as during the high state. The variations are due to the presence of a hot spot on the white dwarf, which we model quantitatively. The white dwarf parameters can be determined from a spectral fit to the faint phase data, when the hot spot is self-eclipsed. Adopting the distance of pc determined by Thorstensen, we find an effective temperature of K and a mass of . The hot spot has a lower temperature than during the high state, K, but covers a similar area, % of the white dwarf surface. Low state FUSE and STIS spectra taken during four different epochs in 2002/3 show no variation of the FUV flux level or spectral shape, implying that the white dwarf temperature and the hot spot temperature, size, and location do not depend on the amount of time the system has spent in the low state. Possible explanations are ongoing accretion at a low level, or deep heating – both alternatives have some weaknesses that we discuss. No photospheric metal absorption lines are detected in the FUSE and STIS spectra, suggesting that the average metal abundances in the white dwarf atmosphere are lower than times their solar values.
Subject headings:
stars: individual (AM Her) – line: formation – white dwarfs – novae, cataclysmic variables1. Introduction
Polars, also known as AM Herculis stars, are a class of cataclysmic variables which contain a magnetic white dwarf with MG. The strong magnetic field suppresses the formation of an accretion disk, and channels the accreting material to small regions near one or both of the white dwarfs magnetic poles. The accreting material reaches the white dwarf with supersonic velocities, is decelerated and heated in a shock and subsequently cools through the emission of thermal X-rays and/or cyclotron radiation. Early models (Lamb & Masters, 1979; King & Lasota, 1979) suggested that the shock would stand above the white dwarf surface, and that roughly half of the post-shock emission would be intercepted by the white dwarf surface, heating a more or less extended region below and around the shock to a few K. The prediction of these models was that the reprocessed radiation will be observed in the soft X-ray band, and that the luminosity of this reprocessed component should be roughly equal to the sum of the observed luminosities in thermal bremsstrahlung and cyclotron radiation. Observationally, polars show a wide range of hard to soft X-ray luminosity ratios, and some show a substantial excess of soft X-ray emission compared to the predictions of the simple reprocessing model (see Beuermann & Burwitz 1995; Ramsay et al. 1994, 1996; Ramsay & Cropper 2004 for references and discussion). Detailed hydrodynamic models show that the exact energy balance of the stand-off shock depends on the magnetic field strength and the mass flow rate (Fischer & Beuermann, 2001), largely explaining the deficiencies of the early models. In the case of very high mass flow rates, the shock may also be submerged in the white dwarf photosphere, where the primary thermal bremsstrahlung is directly reprocessed into soft X-ray emission, and hence hard X-rays are not observed at all (Kuijpers & Pringle, 1982).
A flaw in the initial reprocessing model was that, depending on the shock height, the post-shock radiation may reach a fairly large area on the white dwarf – especially so the cyclotron radiation which is significantly beamed perpendicular to the magnetic field lines. Distributing the post-shock radiation over a larger area would result in a lower temperature in the heated region, shifting the peak of the reprocessed emission to longer wavelengths. International Ultraviolet Explorer (IUE) ultraviolet observations of the bright prototype AM Herculis revealed the presence of a rather large moderately hot region on the white dwarf, first noticed by Heise & Verbunt (1988). Phase-resolved IUE observations of AM Her showed a quasi-sinusoidal flux modulation which Gänsicke et al. (1995) explained by the presence of a hot spot covering % of the white dwarf surface, located near the accreting magnetic pole. Comparing the luminosity of this pole cap, Gänsicke et al. (1995) suggested that the original reprocessing model may be valid in AM Her, but that the reprocessed component is emitted in the ultraviolet (UV) rather than in soft X-rays.
A Hubble Space Telescope (HST)/GHRS study of AM Her in the high state confirmed the earlier IUE results and established a much better constraint on the size, location and temperature of the pole cap (Gänsicke et al., 1998). In order to carry out a comparable high-quality study of the low state, we obtained Directors Discretionary Far Ultraviolet Spectroscopic Explorer (FUSE) and HST observations of AM Her in 2002.
| Dataset | UT start | Exp. time | |
|---|---|---|---|
| HST | |||
| o8h801010 | 2002-07-11 12:18:14 | 2450s | 14.7 |
| o8h801020 | 2002-07-11 13:35:40 | 3050s | – |
| o8h802010 | 2002-07-12 13:57:09 | 2450s | 14.6 |
| o8h802020 | 2002-07-12 15:13:52 | 3030s | – |
| o8qp02010 | 2003-11-06 19:29:30 | 2200s | 14.6 |
| o8qp03010 | 2003-11-07 09:44:41 | 2200s | 14.7 |
| o8qp04010 | 2003-11-07 17:52:58 | 2200s | 14.6 |
| o8qp07010 | 2003-11-08 09:44:15 | 2200s | 14.1 |
| FUSE | |||
| P1840601001 | 2000-06-12 23:48 | 5643s | – |
| Z0060101000 | 2002-05-11 23:39 | 46115s | – |
| C0530503000 | 2002-09-08 05:51 | 4456s | – |
| C0530504000 | 2002-09-08 09:12 | 7029s | – |
| C0530505000 | 2002-09-08 14:12 | 5847s | – |

2. Observations and Data Processing
2.1. HST/STIS
Time-resolved HST/Space Telescope Imaging Spectrograph (STIS) far-ultraviolet (FUV) spectroscopy of AM Her was carried out during four spacecraft orbits on 11/12 July 2002 (Table 1). At the time of the STIS observations AM Her had been in the low state () for d (Fig. 1). Because the orbital periods of AM Her and HST are closely commensurate (185.7 min and 96 min, respectively) the observations had to be scheduled in two blocks of two consecutive orbits separated by a gap of 14 orbits to achieve full orbital phase coverage. The data were taken using the G140L grating and the aperture, providing a spectral resolution of over the wavelength range 11501715 Å, and using the TIME-TAG acquisition mode which allows arbitrary temporal binning of the data during the analysis.
AM Her was observed again with HST/STIS on 6/7/8 November 2003 over 4 HST orbits as part of the program 9852 (PI Saar), using the same setup as before except for the data acquisition mode (Table 1). The data were obtained in the ACCUM mode, in which all registered photons are accumulated over a set exposure time and then downlinked in form of a raw detector image. The observations of AM Her were taken with an exposure time of 440s, resulting in a total of 20 individual spectra. In November 2003, AM Her was observed when it had been in a low state for d, following a d high state, and just very shortly before it was rising to a short ( d) intermediate state (Fig. 1).
We have used the STIS acquisition images to determine the brightness of AM Her during the times of the FUV spectroscopy. The acquisition images were taken with the F2850LP filter, which extends from 5400–10 000 Å, with a pivot wavelength at 7229 Å, and compares in response roughly to an -band filter. The magnitudes reported in Table 1 are entirely consistent with AM Her being in a deep low state, except the last data set, where . It may be that this reflects the rising activity seen in the AAVSO light curve (Fig. 1).
While inspecting the pipeline-calibrated STIS spectra and attempting a first qualitative fit of the data using white dwarf model spectra (see Sect. 3 for details on the full model fits), we noticed a flux deficit in the observed spectra at the blue end ( Å) of the G140L wavelength range. It is well-known that the sensitivity of the STIS+G140L configuration is time-variable, most noticeably a loss in sensitivity below Å, and is allegedly accounted for and corrected by the CALSTIS pipeline. Intrigued by the apparent flux deficit, we retrieved G140L spectra of the HST flux standard Grw5824, a K DA white dwarf, taken on 12 August 1997 (shortly after the commissioning of STIS) and on 3 August 2002, shortly after our AM Her observations. Both spectra were reduced with CALSTIS V2.16 and the most recent reference files. Fitting the two STIS spectra of Grw5824 it became clear that the flux calibration from the pipeline does indeed underestimate the flux at the bluest wavelengths in the more recent spectrum. We have therefore implemented the following procedure to correct the time-dependent change in sensitivity of the G140L grating that can be applied to observations taken at any point throughout the life time of STIS. First, the earliest spectrum of Grw5824 and a second spectrum taken closest in time to the observation of the actual science target were obtained from the HST archive and pipeline-processed with the time-dependent sensitivity correction switched off. Next, the two spectra were binned in 3 Å steps, and the flux ratio initial/recent is computed. This ratio is then smoothed with a 3-point box car and used as a multiplicative correction for the target spectrum.
2.2. FUSE
As shown in Figure 1, AM Her was observed with FUSE in May 2002 (our DDT program) and in September 2002 (our additional GO program), almost exactly 60d before and after the July 2002 HST/STIS observation. For completeness, we also include the high-state observation carried out in June 2000 (Hutchings et al., 2002). The FUSE spectrograph consists four independent optical channels that combined cover the 905-1187 Å wavelength range (Moos et al., 2000). The optics of two of the four channels are optimized for shorter wavelengths (905–1105Å) with a SiC coating. The optics of the other two channels are coated with LiF and optimized for the longer wavelengths (1000–1187Å). The data are recorded in eight segments, A and B for each of 4 channels, and the eight segments can be combined to cover the full 905–1187 Å range with some overlap. Both observations were taken in the photon-counting time tag mode through the large (LWRS) aperture. This minimizes slit losses that can occur due to misalignments of the four FUSE channels. Sahnow et al. (2000) describe the FUSE observatory and its in-flight performance in detail.
For the analysis here, the data were reprocessed using version 3.0 of the CALFUSE software, using calibration files available in spring 2005. Inspection of the data products indicate that both observations were nominal and that slit losses were in fact quite small (less than 10%). As a result, it was not necessary to renormalize the spectra from individual channels to create the combined spectra, either in the time-averaged spectrum or in the phase resolved spectra discussed below. In generating the combined spectra, we rebinned the data to 0.1 Å and weighted the various spectral channels according to the effective area and exposure time for that particular channel and wavelength.
2.3. Average Spectra
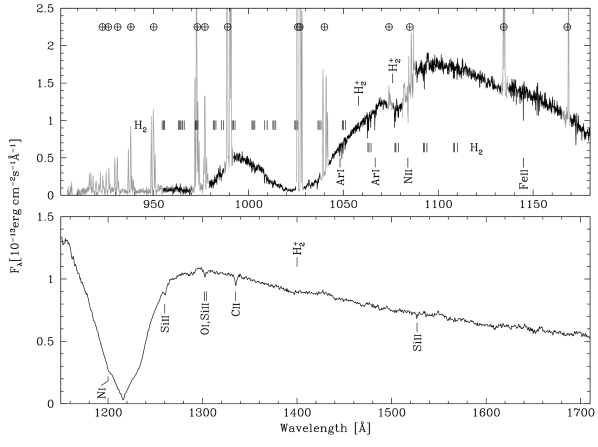
As will be discussed in Sect. 5, the two sets of FUSE and HST low state spectra (see Fig. 1, Table 1) are practically identical, and we therefore pursue the following analysis on the two longest observations, the May 2002 FUSE data, and the July 2002 HST data. The average spectra calculated from these observations are shown in Figure 2. The STIS spectrum (bottom panel) is devoid of noticeable emission lines, confirming the low accretion activity, and clearly reveals the broad photospheric line of the white dwarf. The 1400 Å quasimolecular absorption of is very weak, as expected for a temperature K. Weak absorption lines of CNO and Si are detected in the spectrum, with equivalent widths of mÅ. The same transitions were detected at similar strengths in HST/GHRS high state data of AM Her (Gänsicke et al., 1998). Based on the coincidence of the set of detected transitions with the strongest interstellar absorption lines, their low and apparently constant equivalent widths, and the fact that only the resonance (ground-state) transitions (1260 Å, 1527 Å) of the Si II 1260/65 and Si II 1527/33 doublets are observed, we identify these lines as being due to interstellar absorption. A limit on the metal abundances in the white dwarf photosphere of AM Her will be derived in Sect. 3.3.
The FUSE spectrum seamlessly connects to the STIS data, and reveals the broad photospheric and lines. Clearly present is the 1076 Å component of the line, however, the 1058 Å component, which is of noticeable strength in K DA white dwarfs (Koester et al., 1998; Hébrard & Moos, 2003), is not detected. The absence of this feature is intriguing, as Dupuis et al. (2003) also noticed a much weaker 1058 Å absorption in the magnetic ( MG) white dwarf PG 1658+441. They argued that the disagreement in the case of the massive () white dwarf PG 1658+441 might be due to the lack of appropriate line profile data for high-density plasma. The same argument would not work for AM Her, as it has a mass typical for single white dwarfs. The disagreement between the predicted and observed quasimolecular lines in AM Her may suggest that the magnetic field plays a role in the formation of these lines. The continuum flux of AM Her below Å, is very weak and strongly contaminated by airglow emission (see Feldman et al. 2001 for details on the identification of airglow lines). Similar to the STIS spectrum, a number of weak and sharp absorption features are detected, which we identify as interstellar metallic absorption lines (Sembach, 1999) and molecular absorption bands (Jenkins & Peimbert, 1997).
2.4. High Time Resolution Light Curves
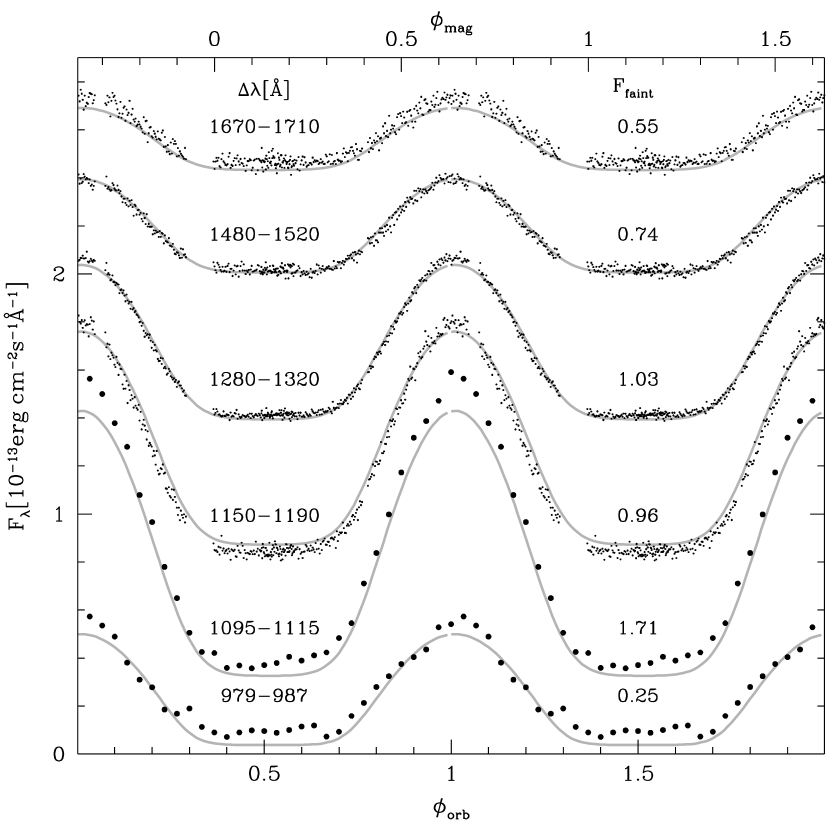
We have used the TIME-TAG data obtained in July 2002 data to produce FUV high time resolution light curves. The general procedure of extracting background-subtracted light curves from G140L TIME-TAG data has been described by Gänsicke et al. (2001). We decided to create light curves binned in 30 s in the four bands 1150–1190 Å, 1280–1320 Å, 1480–1520 Å, and 1670–1710 Å, which sample the blue and red wing of the line as well as two continuum bands, respectively. In addition, we have created lower time resolution (371 s) light curves from the phase-resolved FUSE spectra in the wavelength ranges 979–987 Å and 1095–1115 Å, which are free from airglow emission. Orbital phases were computed using Tapia’s linear polarization ephemeris as quoted by Heise & Verbunt (1988). The accumulated error in the phase is , which is negligibly small for the purposes of our study. The zero point of this phase convention is defined as the phase of maximum linear polarization, which occurs when the angle between the line of sight and the magnetic axis reaches its maximum value, and we will refer to this phase convention as magnetic phase, . The magnetic phase and the orbital phase , where the phase zero is defined as the inferior conjunction of the secondary star is given by (Gänsicke et al., 1998). The phase-folded light curves (Fig. 3) display a strong orbital flux modulation, with maximum flux near and a flat minimum extending over . The amplitude of the modulation peaks in the 1095–1115 Å band, and decrease both to shorter and longer wavelengths. Following Gänsicke et al. (1995, 1998), we interpret the FUV flux variability as being due to the changing aspect of a hot polar cap on the rotating white dwarf. The flat part of the FUV light curve corresponds to the times when the heated pole cap is self-eclipsed by the body of the white dwarf.
2.5. Phase-resolved Spectra
We have generated a total of 36 individual 300s exposures from the July 2002 TIME-TAG data, corresponding to an orbital phase resolution of , which were then processed with the CALSTIS pipeline within STSDAS. Orbital phases were computed as detailed in Sect. 2.4. Finally, the 36 individual spectra were averaged into 10 phase bins, resulting in effective exposure times of 600 s to 1800 s per phase bin.
The November 2003 STIS observations of AM Her were processed in an analogous fashion except that a total of 20 spectra with exposures time of 440 s each were used.
The process for generating phase resolved FUSE spectra was slightly different. Basically the process was to concatenate all of the data together into a individual raw TTAG data files for the observation in May and September 2002. The data were then re-reduced multiple times with CALFUSE, using ”good time intervals” that corresponded to each specific orbital phase, to produce fluxed spectra in small (0.003 or 0.10) phase increments. As previously, the individual channel spectra were co-added to produce spectra covering the full spectral range.
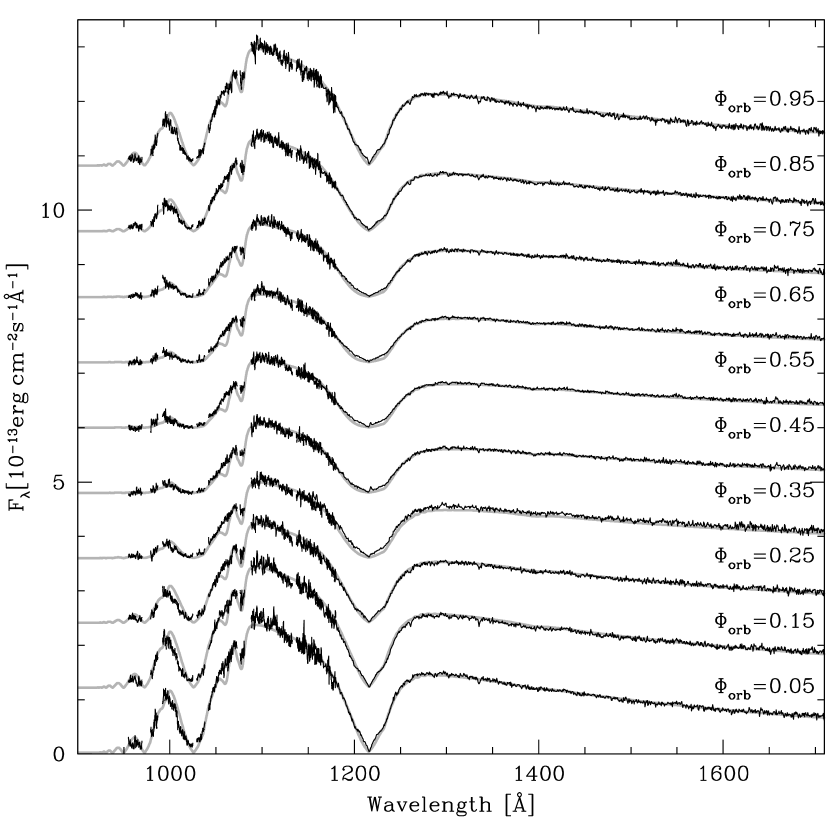
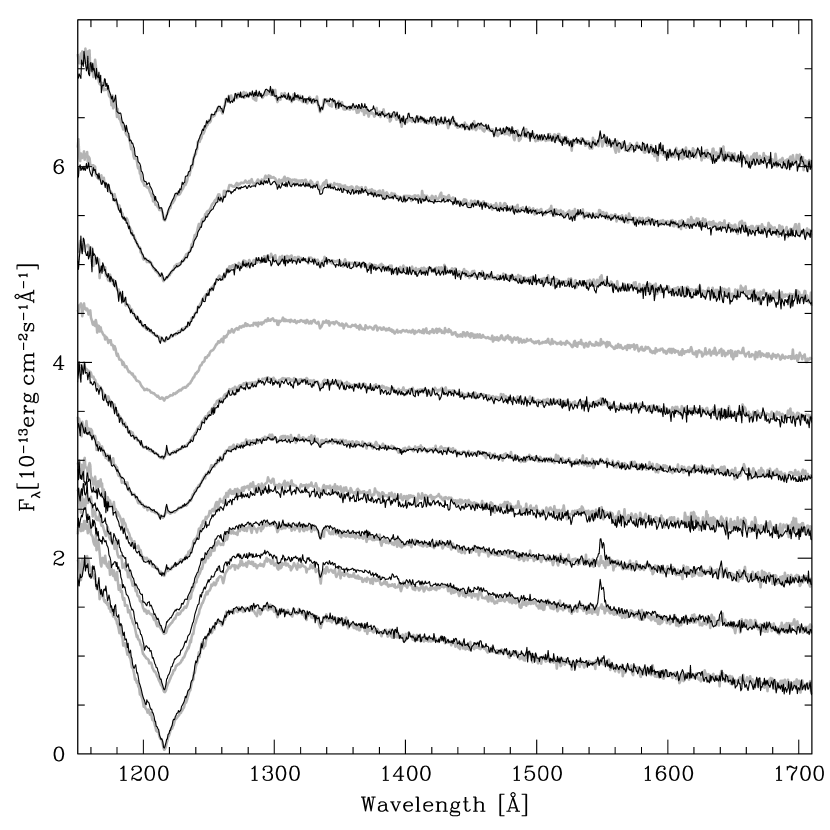
Figure 4 shows the May 2002 FUSE and the July 2002 HST/STIS spectra averaged into 10 orbital phase bins. Clearly noticeable is, in addition to the change in flux level, the variation of the to line profiles which are narrowest around and broadest around .
3. White dwarf properties
We have created average STIS and FUSE spectra for the phase-range where the hot polar cap is eclipsed, (Fig. 3), in order to investigate the properties of the underlying white dwarf. As a preparation for the analysis carried out in this and the following sections, we have generated a grid of local thermal equilibrium (LTE) pure hydrogen (DA) non-magnetic white dwarf models using the TLUSTY/SYNSPEC suite (Hubeny, 1988; Hubeny & Lanz, 1995). The white dwarf effective temperatures and surface gravities covered were K in appropriate steps, in steps of 0.25, respectively. In the temperature range considered here, especially for the unheated white dwarf ( K, Heise & Verbunt 1988; Gänsicke et al. 1995), NLTE primarily affects the line cores. In the case of AM Her, Zeeman splitting/broadening will be a more substantial effect in the line cores. However, no self-consistent line profile data for the case of combined Zeeman splitting and Stark broadening is currently available, and hence no detailed model spectra, are available. A quantitative modelling of the FUV data of AM Her is therefore prone to some uncertainty, either by the use of non-magnetic models as done in the present work, or by the use of models with empirically weakened Stark broadening, as suggested by Jordan (1992). The Zeeman splitting of the Lyman lines is discussed below. The model spectra included the quasimolecular lines of , , and , using the line profile data from Allard et al. (1994, 1998, 2004).
3.1. Magnetic field
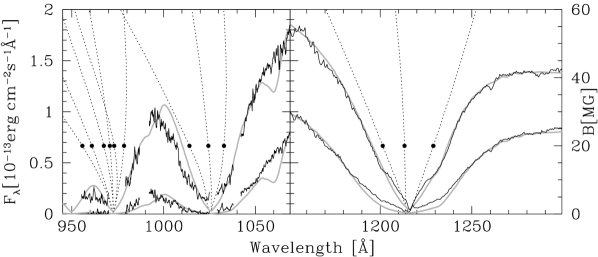
Schmidt et al. (1981) detected several Zeeman components of the white dwarf photospheric Balmer absorption lines in optical spectropolarimetry obtained during a low state. From the positions of these features, they deduced a magnetic field strength of MG at the magnetic equator and MG at the magnetic pole, assuming a simple dipole geometry of the field. An independent measurement of the field strength was obtained from near-infrared cyclotron emission, MG (Bailey et al., 1991). While the Zeeman-splitting of the Lyman lines is much weaker than that of the Balmer lines (e.g. Wunner, 1987), it may still have some noticeable impact on the analysis of the FUV data of AM Her.
Figure 5 shows the orbital minimum and maximum FUSE and STIS spectra, corresponding to the undisturbed white dwarf and the maximum flux contribution from the hot spot. Two kinks are apparent in the slope of the profile of the bright phase spectrum, and their positions coincide with the Zeeman components of in a field strength of MG. This is consistent with Schmidt et al.’s results, as the bright-phase spectrum is dominated by flux originating in the heated pole cap near the magnetic pole. The observed splitting of Å illustrates the effect of the magnetic field on the line profile, and justifies the use of non-magnetic model spectra for the analysis, as long as the core of is excluded from the fits. No convincing features that could be associated with the Zeeman components are seen in the faint phase spectrum, as the profile is intrinsically too broad.
In the higher Lyman lines, the effect of Zeeman is more noticeable. The component might be responsible for the abrupt change in slope seen in the blue wing of the bright phase profile. consists of 6 Zeeman components, and it is clear that the use of non-magnetic models runs into more severe limitations for the that line.
3.2. Mass and temperature
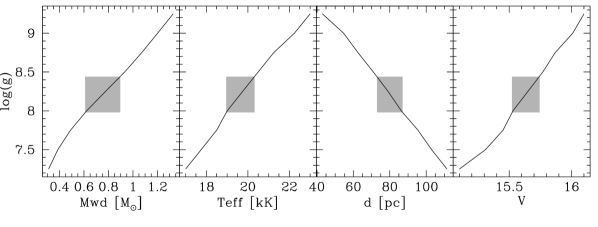
We fitted the observed FUSE and STIS faint phase spectra by stepping through the model grid in , leaving the effective temperature and the flux scaling factor as free parameters. The flux scaling factor is defined as , where , , , and are the observed flux, the model flux, the white dwarf radius and the distance to the system, respectively. Assuming a Wood (1995) mass-radius relation for carbon-oxygen-core white dwarfs, the value of defines both the white dwarf mass and the white dwarf radius. Knowing and , we then calculated the distance . Hence, our procedure results in best-fit values for , , , and as a function of , as shown in Fig. 6. As an additional control on the fit, we compute the magnitude of the best-fit white dwarf models. Increasing results in a higher pressure in the white dwarf atmosphere, and therefore causes stronger Stark broadening of the hydrogen lines. This effect is compensated by an increased value of , which raises the degree of ionization of hydrogen and narrows the hydrogen lines. The distance implied by the fit decreases with increasing as a combined effect of decreasing and increasing.
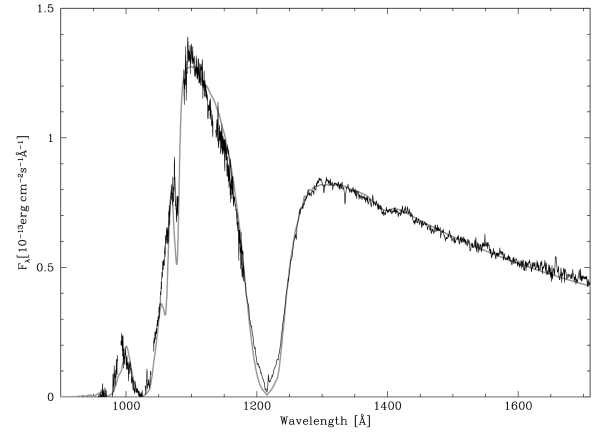
As the distance to AM Her is fairly well established (Thorstensen, 2003), pc, the white dwarf mass and temperature are constrained to the range where the distance implied by the fit falls within the range of the astrometric parallax measurement. The resulting ranges are , cm and K, where the errors are dominated by the remaining uncertainty in the distance, and the best-fit model is shown in Fig 7. The magnitude of the model is , consistent with the observed low state magnitude of which includes some contribution from the secondary star. The mass of the white dwarf in AM Her has been subject to substantial debate, ranging from 0.39 (Young et al., 1981) to 1.06 (Cropper et al., 1999). The model-dependent uncertainties of the method employed here (and previously in the case of WZ Sge, Long et al. 2004) are small compared to the previous estimates of the white dwarf mass in AM Her, and therefore we believe our estimate of the mass is more accurate. Indeed, the largest uncertainty in the current estimate is due to the uncertainty in the distance.
We note in passing that for single white dwarfs there is evidence that their mean mass is higher than that of non-magnetic white dwarfs, e.g. Liebert et al. (2003) quote for magnetic white dwarfs versus for non-magnetic white dwarfs (Bergeron et al., 1992; Finley et al., 1997; Liebert et al., 2005). In CVs white dwarf mass determinations are notoriously uncertain, and the number of well-determined masses is yet too small to assess the possibility of different white dwarf masses in magnetic and non-magnetic CVs. In addition, white dwarf masses in CVs will be subject to the details of the evolution of the system, i.e. depend on the balance between mass accretion on one side, and mass ejection during nova eruptions on the other side.
3.3. Photospheric abundances
Whereas in single white dwarfs gravitation separates the elements in the envelope and results in most cases in either pure hydrogen (DA) or pure helium (DB) atmospheres, it can be expected that in CVs accretion of metal-rich material from the secondary star alters the chemical composition of the white dwarf photosphere. In fact, FUV spectroscopy of the white dwarfs in non-magnetic CVs has revealed substantial metal abundances in all observed systems (e.g. Sion et al., 1990; Long et al., 1993; Gänsicke et al., 2005).

In polars, much less quantitative work on the photospheric abundances of the accreting white dwarfs has been carried out. Gänsicke et al. (1995) found two absorption lines near the Si II 1260,65 doublet in nine out of eleven IUE low state spectra of AM Her and suggested that these structures may be due to metals in the photosphere of the white dwarf. However, they also noticed that a broad absorption trough around 1300 Å (an conglomerate Si II, Si III, and O I lines, unresolved at IUE’s resolution) was absent; this feature is prominent in the IUE spectra of e.g. VW Hyi, a dwarf nova with a white dwarf of similar temperature to that in AM Her, and therefore it was not entirely clear how to interpret the features that were seen. DePasquale & Sion (2001) carried out spectral fits to the IUE data of AM Her that had been described by Gänsicke et al. (1995), and derived metal abundances in the range 0.05 to 0.001, with no apparent correlation to either orbital phase or the time spent in a low state.
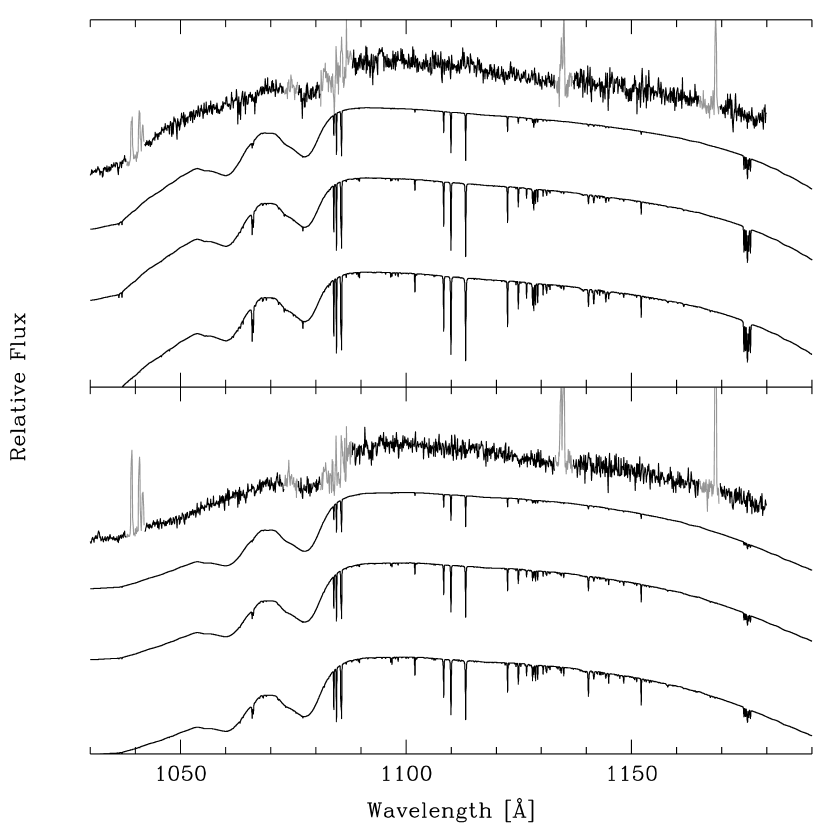
Figures 8 and 9 show our HST/STIS and FUSE spectra of AM Her, respectively, at orbital maximum and minimum along with white dwarf model spectra computed for the corresponding orbital phases assuming abundances of 0.001, 0.005, and 0.01 their solar values (and binned to the corresponding spectral resolutions). As discussed in Sect. 2.3, the noticeable absorption features in the STIS spectra coincide with the strongest interstellar lines.
One of the goals of our HST and FUSE low state observations of AM Her was to detect photospheric metal lines and probe into their Zeeman splitting at high field strengths. To our knowledge, no predictions for the Zeeman splitting of FUV metal transitions at field strengths of tens of MG are available. Under the linear Zeeman effect the surface field strengths in the range MG would result in Zeeman splitting of the order a few ten Å, depending on the Landé factor of the transition. However, practically independent of the actual splitting, one would expect to detect some noticeable absorption lines if substantial amounts of any metal were present in the photosphere of the white dwarf. The absence of any absorption features (except the Lyman lines) that could be ascribed to photospheric absorption lines from the white dwarf atmosphere strongly suggests that the average metal abundances over the visibile hemisphere are lower than 0.001 times their solar values at any given orbital phase.111A hypothetical explanation for the absence of metals would be that mass transfer decreased to extremely low levels, and that the metals diffused below the photospheric level. However, this seems not likely, as only a minute amount of accretion, , is necessary to enrich the photosphere to a noticeable level, and observations both at X-ray, optical, and IR wavelengths shows low-level accretion activity during the low state (e.g. de Martino et al., 1998; Kafka et al., 2005; Bailey et al., 1991)..
The finding of a nearly pure hydrogen composition of the atmosphere in AM Her underlines fundamental differences in the accretion processes in non-magnetic versus magnetic CVs. Beuermann & Gänsicke (2003) discussed that the high magnetic field strength in polars prohibits a spreading of the accreting material lateral to the field lines down to a depth in the atmosphere of the white dwarf where the gas pressure equals the magnetic pressure. For typical white dwarf temperatures and fields in polars, the decoupling occurs at several ten kilometer depth, much below the observable photosphere. Enhanced metal abundances could exist in the foot points of the accretion column, but because of the small extent of these regions their contribution to the average spectrum over the visible hemisphere is probably negligible.
4. The hot spot
Heise & Verbunt (1988) analyzed IUE spectroscopy of AM Her obtained during both high state and low state. The authors concluded that the low state FUV emission of AM Her is dominated by a K white dwarf, and that during the high state a large area of the white dwarf is heated to K. Using a substantially larger set of IUE spectra, Gänsicke et al. (1995) showed that during the low state both the FUV flux and the shape of the absorption profile change as a function of orbital phase, which they modeled in terms of a hot polar cap with a temperature of K and a fractional area of of the white dwarf surface, located near the magnetic pole of the K white dwarf. The authors showed that an analogous orbital modulation of the FUV flux, with the same phases of minimum and maximum flux, is detected also during the high state, and derived a pole cap temperature of K and a similar fractional area as during the low state.
The analysis of the IUE data was severely limited by the low time resolution, implying substantial orbital phase smearing over the course of the integration, the low spectral resolution, and the large width of the geocoronal emission line, effectively contaminating a substantial faction of the white dwarf photospheric absorption.
Gänsicke et al. (1998) obtained high-time resolution (27s) HST/GHRS spectroscopy of AM Her in a high state covering the range 1150–1435 Å at a spectral resolution of . Continuum light curves showed a quasi-sinusoidal modulation with a maximum near , and an amplitude increasing towards shorter wavelengths. The authors fitted the light curves with a three-dimensional white dwarf plus hot pole cap model, where the temperature in the pole cap decreases from a central value to that of the unheated white dwarf, , as a linear function of the opening angle . Fixing the distance to AM Her to pc and the binary inclination to Gänsicke et al. (1998) found K, K, (corresponding to a fractional white dwarf area of 9%), and , where is the colatitude and the azimuth of the spot.
We have analysed the FUSE and STIS light curves described in Sect. 2.4 using the same three-dimensional model described by Gänsicke et al. (1998). However, in contrast to the GHRS high state study, we fixed the white dwarf temperature and radius to the values determined in Sect. 3.2 from the faint-phase spectrum, (, cm), as well as the distance ( pc) and the binary inclination (). Thus, we fit only , , , and . The best-fit for the combined set of FUSE and STIS light curves is obtained for K, (corresponding to a fractional white dwarf area of 12%), , . There is some degeneracy in the spot size and its temperature, allowing spot temperatures of up to K (with , corresponding to a fractional white dwarf area of 8%).
The best-fit model underestimates somewhat the 1095–1115 Å FUSE continuum flux (Fig. 3). Given that the absolute flux calibration of FUSE is less well established than that of STIS, we do not believe that adopting a more complex model (meaning more free parameter) for the hot spot is warranted by this small disagreement. However, despite the systematic uncertainty between the instrumental calibrations, including the FUSE light curves into the fit does allow a tighter constraint of than fitting the STIS data alone. Interesting to note is the slightly different shape of the FUSE light curves compared to the STIS data. It appears that the flux maximum is preceded by a small depression around , and that the faint phase shows some rising trend between . Again, while this may point towards a somewhat more complex structure of the hot spot compared with our simple circular model, our experience suggests that FUSE guiding is not sufficiently stable to exclude an instrumental origin for these features. A simple constraint on the geometry of the spot can be obtained by mirroring the STIS light curves, and superimposing them to the original. The result is that the original and the mirrored light curve are indistinguishable over the entire orbital cycle, which implies a highly symmetric spot with respect to the rotation axis.
Comparing the results for the low state to the numbers that Gänsicke et al. (1998) found for the high state, the temperature of the hot spot is obviously lower during the low state. On the other hand, its size does not differ much, covering % during the low state and the high state. Similarly, the azimuth of the spot during the low state does not change significantly between the low state and the high state, although the low state co-latitude is higher by than for the high state. If the hot spot is due to ongoing accretion (see Sect. 6), such a change in could be related to a change in the location of the coupling region (where the ballistic mass stream from the secondary couples to the white dwarf magnetic field lines) as a result of the change in mass transfer rate.
5. Comparison of the different epochs of the FUSE and STIS observations
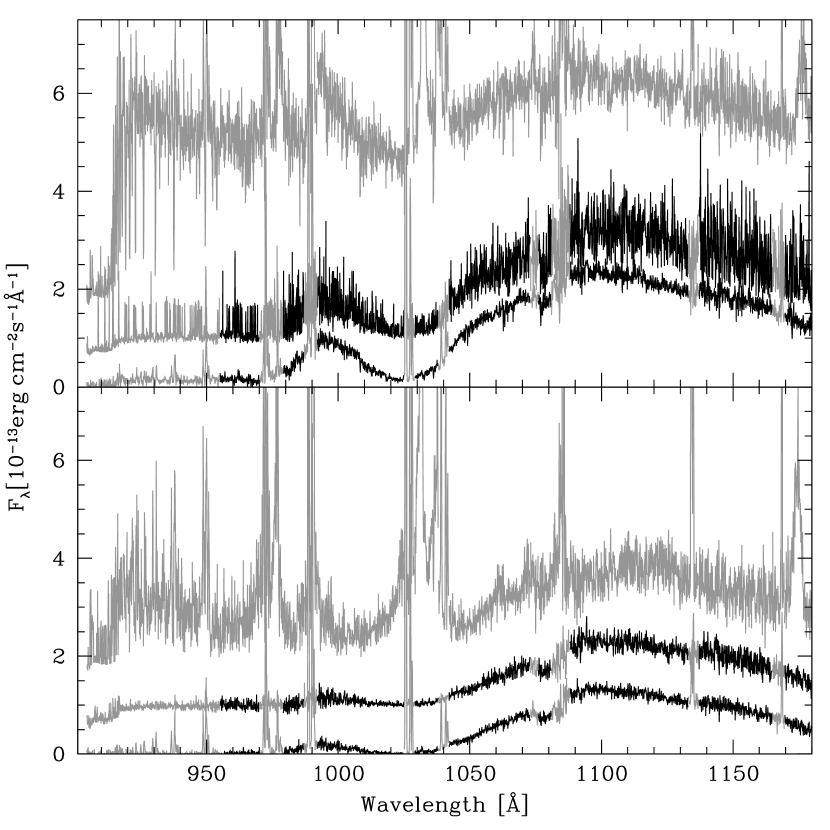
Figure 10 compares the orbital minimum and maximum FUSE and HST/STIS observations of AM Her obtained at different epochs (Fig. 1, Table 1).
The two FUSE low state data are virtually identical in flux level and in spectral shape. The principal differences are that the September 2002 spectrum was less contaminated by airglow emission and had – unfortunately – a lower signal to noise as a result of a shorter exposure time than the May 2002 spectrum. Plotted along with our own low state data are the June 2002 high state observations obtained by Hutchings et al. (2002) just after AM Her returned from a short-lived low state. The 1100–1150 Å continuum fluxes during the faint phase and the bright phase differ by factors and , respectively. Obviously, the ongoing accretion during the high state results in emission lines, primarily C III 977,1175, N III 992, O VI 1032,1038 (see Hutchings et al. 2002 for a study of the emission lines). It is interesting to note that the spectral shape of the high state faint phase spectrum does not differ strongly from the low state faint phase spectrum, subtracting a constant flux of brings the high state and low state spectra to close agreement, suggesting that the unheated white dwarf was still the dominant FUV flux contribution at that time, and that accretion adds a featureless nearly flat continuum component. During the bright phase, a broad absorption from the white dwarf photosphere is still clearly visible in the high state spectrum, but the spectral shape is markedly different from the low state. In particular, substantial flux is observed at Å during the high state, rising towards the Lyman edge, where practically no continuum flux was observed during the low state. This additional flux component is a mixture of emission from the heated polar cap (now hotter than during the low state) and of emission from the accretion stream/funnel.
As for the two sets of FUSE low state observations, also the July 2002 and the November 2003 HST/STIS low state data are nearly identical at all orbital phases, except for the appearance of some weak C IV 1550 emission near , which is most likely caused by an intermittent accretion event. On close inspection, it appears that the continuum flux during that episode is slightly elevated over that of the July 2002 data. As mentioned in Sect. 2.1, the November 2003 STIS data were obtained just during the rise to an intermediate optical brightness, and it is possible that this observation captured the onset of accretion.
6. Discussion
During the low state, the FUV continuum flux of AM Her is entirely made of emission from the white dwarf and a moderately hot polar cap covering % of the white dwarf surface. With our FUSE and HST/STIS observations we have probed the low state FUV emission of AM Her at four different epochs, and detected practically no variation of the continuum flux at any orbital phase. This finding implies that neither the flux contribution of the white dwarf, nor that of the hot spot vary as a function of the time spent in a low state. In other words, the temperature of the white dwarf as well as the temperature, size, and location of the hot pole cap remain constant over periods of several months. This confirms the results of Gänsicke et al. (1995), who did not find any significant change in the white dwarf and hot spot parameters when analyzing IUE low state spectroscopy obtained at five different epochs, however, our FUSE and HST/STIS results provide a much tighter constraint on the absence of changes in the white dwarf and hot spot parameters.
This finding is somewhat counter-intuitive, as FUV observations of dwarf novae clearly showed a short-term response of the white dwarf to changes in the accretion rate. In those systems, the white dwarf is heated during dwarf nova outbursts, and subsequently cools exponentially to its quiescence temperature. The post-outburst cooling time scales that have been found range from a few days to a few weeks (comparable to the duration of the outburst itself, e.g. VW Hyi: Gänsicke & Beuermann 1996; Sion et al. 1996) to many years (much longer than the duration of the outburst, e.g. e.g. WZ Sge: Slevinsky et al. 1999; Godon et al. 2004; Long et al. 2004; or AL Com, Szkody et al. 2003). From the observations presented here and by Gänsicke et al. (1995), we conclude that the cooling of the white dwarf upon the transition from a high state to a low state proceeds either on time scales of a few weeks or less (so that it has not been caught by any of the past FUV observations) or on time scales much longer than the duration of a low state (so that no noticeable cooling is observed throughout the low state), or that the bulk of the white dwarf is not heated at all during the high state.
Assuming that the white dwarf temperature is governed by accretion, we use Figure 1 from Townsley & Bildsten (2003) to estimate the secular mean accretion rate of AM Her, and find . This value can be compared with , estimated by Hessman et al. (2000) from 21 years of the long-term optical light curve of AM Her together with a magnitude-dependent bolometric correction. The agreement within a factor 2.5 is fairly satisfying, considering the uncertainties in the bolometric correction used by Hessman et al. (2000), and the fact that the temperatures predicted by Townsley & Bildsten (2003) reflect the mean accretion rate averaged over much longer time scales.
A rather puzzling result is that the temperature and the size of the pole cap apparently do not vary much, if at all, during the low state. Two plausible options explaining this finding is either that the pole cap is kept hot by ongoing accretion at a low level, as suggested by Gänsicke et al. (1995) on the basis that both hard X-ray emission and cyclotron radiation are detected occasionally during low states, or that the pole cap is sufficiently deep heated by accretion to remain at constant temperatures for the duration of a low state.
The low state luminosity of the hot pole cap is computed as the sum over all surface elements
| (1) |
where is the Stefan-Boltzmann constant, the area of each individual surface element, and its temperature. From , and assuming and cm, we obtain . Following Gänsicke et al. (1995), roughly equal parts of accretion luminosity are expected in hard X-ray emission, cyclotron radiation, and FUV emission from the pole cap, adding up to a low state accretion rate of . Such a low level of mass transfer is not implausible, as it just implies that the secondary star atmosphere did not fully withdraw from the point. From the observations, there is evidence that X-ray, optical, and infrared activity during the low state is variable (e.g. de Martino et al., 1998; Kafka et al., 2005; Bailey et al., 1991), but it is not clear if non-stationary accretion could maintain the pole cap at the observed constant temperature.
The alternative explanation is deep heating during the high state. Gänsicke et al. (1999) showed that the white dwarf in the VY Scl star TT Ari remained at K for an entire year during a prolonged low state, in that case deep heating is clearly the only explanation as the white dwarf temperature is much too hot to be explained by ongoing accretion during the low state. Our analysis of the high state (Gänsicke et al., 1998) and the low state (this paper) suggest, however, that the spot moves somewhat in co-latitude as a funtion of accretion rate, which contrasts with the idea of a deeply heated hot spot at a fixed location. Moreoever, it is a challenge to stellar structure theory to test whether or not such a substantial temperature inhomogeneity can remain in place for the observed periods of several months.
Additional observational input into testing both hypotheses for the origin of the low state hot spot would be an intense FUV monitoring of AM Her during both high states and low states, and most importantly, during the transitions from between the two states, to accurately track the evolution of the pole cap in temperature, size, and extension. While AM Her is by far the best studied case of a heated pole cap on a white dwarf, large heated pole caps have been identified in more than half a dozen other polars, suggesting that they are a fundamental feature of these systems (e.g. Schwope 1990; Stockman et al. 1994; Ferrario et al. 1996; Gänsicke 1999; Gänsicke et al. 2000; Rosen et al. 2001; Araujo-Betancor et al. 2005).
7. Summary
FUV FUSE and HST/STIS spectroscopy of the prototypical polar AM Her obtained during the low state shows that the white dwarf is the dominant source of emission. The data reveal a strong orbital modulation of the FUV flux as well as a strong variation of the Lyman absorption lines from the white dwarf photosphere. A white dwarf of 19 400 K with a hot pole cap of K covering % of the white dwarf qualitatively fits the orbital phase-resolved FUSE and STIS spectra. Using Thorstensen’s astrometric distance of AM Her and a Wood (1995) mass-radius relation, we determine the white dwarf mass to be . The absence of any noticeable absorption intrinsic to AM Her, other than the Lyman lines, suggests very low average metal abundances in the white dwarf atmosphere. Based on four FUV low-state observations of AM Her obtained at different epochs it appears that the location, temperature, and size of the hot pole cap do not vary as a function of the time spent in a low state. Comparing our low state results with those obtained from an HST/GHRS observation carried out during a high state, we find some evidence for a small change in co-latitude of the spot, with the spot being located closer to the magnetic pole during the low state than during the high state. Detailed monitoring observations covering the transition between high and low state would be important to determine the time scale on which the pole cap adjusts from the high state to the low state parameter. In addition, it would be interesting to compare the structure of the cyclotron emitting region via a a Stokes imaging analysis (Potter et al., 1998).
References
- Allard et al. (1998) Allard, N. F., Kielkopf, J., & Feautrier, N. 1998, A&A, 330, 782
- Allard et al. (2004) Allard, N. F., Kielkopf, J. F., Hébrard, G., & Peek, J. M. 2004, European Physical Journal D, 29, 7
- Allard et al. (1994) Allard, N. F., Koester, D., Feautrier, N., & Spielfiedel, A. 1994, A&AS, 108, 417
- Araujo-Betancor et al. (2005) Araujo-Betancor, S., Gänsicke, B. T., Long, K. S., Beuermann, K., de Martino, D., Sion, E. M., & Szkody, P. 2005, ApJ, 622, 589
- Bailey et al. (1991) Bailey, J., Ferrario, L., & Wickramasinghe, D. T. 1991, MNRAS, 251, 37P
- Bergeron et al. (1992) Bergeron, P., Saffer, R. A., & Liebert, J. 1992, ApJ, 394, 228
- Beuermann & Burwitz (1995) Beuermann, K. & Burwitz, V. 1995, in Cape Workshop on Magnetic Cataclysmic Variables, ed. D. A. H. Buckley & B. Warner (ASP Conf. Ser. 85), 99
- Beuermann & Gänsicke (2003) Beuermann, K. & Gänsicke, B. T. 2003, in White dwarfs, ed. D. de Martino, R. Silvotti, J.-E. Solheim, & R. Kalytis, NATO Science Series II - Mathematics, Physics and Chemistry No. 105 (Kluwer), 317–321
- Cropper et al. (1999) Cropper, M., Wu, K., Ramsay, G., & Kocabiyik, A. 1999, MNRAS, 306, 684
- de Martino et al. (1998) de Martino, D., Gänsicke, B. T., Matt, G., Mouchet, M., Belloni, T., Beuermann, K., Bonnet-Bidaud, J.-M., Mattei, J., Chiappetti, L., & Done, C. 1998, A&A, 333, L31
- DePasquale & Sion (2001) DePasquale, J. & Sion, E. M. 2001, ApJ, 557, 978
- Dupuis et al. (2003) Dupuis, J., Chayer, P., Vennes, S., Allard, N. F., & Hébrard, G. 2003, ApJ, 598, 486
- Feldman et al. (2001) Feldman, P. D., Sahnow, D. J., Kruk, J. W., Murphy, E. M., & Moos, H. W. 2001, Journal of Geophysical Research, 106, 8119
- Ferrario et al. (1996) Ferrario, L., Bailey, J., & Wickramasinghe, D. 1996, MNRAS, 282, 218
- Finley et al. (1997) Finley, D. S., Koester, D., & Basri, G. 1997, ApJ, 488, 375
- Fischer & Beuermann (2001) Fischer, A. & Beuermann, K. 2001, A&A, 373, 211
- Friedrich et al. (1996) Friedrich, S., Oestreicher, R., & Schweizer, W. 1996, A&A, 309, 227
- Gänsicke et al. (2005) Gänsicke, B. T., Szkody, P., Howell, S. B., & Sion, E. M. 2005, ApJ, 629, 451
- Gänsicke (1999) Gänsicke, B. T. 1999, in Annapolis Workshop on Magnetic Cataclysmic Variables, ed. C. Hellier & K. Mukai (ASP Conf. Ser. 157), 261–272
- Gänsicke & Beuermann (1996) Gänsicke, B. T. & Beuermann, K. 1996, A&A, 309, L47
- Gänsicke et al. (1995) Gänsicke, B. T., Beuermann, K., & de Martino, D. 1995, A&A, 303, 127
- Gänsicke et al. (2000) Gänsicke, B. T., Beuermann, K., de Martino, D., & Thomas, H.-C. 2000, A&A, 354, 605
- Gänsicke et al. (1998) Gänsicke, B. T., Hoard, D. W., Beuermann, K., Sion, E. M., & Szkody, P. 1998, A&A, 338, 933
- Gänsicke et al. (2001) Gänsicke, B. T., Schmidt, G. D., Jordan, S., & Szkody, P. 2001, ApJ, 555, 380
- Gänsicke et al. (1999) Gänsicke, B. T., Sion, E. M., Beuermann, K., Fabian, D., Cheng, F. H., & Krautter, J. 1999, A&A, 347, 178
- Godon et al. (2004) Godon, P., Sion, E. M., Cheng, F., Gänsicke, B. T., Howell, S., Knigge, C., Sparks, W. M., & Starrfield, S. 2004, ApJ, 602, 336
- Hébrard & Moos (2003) Hébrard, G. & Moos, H. W. 2003, ApJ, 599, 297
- Heise & Verbunt (1988) Heise, J. & Verbunt, F. 1988, A&A, 189, 112
- Hessman et al. (2000) Hessman, F. V., Gänsicke, B. T., & Mattei, J. A. 2000, A&A, 361, 952
- Hubeny (1988) Hubeny, I. 1988, Comput.,Phys.,Comm., 52, 103
- Hubeny & Lanz (1995) Hubeny, I. & Lanz, T. 1995, ApJ, 439, 875
- Hutchings et al. (2002) Hutchings, J. B., Fullerton, A. W., Cowley, A. P., & Schmidtke, P. C. 2002, AJ, 123, 2841
- Jenkins & Peimbert (1997) Jenkins, E. B. & Peimbert, A. 1997, ApJ, 477, 265
- Jordan (1992) Jordan, S. 1992, A&A, 265, 570
- Kafka et al. (2005) Kafka, S., Robertson, J., Honeycutt, R. K., & Howell, S. B. 2005, AJ, 129, 2411
- King & Lasota (1979) King, A. R. & Lasota, J. P. 1979, MNRAS, 188, 653
- Koester et al. (1998) Koester, D., Sperhake, U., Allard, N. F., Finley, D. S., & Jordan, S. 1998, A&A, 336, 276
- Kuijpers & Pringle (1982) Kuijpers, J. & Pringle, J. E. 1982, A&A, 114, L4
- Lamb & Masters (1979) Lamb, D. Q. & Masters, A. R. 1979, ApJ Lett., 234, L117
- Liebert et al. (2003) Liebert, J., Bergeron, P., & Holberg, J. B. 2003, AJ, 125, 348
- Liebert et al. (2005) —. 2005, ApJS, 156, 47
- Long et al. (1993) Long, K. S., Blair, W. P., Bowers, C. W., Davidsen, A. F., Kriss, G. A., Sion, E. M., & Hubeny, I. 1993, ApJ, 405, 327
- Long et al. (2004) Long, K. S., Sion, E. M., Gänsicke, B. T., & Szkody, P. 2004, ApJ, 602, 948
- Moos et al. (2000) Moos, H. W., Cash, W. C., Cowie, L. L., Davidsen, A. F., Dupree, A. K., Feldman, P. D., Friedman, S. D., Green, J. C., Green, R. F., Gry, C., Hutchings, J. B., Jenkins, E. B., Linsky, J. L., Malina, R. F., Michalitsianos, A. G., Savage, B. D., Shull, J. M., Siegmund, O. H. W., Snow, T. P., Sonneborn, G., Vidal-Madjar, A., Willis, A. J., Woodgate, B. E., York, D. G., Ake, T. B., Andersson, B.-G., Andrews, J. P., Barkhouser, R. H., Bianchi, L., Blair, W. P., Brownsberger, K. R., Cha, A. N., Chayer, P., Conard, S. J., Fullerton, A. W., Gaines, G. A., Grange, R., Gummin, M. A., Hebrard, G., Kriss, G. A., Kruk, J. W., Mark, D., McCarthy, D. K., Morbey, C. L., Murowinski, R., Murphy, E. M., Oegerle, W. R., Ohl, R. G., Oliveira, C., Osterman, S. N., Sahnow, D. J., Saisse, M., Sembach, K. R., Weaver, H. A., Welsh, B. Y., Wilkinson, E., & Zheng, W. 2000, ApJ Lett., 538, L1
- Potter et al. (1998) Potter, S. B., Hakala, P. J., & Cropper, M. 1998, MNRAS, 297, 1261
- Ramsay & Cropper (2004) Ramsay, G. & Cropper, M. 2004, MNRAS, 347, 497
- Ramsay et al. (1996) Ramsay, G., Cropper, M., & Mason, K. O. 1996, MNRAS, 278, 285
- Ramsay et al. (1994) Ramsay, G., Mason, K. O., Cropper, M., Watson, M. G., & Clayton, K. L. 1994, MNRAS, 270, 692
- Rosen et al. (2001) Rosen, S. R., Rainger, J. F., Burleigh, M. R., Mittaz, J. P. D., Buckley, D. A. H., Sirk, M. M., Lieu, R., Howell, S. B., & de Martino, D. 2001, MNRAS, 322, 631
- Sahnow et al. (2000) Sahnow, D. J., Moos, H. W., Ake, T. B., Andersen, J., Andersson, B.-G., Andre, M., Artis, D., Berman, A. F., Blair, W. P., Brownsberger, K. R., Calvani, H. M., Chayer, P., Conard, S. J., Feldman, P. D., Friedman, S. D., Fullerton, A. W., Gaines, G. A., Gawne, W. C., Green, J. C., Gummin, M. A., Jennings, T. B., Joyce, J. B., Kaiser, M. E., Kruk, J. W., Lindler, D. J., Massa, D., Murphy, E. M., Oegerle, W. R., Ohl, R. G., Roberts, B. A., Romelfanger, M. L., Roth, K. C., Sankrit, R., Sembach, K. R., Shelton, R. L., Siegmund, O. H. W., Silva, C. J., Sonneborn, G., Vaclavik, S. R., Weaver, H. A., & Wilkinson, E. 2000, ApJ Lett., 538, L7
- Schmidt et al. (1981) Schmidt, G. D., Stockman, H. S., & Margon, B. 1981, ApJ Lett., 243, L157
- Schwope (1990) Schwope, A. D. 1990, Reviews of Modern Astronomy, 3, 44
- Sembach (1999) Sembach, K. R. 1999, in Stromlo Workshop on High-Velocity Clouds, ed. B. K. Gibson & M. E. Putman (ASP Conf. Ser. 166), 243–268
- Sion et al. (1996) Sion, E. M., Cheng, F., Huang, M., Hubeny, I., & Szkody, P. 1996, ApJ Lett., 471, L41
- Sion et al. (1990) Sion, E. M., Leckenby, H. J., & Szkody, P. 1990, ApJ Lett., 364, L41
- Slevinsky et al. (1999) Slevinsky, R. J., Stys, D., West, S., Sion, E. M., & Cheng, F. H. 1999, PASP, 111, 1292
- Stockman et al. (1994) Stockman, H. S., Schmidt, G. D., Liebert, J., & Holberg, J. B. 1994, ApJ, 430, 323
- Szkody et al. (2003) Szkody, P., Gänsicke, B. T., Sion, E. M., Howell, S. B., & Cheng, F. H. 2003, AJ, 126, 1451
- Thorstensen (2003) Thorstensen, J. R. 2003, AJ, 126, 3017
- Townsley & Bildsten (2003) Townsley, D. M. & Bildsten, L. 2003, ApJ Lett., 596, L227
- Wood (1995) Wood, M. A. 1995, in White Dwarfs, ed. D. Koester & K. Werner, LNP No. 443 (Heidelberg: Springer), 41–45
- Wunner (1987) Wunner, G. 1987, Mitteilungen der Astronomischen Gesellschaft, 70, 198
- Young et al. (1981) Young, P., Schneider, D. P., & Shectman, S. A. 1981, ApJ, 245, 1043