Complexity on Small Scales: The Metallicity Distribution of the Carina Dwarf Spheroidal Galaxy 11affiliation: Based on observations collected at the European Southern Observatory at Paranal, Chile; proposal 171.B-0520(A).
Abstract
The Carina dwarf spheroidal galaxy is the only galaxy of this type that shows clearly episodic star formation separated by long pauses. Here we present metallicities for 437 radial velocity members of this Galactic satellite. The metallicities and radial velocities were measured as part of a Large Programme with the Very Large Telescope at the European Southern Observatory, Chile. We obtained medium-resolution spectroscopy with the multi-object spectrograph FLAMES. Our target red giants cover the entire projected surface area of Carina. Our spectra are centered at the near-infrared Ca ii triplet, which is a well-established metallicity indicator for old and intermediate-age red giants. The resulting data sample provides the largest collection of spectroscopically derived metallicities for a Local Group dwarf spheroidal to date. Four of our likely radial velocity members of Carina lie outside of this galaxy’s nominal tidal radius, supporting earlier claims of the possible existence of such stars beyond the main body of Carina. We find a mean metallicity of [Fe/H] dex on the metallicity scale of Carretta & Gratton (1997) for Carina. The formal full width at half maximum of the metallicity distribution function is 0.92 dex, while the full range of metallicities is found to span [Fe/H] dex. The metallicity distribution function might be indicative of several subpopulations distinct in metallicity. There appears to be a mild radial gradient such that more metal-rich populations are more centrally concentrated, matching a similar trend for an increasing fraction of intermediate-age stars (Harbeck et al. 2001). This as well as the photometric colors of the more metal-rich red giants suggest that Carina exhibits an age-metallicity relation. Indeed the age-metallicity degeneracy seems to conspire to form a narrow red giant branch despite the considerable spread in metallicity and wide range of ages. The metallicity distribution function is not well-matched by a simple closed-box model of chemical evolution. Qualitatively better matches are obtained by chemical models that take into account also infall and outflows. A G-dwarf problem remains for all of these models.
1 Introduction
Dwarf galaxies come in many flavors ranging from gas-rich to gas-poor, from irregular in shape to ellipsoidal, from actively star-forming to quiescent (Grebel 2001). The least massive, least luminous galaxies known are the dwarf spheroidal (dSph) galaxies. They are characterized by absolute V-band luminosities M mag, surface brightnesses of mag arcsec-2, H i masses of , estimated total masses of a few times , have shallow projected radial light profiles and tend not to be rotationally supported (see Grebel, Gallagher, & Harbeck 2003 and references therein). Because of their high velocity dispersion, their velocity dispersion profiles, their morphology and their lack of depth extent many dSphs are believed to be dominated by dark matter (e.g., Mateo 1997; Odenkirchen et al. 2001; Klessen, Grebel, & Harbeck 2003; Wilkinson et al. 2004). In galaxy groups dSphs are usually found within kpc around more massive galaxies (Fig. 1 in Grebel 2005). The gas deficiency of dSphs remains an unsolved puzzle – dSphs typically contain even less gas than expected from red giant mass loss over time scales of several Gyr. Searches for neutral and ionized gas usually only lead to low upper limits on the gas content (e.g., Gallagher et al. 2003 and references therein).
DSphs are typically dominated by either very old populations ( Gyr) or by intermediate-age populations ( Gyr). Very few show more recent star formation. All dSphs (and all other dwarfs) studied in sufficient detail so far have been shown to contain ancient populations that are indistinguishable in age with the oldest age-datable populations in the Milky Way (Grebel 2000, Grebel & Gallagher 2004). The detailed star formation histories and the metal enrichment of dwarf galaxies including dSphs vary widely; no two dwarfs are alike (e.g., Grebel 1997, Mateo 1998). DSphs usually show continuous star formation with some amplitude variations and declining rates at more recent times. A number of dSphs are entirely dominated by old populations, for instance, Draco and Ursa Minor. Younger and/or more metal-rich populations in dSphs are more centrally concentrated, indicating extended star formation episodes in the centers of their shallow potential wells (Harbeck et al. 2001).
The Galactic dSph Carina stands out among the dSphs in the Local Group because of its unusual, episodic star formation history. In no other dSph clear evidence for well-separated episodes of star formation has been found. Carina was discovered in 1977 (Cannon, Hawarden, & Tritton 1977) on an ESO/SRC(J) Southern Sky Survey plate. Carina is located at a heliocentric distance of kpc and belongs to the fainter dSphs (, ; see Grebel 2000 for references). First indications that Carina is not a purely old, globular-cluster-like system came from the discovery of carbon stars (Cannon, Niss, & Norgaard-Nielsen 1981; Mould et al. 1982). Subsequent deep photometry revealed a younger main sequence (Mould & Aaronson 1983; Mighell 1990a,b) and showed that the bulk of the stars in Carina is of intermediate age (i.e., younger than 10 Gyr). However, an old population (traced by a horizontal branch and RR Lyrae stars, e.g., Saha, Monet, & Seitzer 1986) is present as well. Mighell’s (1990a,b) data show two distinct main-sequence turnoffs. Smecker-Hane et al.’s (1994) color-magnitude diagram (CMD) of Carina reveals a morphologically distinct, prominent red clump of an intermediate-age population next to a well-defined red and blue horizontal branch. Mighell and Smecker-Hane et al. concluded that Carina must have undergone at least two separate episodes of star formation.
The episodic nature of the star formation in Carina was then confirmed by deeper photometry: Smecker-Hane et al. (1996) presented a color-magnitude diagram (CMD) that reached mag. Three well-defined, distinct main-sequence turn-offs (MSTOs) corresponding to ages of 2, 3–6, and 11–13 Gyr are visible in these data. Smecker-Hane et al. note that each of the three MSTOs connects to the same narrow red giant branch and conclude that “regardless of age, Carina stars are metal-poor with [Fe/H] dex and a spread in metal abundance of dex.” Mighell (1997), Hurley-Keller, Mateo, & Nemec (1998), Monelli et al. (2003), and Rizzi et al. (2003) arrive at similar conclusions based on additional deep CMDs111We will not discuss here star formation histories of Carina derived from HST photometry since the field coverage and the number of stars are too small to do so reliably. Hurley-Keller et al. (1998) argue that only 10–20% of Carina’s stars formed very early on, while the majority formed approximately 7 Gyr ago and 30% about 3 Gyr ago. (Note that differences in the derived ages or times of the extended episodes of star formation are mainly caused by the use of different isochrone models). Monelli et al. (2003) suggest that the blue plume stars of Carina may be as young as 1 Gyr, and that the anomalous Cepheids of Carina may belong to an even younger population with an age of Gyr (see also Mateo, Hurley-Keller, & Nemec 1998; Poretti 1999; and McNamara 2000 for the identification and the discussion of these stars). The younger populations of Carina are more centrally concentrated than the extended distribution of the old stars (Harbeck et al. 2001; Monelli et al. 2003), similar to the trend seen in other dSphs.
Smecker-Hane et al. (1999) obtained Ca ii triplet (CaT) metallicities for 52 red giants in Carina. These authors argue that the narrow red giant branch of Carina results from an age-metallicity conspiracy in the sense that more metal-rich, but younger stars come to lie at the same location in the color-magnitude plane as older, metal-poor stars, and that photometry alone underestimates the true metallicity spread in Carina. Based on a photometric study, Rizzi et al. (2003) suggest that the narrow red giant branch is a consequence of the contribution of the dominant intermediate-age star-formation episode, while the contribution of the ancient episode is almost negligible.
All these findings underline the highly complex star formation history of Carina. There is not yet a satisfactory explanation why Carina would have experienced episodic star formation with extended quiescent episodes in between, and why its evolution was so different from that of other dSphs. As pointed out by Smecker-Hane et al. (1996), episodic accretion of fresh gas would be difficult given the inferred mass of Carina’s dark matter halo, and cooling and sinking back of previously ejected gas should have led to higher enrichment.
Our current knowledge of the detailed evolutionary history of nearby dwarf galaxies is mainly based on photometry supplemented by rather sparse spectroscopic information (e.g., Grebel 1999). However, this situation is now changing as a growing body of spectroscopic information is becoming available. Spectroscopy plays a particularly important role in permitting us to break the age-metallicity degeneracy that plagues purely photometric color-magnitude diagram analyses. When the metallicity of individual stars can be measured independently via spectroscopy, this information can be added to constrain photometric determinations of the star formation history. For gas-deficient galaxies like dSphs, our primary source of metallicity information are their red giants, which are now easily accessible for ground-based 8 to 10m-class telescopes. Ultimately, we may be able to derive detailed age-metallicity relations. Spectroscopic information for a sizable number of stars is gradually becoming available for an increasing number of dwarf galaxies (e.g., Côté, Oke, & Cohen 1999; Smecker-Hane et al. 1999; Guhathakurta, Reitzel, & Grebel 2000; Tolstoy et al. 2001; Pont et al. 2004). In the current study we add spectroscopic metallicities for several hundred red giants in the enigmatic dSph galaxy Carina. – Individual element abundance ratios in stars allow one to impose strong constraints on the modes of star formation in galaxies. The present study only deals with the measurement of overall stellar metallicities. The discussion and analysis of elemental abundances will be left for a future paper (Koch et al., in prep.).
Here we present a comprehensive spectroscopic study of Carina in order to analyze the overall metal content of several hundred red giants distributed throughout this dSph galaxy. In the current paper we analyze the metallicities of these stars in order to investigate several of the questions raised in the previous paragraphs. In particular, we wish to measure the true, spectroscopic mean metallicity and metallicity spread of Carina, derive its metallicity distribution function, investigate whether age and metallicity do indeed conspire, search for possible spatial gradients, and explore its evolutionary history taking into account its chemical enrichment. This paper is organized as follows: Sect. 2 introduces our data and describes the reduction procedures. In Sect. 3 we present the steps taken to calibrate our measured CaT equivalent widths and put them on a reference metallicity scale. The resulting metallicity distribution function (MDF) is presented in Sect. 4. In this Section we also discuss the implications for a possible age-metallicity relation in Carina. In Sect. 5, we investigate the existence of radial gradients in the MDFs. Sect. 6 then discusses the results in the context of simple models of chemical evolution. In Section 7, we summarize our findings.
2 Observations and reduction
In the course of the ESO Large Programme 171.B-0520(A) (PI: Gilmore), which is dedicated to the analysis of kinematic and chemical characteristics of Galactic dSphs, we observed five fields in Carina. These fields were selected such that we cover most of the area of Carina, but also go a bit beyond its nominal tidal radius. In these fields we obtained spectra of red giants with the goal of determining their metallicities through the well-established CaT method and of measuring their radial velocities to constrain the dark matter profile of Carina. In addition four globular clusters (NGC 3201, 4147, 4590 and 5904) were observed in order to permit us to place our CaT measurements on a scale of known reference metallicities (Rutledge et al. 1997a).
2.1 Target selection
Targets in Carina were chosen from photometry and astrometry obtained by the ESO Imaging Survey (EIS; see Nonino et al. 1999 for details) during the Pre-FLAMES era using the Wide Field Imager (WFI) at the 2.2 m telescope at La Silla, Chile. In the framework of EIS a number of different targets and fields was observed, including a region of four WFI fields, comprising approximately 1 deg2, located at the center of the Carina dSph. The reduced and transformed photometry is available from the EIS web pages at http://www.eso.org/science/eis/. For our spectroscopic study, we need to pick sufficiently bright objects. Moreover, the CaT method is only calibrated for intermediate-age and old red giants (Cole et al. 2004), so we chose luminous red giant branch (RGB) stars for the present work.
We selected our targets to cover magnitudes ranging from the tip of the RGB down to 3 mag below the RGB tip, thus down to 20.3 mag in V-band apparent magnitude. This corresponds to an absolute magnitude M 0.3 at an adopted apparent V-band distance modulus of 20.05 and a reddening of 0.05 (Mighell 1997). The actual values of the distance and reddening are not critical for the analysis in this paper, since we utilize apparent magnitudes relative to the horizontal branch (HB) locus. This differential approach also reduces the problems inherent in the EIS photometry, which go back to intrinsic problems of WFI photometry (see, e.g., Koch et al. 2004a,b). Our chosen RGB magnitude range is such that even for the faintest stars one is generally able to achieve high signal-to-noise ratios (S/N ) within a reasonable integration time and under good observing conditions (see below). Furthermore, we selected stars across the full width of the RGB (approximately 0.2 mag in B V) in order to ensure that we were unbiased with respect to metallicity or age, and include also potential extremely metal-poor and metal-rich giants (see the CMD in Fig. 1). With these constraints and with the limitations in possible positions on the fiber plate in order to avoid fiber crossings, a total number of 1257 stars was targeted. However, our photometric selection is inevitably contaminated by Galactic foreground stars.
For our calibration clusters, we used the standard fields of Stetson (2002). More than 80 red giant candidates altogether were picked from Stetson’s B- and V-band photometry. These clusters range in metallicity from approximately dex to dex in [Fe/H] (see Table 1 for details).
The available photometry of Carina targets is, in contrast to the Stetson list, in the Johnson-Cousins system provided by the EIS. Because of differences in the filter curves, this system differs from the standard Johnson-Cousin system as defined by Landolt’s (1992) and Stetson’s (2000) UBVRI standard stars. Conveniently, the observed EIS fields overlap with a standard star field in Carina (Stetson 2000) allowing a direct comparison between the EIS-photometry and that provided by Stetson. We obtained a linear transformation using the 258 stars in common, and used this to place both the calibration clusters and the science targets on Stetson’s homogeneous photometric standard system, avoiding any offsets between the different sets of photometry.
2.2 Data acquisition
Our observations were performed in visitor mode with the FLAMES (Fibre Large Array Multi Element Spectrograph) facility at the Very Large Telescope UT2 of the European Southern Observatory on Cerro Paranal in Chile. We observed during 22 nights spread over two semesters in 2003 and 2004 (as detailed in Table 2). We used the GIRAFFE spectrograph with both MEDUSA222For details on the individual components of the FLAMES spectrograph see http://www.eso.org/instruments/FLAMES/ fiber slits in “low-resolution” mode. We observed with grating L8 centered at the near-infrared CaT. This set-up provides a nominal resolving power of R=6500 at the center of the spectra and covers the wavelength range 8206–9400 Å. Each pointing is designed to handle 132 fibers, distributed across a field of view of 25 diameter. We dedicated about 20 fibers per configuration to blank sky for sky subtraction purposes.
We observed five different fields in and around the center of Carina (Table 3), which we observed with several configurations of the fiber positioning plates in order to maximize the number of targeted stars. The location of our fields is displayed in Fig. 2. The total required exposure time per configuration in Carina was six hours in order to reach a nominal S/N of at least 20. This S/N is needed to obtain highly accurate equivalent width (EW) measurements at our spectral resolution. The observations were split into single exposures of approximately one hour each to facilitate cosmic ray removal.
Most of the nights were clear and good sky conditions resulted in a typical seeing of 05-07, although the first run in 2003 February was hampered by non-photometric conditions and seeing reached values as bad as 2. Spectra with low S/N ratios were excluded from the chemical abundance analysis, where the lower limit for marginally measuring EWs is at , but were still useful for the kinematic analysis (Wilkinson et al., in prep.).
2.3 Data reduction
In the course of ESO’s standard calibration exposures, bias frames, fiber flatfield exposures and Th-Ar spectra from a calibration lamp were taken automatically during daytime. We reduced our data using version 1.09 of the FLAMES data-reduction system, girbldrs, and the respective pipeline girbldrs-pipe-1.05 (Blecha et al. 2000). The basic steps comprise bias correction as well as fiber localization and successive adjustment via the flatfield exposures.
Our spectra were extracted by summing up the pixel values along a virtual slit with a width of one pixel. The final re-binning to linear wavelength space was obtained with the master wavelength solution from the calibration Th-Ar spectra, which were reduced and extracted analogously to the science spectra. All spectra were flatfielded using the fiber flatfield exposures. The dedicated skyfibers were employed to calculate an average sky spectrum. This sky spectrum was then subtracted from the science spectra using the iraf-task skytweak333iraf is distributed by the National Optical Astronomical Observatory.. The resulting accuracy (the dispersion, in a 68% confidence interval, of the medians of the sky subtracted spectra in any exposure divided by the median sky) was typically better than 2%.
Finally, the dispersion-corrected, sky-subtracted spectra were co-added to enhance the S/N using scombine, where the frames were weighted by their individual S/N. The resulting frames were then continuum-normalized or rectified by a polynomial fit to the regions excluding the Ca and other stronger absorption lines. Thus the median S/N ratio obtained in this way lies at 33 pixel-1, reaching 200 pixel-1 for the brightest stars. Sample spectra of stars representative of our sample are shown in Fig. 3.
2.4 Membership: Radial velocities
In order to assess the membership of each target star, we made use of the individual radial velocities. The determination of accurate velocities by means of template spectra will be described in a forthcoming paper that will concentrate on the kinematic aspects of Carina (Wilkinson et al., in prep.). For the moment it should suffice to note that the Carina dSph galaxy clearly stands out against the Galactic foreground contamination, at a systemic heliocentric radial velocity of km s-1. Membership probabilities were derived by performing an error-weighted maximum likelihood fit of a Gaussian velocity distribution between 150 km s-1 and 300 km s-1. Rejecting 3 -outliers, the fit was iterated until convergence was reached, resulting in a mean heliocentric radial velocity of 223.9 km s-1 and a dispersion of 7.5 km s-1 (see Fig. 4). Taking into account our measurement uncertainties, this agrees very well with previous results. For example, Mateo (1998) quotes a systemic velocity of 2243 km s-1 and a central velocity dispersion of 6.81.6 km s-1 (based on 17 centrally located stars). Majewski et al. (2005) find a mean velocity of 222.8 km s-1 from 61 stars that extend out to 1.5 nominal tidal radii.
Depending on the chosen probability selection444In the present representation the 2, 2.5 and 3 limits correspond to membership probabilities of 0.0072, 0.0023 and 0.0006. to define a member, the total number of stars belonging to Carina varies from 471 (2 ), 501 (2.5 ) to 510 (3 ). The number of high-probability member stars with spectra sufficiently high to be useful for abundance determinations, as opposed to radial velocity determinations, is somewhat lower, namely 409 (2 ), 433 (2.5 ) and 437 (3 ).
Membership of red giants in the four calibration clusters was also determined via radial velocities. Only five stars (N4147-S370 and N4147-D57 in NGC 4147; M68-S155 and M68-S164 in NGC 4590; and M5-1046 in the cluster NGC 5904) were rejected due to their strongly discrepant () velocities.
3 Calibration of the metallicity scale
Determinations of accurate spectroscopic abundances require a well calibrated and widely applicable reference scale. The infrared lines of the singly ionized calcium ion at 8498, 8542, 8662 Å have become one of the spectral features of choice. These triplet lines are relatively easy to be distinguished, since they provide the strongest absorption lines in the near-infrared regime of RGB spectra. They also lie at a wavelength range where many CCDs have fairly high sensitivity, an advantage when trying to measure faint sources within reasonable exposure times. However, the CaT lines are generally considerably affected by strong night-sky emission lines, hampering accurate measurements for abundances in faint stars.
The use of the CaT for measuring metallicities of red giants in old, metal-poor populations was first established for simple stellar populations such as globular clusters (Armandroff & Zinn 1988; Armandroff & Da Costa 1991; Rutledge et al. 1997a). It was then also employed for mixed populations beyond the Milky Way halo, such as in dSphs (e.g., Suntzeff et al. 1993, Côté et al. 1999; Smecker-Hane et al. 1999; Guhathakurta et al. 1999; Tolstoy et al. 2001; Pont et al. 2004) and in irregular galaxies (e.g., Cole et al. 2005). Based on the comprehensive catalog of CaT data from Rutledge et al. (1997a), Rutledge, Hesser & Stetson (1997b) established a seminal calibration of Galactic globular cluster metallicities to the scales of Zinn & West (1984, hereinafter ZW) and Carretta & Gratton (1997, hereafter CG). Nevertheless, this empirical linear calibration is strictly valid only for old and metal poor red giants with [Fe/H] below 0.5 dex and ages no younger than 10 Gyr, since this is the parameter range covered by their calibrating globular clusters.
Smecker-Hane et al. (1999) carried out CaT spectroscopy of 52 red giants in Carina and found that most of the Carina RGB stars belong to a metal poor population around 2 dex. Still, the occurrence of a wide range of ages, particularly the dominant intermediate-age populations (Hurley-Keller et al. 1998; Rizzi et al. 2003), hence raises the question of an unbiased applicability of the CaT-technique to our Carina sample. However, recently the CaT calibration was extended to ages as young as 2.5 Gyr: Based on spectroscopy of red giants in Galactic globular and open clusters Cole et al. (2004) have shown that the CaT method has very little age sensitivity and can be reliably applied to composite populations with a range of ages. Since the dominant populations in the Carina dSph lie in the range of validity of the CaT method, we can trust that our measurements will yield consistent results for this galaxy.
3.1 Equivalent widths and reduced width
Equivalent widths of the three CaT lines were measured by means of the software kindly provided by A. Cole, which is a modified version of G. Da Costa’s ewprog-program (see Cole et al. 2004). We followed Suntzeff et al. (1993) in using line and continuum bandpasses as defined in Armandroff & Zinn (1988). These were shifted to take account of our derived radial velocities. As was proposed by Cole et al. (2004), each CaT line is best fit by the sum of a Gaussian and a Lorentz profile with a common nominal line center, which yields a progressively better fit to the line wings. Theoretical models show that the wings are most sensitive to changes in stellar parameters (e.g., Smith & Drake 1990). The final width was then derived by summing up the flux in the fit profile across the bandpass and errors were calculated automatically from the residuals of the fit.
In order to perform a self-consistent analysis of our calibration clusters and of the Carina data, we have to re-derive the relation between line strength and metallicities. We chose to exclude the weakest of the three lines at 8498 Å in order to minimize the errors in the final metallicity measurements. Thus we define the Ca linestrength as
The overall width of the CaT lines is not only a strong function of metallicity, but is also affected by stellar effective temperature and surface gravity. Isolating the strong sensitivity of the linestrength to metallicity is commonly achieved by defining a reduced equivalent width, which effectively removes the signature of surface gravity and effective temperature from the CaT strength (Rutledge et al. 1997b and references therein). Basically, correcting the linestrength for a star’s V-magnitude overcomes the sensitivity to gravity, since a given star on the RGB can have a range of radii depending on its evolutionary phase, although its mass remains nearly constant. The increase in radius toward the tip of the RGB results in a progressively lower surface gravity (and effective temperature), where the relation between gravity and V magnitude is close to linear (e.g., Cole et al. 2000). The additional introduction of the apparent magnitude of the horizontal branch, VHB, and the subsequent measurement of the difference between the apparent V-band magnitude of a given red giant and of VHB removes any remaining dependence on systemic distance and reddening.
As a comparison with the maps of Schlegel, Finkbeiner & Davis (1998) reveals, the Galactic foreground extinction toward the region of Carina is rather constant (with an r.m.s. scatter around the mean E(BV) of less than 0.01 mag across the projected area of the galaxy). Thus differential reddening is unlikely to significantly falsify the use of a single HB magnitude throughout this dSph. In a gas- and dust-deficient dSphs like Carina the internal reddening may be neglected. Furthermore, since the color range across the RGB is small and since we are using Johnson-Cousins colors, any extinction-induced magnitude differences for stars of different surface temperature may be entirely ignored (Grebel & Roberts 1995). Hence the reduced width, defined as
is basically the CaT-linestrength of an RGB star with the luminosity that it would have if it were located on the HB. This parameter is a very convenient metallicity indicator (Rutledge et al. 1997b), since in this form it is purely a function of metallicity.
Fig. 5 shows a plot of the measured linestrengths for each of the calibration clusters versus the respective magnitudes above their HBs. We adopted the HB magnitudes of our calibrators from Ferraro et al. (1999) in order to place all measurements on a consistent scale. Likewise, we defined the HB level of Carina via the magnitude of the lower envelope of the observed HB distribution in the region with 0.2 0.6. Hence we consistently use the determined VHB magnitude of 20.88 mag. This is the HB of the old population in the Carina dSph; the core-Helium-burning stars of the (dominant) younger/intermediate-age population form the prominent red clump at (see Monelli et al. 2003; Smecker-Hane et al. 1994). As was demonstrated by Cole et al. (2004) using the HB location of the old HB is perfectly acceptable also for intermediate-age populations. We discuss the (small) expected amplitude of the resulting systematic effect in the metallicities of the intermediate-age stars below.
A linear, error-weighted least-squares fit to the line measurements of all remaining 72 stars in the four globular clusters leads to the parameterization of the reduced width, W′, as
| (1) |
with an r.m.s. scatter around this averaged slope of 0.18 Å. In this equation, the given slope is the error-weighted mean of the individual slopes of each of the four clusters. The value for the slope derived by us is shallower than the one obtained in the original calibrations by Rutledge et al. (1997a), who measured it to be (0.640.02) Å mag-1 based on the CaT line strengths in 52 Galactic globular clusters. The more recent analysis of Cole et al. (2004), who included metal-rich open clusters, obtained an even steeper slope of . They suggest that the difference is due to an increase of slope with the mean metallicity of the calibrating clusters. Indeed, the mean metallicity of our four calibrating clusters, at dex on the CG scale ( dex on the ZW scale), is dex more metal-poor than the entire sample used by Rutledge et al. (1997a,b) (mean metallicities of dex on the CG scale, dex on the ZW scale, resp.), giving some support to the interpretation of Cole et al. (2004). Our calibrating clusters were selected to cover the expected metallicity range of the Carina dSph. Further, our analysis is based on only the two stronger CaT lines and uses a different line profile to that used by Rutledge et al. (1997a). In this paper, we shall consistently use our own calibration.
3.2 The metallicity scale
One of our observed globular clusters, NGC 4147, was not included in the common scale of Carretta & Gratton (1997). In order to exploit the maximum number of calibrators at hand, we nevertheless retained this cluster in our analysis by adopting the reference metallicities by Rutledge et al. (1997b), who also measured this cluster. These authors calibrated their sample of globular clusters to both the ZW and CG scales, and we also apply calibrations to both scales for the sake of consistency. Another calibration scale is provided by Kraft & Ivans (2003), who derive globular cluster metallicities based on the equivalent widths of Fe ii lines from high-resolution spectroscopy. Their scale yields metallicities that are about 0.2 dex more metal poor than those on the CG scale. However, we will present our results later on in terms of the calibration of Rutledge et al. (1997b) on the scale of CG unless stated otherwise, since this is the most common representation nowadays.
As Fig. 6 implies our observations yield well-defined linear relations between the reduced width W′ and [Fe/H] on both scales. We can thus infer the metallicities of our target stars using the following equations, which were obtained by an error-weighted least-squares fit:
| (2) | |||||
| (3) |
The bottom panel of Fig. 6 shows that there is only little scatter around the best-fit line. The r.m.s. scatter was calculated to be 0.02 dex for both metallicity scales. The uncertainties of our metallicities were estimated by propagation using the measurement errors in the EWs and uncertainties in the calibration (eqs. 1–3). The mean measured uncertainty in our metallicities amounts to 0.17 dex.
Red giants that were observed in Carina are shown in the V,W-plane of Fig. 7, together with some isometallicity lines to guide the eye. The wide range of values in the diagram already indicates a large spread in metallicities.
3.3 The possible impact of Ca abundance variations
The “metallicity” of a galaxy is customarily represented by its iron abundance [Fe/H] (or [Me/H]). Strictly speaking, Ca does not necessarily trace Fe as such, and Ca and Fe are formed in different nucleosynthesis processes. A potential inconsistency in applying the CaT technique to derive metallicities in a dSph in terms of [Fe/H] is the likely variation of the [Ca/Fe] ratio, both within the composite population of the dSph, and in between the calibrating clusters and the dSph stars. When converting from Ca to Fe abundances, one has to consider the different dependencies of [Fe/H] and [Ca/Fe] on the detailed star formation histories of the galaxy. It is far from straightforward to determine an unambiguous metallicity scale from single element measurements, particularly in a galaxy with a strongly episodic star formation history like Carina (see Cole et al. 2000; Tolstoy et al. 2001 for a detailed discussion and Gilmore & Wyse 1991 for models).
The measured [Ca/Fe] ratios for stars in globular clusters tend to be higher than the solar value (see the compilation in Carney 1996). Indeed, the values for three of our calibrating clusters (each based on only a handful of stars; Carney 1996) are (see also Table 1): (NGC 3201); (NGC 4590; only two stars); (NGC 5904). The few published elemental abundances for stars in the Carina dSph show some stars with similar values, but a tendency toward the lower values as expected for an extended star-formation history and incorporation of Fe from Type Ia supernovae. Shetrone et al. (2003) analyzed five stars that are known to be members from the radial velocity measurements of Mateo et al. (1993). They obtained values for [Ca/Fe] of: +0.14, , +0.20, +0.12 and , with a typical uncertainty of 0.05 (see Table 4). The values of [Fe/H] that were based on Fe lines in Shetrone et al.’s (2003) high-resolution spectra for these bright stars are: and respectively.
We note that uncertainties resulting from the unknown variations in the values of [Ca/Fe] for our target stars are likely to be up to 0.2 dex, based on these measured values. Such effects may in the future be overcome by calibrating W′ directly onto [Ca/H] (Bosler et al. 2002), making calibrations independent of star formation history, unlike the present technique. Our own high-resolution UVES spectra for approximately 30 stars will provide more elemental abundance information, which can be used to obtain an improved statistical estimate of the metallicity uncertainty (Koch et al., in prep.).
The high-resolution measurements from Shetrone et al. (2003) quoted above in fact also provide an external check of our metallicity estimates. Comparing their results with our data permits us to assess the internal precision of our measurements. Table 4 gives a comparison of [Fe/H] values from our analysis with the respective high-resolution data. The mean offset between both analyses is 0.09 dex (our CG scale) and 0.13 dex (ZW). After adjusting the individual deviations by these mean offsets, the absolute average difference amounts to 0.18 (0.25) dex. This offset is comparable to the order of uncertainty introduced by the [Ca/Fe] variations with respect to Galactic globular clusters as mentioned above, as well as our random measurement errors. Since we here juxtapose our Ca-based metallicities with the true iron abundances from Shetrone et al. (2003), the above quoted average difference well reflects the calibration uncertainty.
3.4 Additional potential sources of uncertainty
Furthermore, while ideally one would like to associate each RGB star with the appropriate HB level corresponding to a population of the age and metallicity of that RGB star, in practice we do not have sufficient information. Our adoption of a single HB for all the stars has the advantage of providing us with a well-defined magnitude and allows us to estimate the associated uncertainties. Since we adopted the HB appropriate for the oldest stars, and hence the least luminous HB, there will be a systematic effect. The expected result from normalizing with an HB of apparent magnitude , with the appropriate HB level for a given star, can be seen by the appropriate substitution in the relations for reduced width and [Fe/H] (eqs.1,3). We find a resulting error in [Fe/H] of dex. As noted earlier, the core He-burning phase of the intermediate-age population in the Carina dSph forms a prominent red clump, some 0.4 mag brighter than the old HB used in the normalization; thus for these stars . The resulting bias in [Fe/H] is dex, i.e., we estimate that these stars may be dex too metal-poor.
The small amplitude of this effect is confirmed by the analysis of Cole et al. (2004), where they experiment by assigning HB levels (absolute magnitudes) randomly to stars in different clusters. The variation in the luminosity of the clusters’ HB levels is 0.4 mag (see their Table 1). Using their derived slopes for the calibration relations, we find that the total amplitude of the change in metallicity estimates from using the appropriate HB level is 0.1 dex. This is just what is seen in their Figure 6. Basically the variation of HB level with age and metallicity amounts to dex in metallicity uncertainty, and in our case for most of the stars results in an underestimate by this amount. Of course we cannot say for which stars we are underestimating the metallicity without having age information. As we discuss below, in principle, with robust accurate models of the upper RGB, one could iteratively solve for age and metallicity. We did not attempt this procedure since the maximum amplitude of the effect, dex, is within the uncertainties of the models.
Of the target stars in the central field, 46 were observed repeatedly, i.e., during all of the runs. In these cases the finally quoted metallicity is the value derived from a combined spectrum, including all of the respective single spectra. However, in order to get an estimate of the random errors of the measurements, we compare in Fig. 8 the metallicities determined from spectra obtained on the individual observing runs in 2003 February and March to metallicities derived from combined spectra from all the available observations (see also Table 5). Some of the entries have metallicity estimates from the two runs differing by several sigma. It turns out that the median difference ([Fe/H] (1st run) [Fe/H] (2nd run)) between individual metallicity estimates amounts to 0.08 dex and the r.m.s. scatter of the different estimates from both runs totals 0.57 dex. Rejecting those objects deviating more than two standard deviations, namely two targets with particularly low S/N, from the sample we find a respective r.m.s. of 0.3 dex. This is larger than our overall random error estimate of 0.17 dex. But as noted before, this is mainly due to the first run being plagued by poor weather conditions, which was taken into account by weighting spectra by their S/N ratio during the co-addition. Consequently, the mean uncertainty of 0.24 dex for the targets observed during the first run compares to 0.13 dex for the same objects targeted in the second run.
4 The metallicity distribution
Metallicities derived for each individual star are given in Table 6. The resultant MDFs (see Fig. 9) turn out to be almost indistinguishable when using different membership selections (i.e., cutting at different levels in the radial velocity distributions), except for the varying total number. We used both a K-S test and the Kuiper statistics (Press et al. 1992) to test how different the MDFs are for different selection criteria. The Kuiper statistics is more sensitive to differences in the MDFs’ tails. The MDFs resulting from a , and 3-cut are consistent with each other at a level of greater than 99.9%. Hence we chose to maintain the limit of 3 as our membership criterion.
4.1 The width of the MDF
Histograms of the resulting metallicities on each of the two calibration scales for the sample of the 437 Carina red giants are displayed in Fig. 9. These show a broad distribution, peaked at a mean metallicity of dex (CG scale) or (ZW scale), respectively. The peak of the MDF is, however, more pronounced for the case of the CG-scale. The entire distribution’s formal full width at half maximum is 0.92 dex. The full metallicity range is 3.0 dex, as can be seen in Fig. 9. This spread can in part be attributed to the measurement uncertainties, but also an occurrence of several subpopulations with different peak metallicities cannot be rejected as a further source of the broadening (see below).
The formal 1 -width of the distribution is 0.39 dex, but since a best-fit single Gaussian is simply a mathematically convenient description, some of this width will also be due to measurement and calibration uncertainties. Subtracting our best estimates of these, namely 0.17 dex for the measurement error and 0.02 uncertainty in the slope of the calibration in quadrature, we estimate the width of our distribution to be 0.33 dex. One should keep in mind, however, that the combined effects of calibration uncertainties from the [Fe/H] calibration via reference clusters through systematic effects due to varying [Ca/Fe] and normalizing the HB level may amount up to 0.22 dex in total. Accounting also for these systematic errors, we obtain an estimate of the width of the MDF of dex. Furthermore, we recall that the dominant population in Carina is of intermediate age, reducing the possibility of star-to-star random variations of uncertainties introduced by the chosen HB level. Thus the width of the distribution is in fact dominated by physical variations in metallicity.
In the extreme tails of the MDF we find stars with metallicities approaching dex and near-solar metallicity, respectively. Note that our calibrating globular clusters only cover the initially expected range of metallicities in Carina, i.e., metallicities from to dex (Table 1). Hence the metallicities for the stars in the tails of the MDF are based in extrapolation of our calibration. Follow-up spectroscopy of these stars would be desirable in order to check whether this extrapolation yields reliable results and to further elucidate the chemical properties of these stars. If the overall [Fe/H] values for these stars are correct, they would be as metal-poor as the most metal-poor red giants found in other nearby dwarf galaxies (e.g., Shetrone et al. 2001). At the metal-rich end, a handful of them would be as metal-rich as the metal-rich population in the Sgr dSph (Bonifacio et al. 2004).
4.2 Comparison with previous studies
We can now compare the results of our large sample with previous results for large samples of red giants in Carina. From a sample of 52 RGB stars using the same method as here, Smecker-Hane et al. (1999) found the mean spectroscopic metallicity of Carina to be dex. These authors have not published individual metallicities, so we cannot perform a direct comparison between stars in common to both samples. Rizzi et al. (2003) analyzed the color distribution across the RGB, including a statistical correction for the star-formation history inferred from the main sequence turn-off region. They derived a photometry-based average metallicity of dex. These results on Carina are in reasonable agreement with our data if the quoted uncertainties and the widths of the distributions are taken into account.
Yet, metallicity estimates via purely photometrical isochrone fitting of RGB stars without age information lead to mean values that are typically more metal-rich by approximately 0.2 dex, as, e.g., in Monelli et al. (2003). These authors obtain their result by a direct comparison with the Galactic globular cluster NGC 1904, a single-age, single-metallicity system. For this object, different values for [Fe/H] are found in the literature, reaching from dex (Rutledge et al. 1997b on the CG scale) to dex (loc. cit., ZW-scale), whereas Harris (1996) cites an average metallicity of dex from all available sources. Still, one has to keep in mind that such a purely photometric fit to the RGB, without any input from an age distribution and age-metallicity relation, is subject to large uncertainties, as is underscored by Fig. 10. An additional source of uncertainty is the ability (or lack thereof) of many isochrone models to correctly reproduce the slopes of the red giant branch for very low or high metallicities (e.g., Fig. 5 in Grebel 1997 and Fig. 5 in Grebel 1999).
4.3 The shape of the MDF
The complex morphology of the CMD of the Carina dSph – both the multiple turn-off regions and the different He-burning phases – is compelling evidence for strongly varying star formation rates, in fact even for distinct episodes. The metallicity distribution of low-mass stars, as derived here, is rather insensitive to the details of the star formation history, particularly if elements dominated by massive stars are used (cf. Pagel 1997, Section 8.3.7). However, we have calibrated our CaT metallicities onto iron (assuming the same [Ca/Fe] in the calibrators as in our stars), which in systems with extended star formation can have a significant contribution from long-lived stars through Type Ia supernovae. Thus one can have enrichment in Fe without accompanying star formation. Hence with a star-formation history that consists of bursts of star formation with a real hiatus between the bursts, the Fe distribution can have “gaps” (no stars formed while Type Ia supernovae enriched the gas, prior to the next burst; cf. Gilmore & Wyse 1991). In order to test whether any substructure reflected in the MDF may provide evidence of star formation events, we applied the Shapiro-Wilk test for normality of a distribution (e.g., Royston 1995) to our observed binned MDF. As a result we can reject the hypothesis of an underlying single Gaussian normal distribution with a significance of 96%. On the other hand, the observed MDF is not expected to be strictly Gaussian, since star formation events do not naturally produce such normal distributions. In addition, we applied a KMM test for multiple populations imprinted in the MDF (Ashman, Bird, & Zepf 1994) to our unbinned data. Again, given our measurement uncertainties and the non-normality of astrophysical star formation events, one has to keep in mind that such a decomposition into multiple single Gaussian sub-populations is purely a formal procedure at this stage that does not necessarily have a physical meaning. We find that the case of four populations is significantly preferred against a one-population model at the 98.1% confidence level. Such a potential multi-population star formation history could also easily account for the MDF’s metal-rich extension. Yet a proper interpretation of the observed metallicities requires detailled modeling of the chemical evolution to which we will return in Sect. 6 below.
4.4 An age-metallicity relation?
The (lack of a) relation between the color of our targets and their metallicity is demonstrated in Fig. 10. This figure shows that there is no obvious trend in the sense that predominantly metal-poor stars are not concentrated along the blue ridgeline of the RGB, and the metal-rich stars are not concentrated at the red ridgeline (in contrast to the LMC data of Cole et al. 2005, where such a trend is clearly visible). A metallicity-color trend would have been expected to result from a direct comparison with fiducials of globular clusters of known metallicities, i.e., for populations of roughly the same age but different metallicities, as indicated by the RGB fiducials for four globular clusters of Sarajedini & Layden (1997) in Fig. 10 (left panel). The ridgelines from Sarajedini & Layden cover a wide range of colors in the CMD, corresponding to a metallicity range from to dex for old and nearly coeval populations. On the right-hand side we show three isochrones with ages and metallicities that roughly correspond to what may be expected from the three main star formation episodes in Carina. Again there is no clear correlation with the data points. Hence it is clear that one cannot derive the metallicity of an individual star from its color and magnitude on the RGB when dealing with a mixed-age population as present in Carina, nor can a metallicity distribution directly be inferred from the color distribution in this case.
The existence of an age-metallicity relation can be inferred from the fact that the giants appear to be equally widely spread across the RGB regardless of their metallicity. At a given age, metal-poor stars are in general bluer than their metal-rich counterparts owing to the reduced opacity in their photospheres. Conversely, the older stars tend to have redder colors at a given [Fe/H]. Hence, in order to produce the counteracting trend with both metal-rich and metal-poor stars at the same locus in the CMD, the metal-poor stars necessarily have to be older, whereas the more metal-rich giants have to be of younger age.
If one had reliable models of the upper RGB in the observational plane, one could in principle derive age estimates for our stars of known metallicity, from finding the best-matched isochrone at that metallicity. However, the small offset in color with age at the relevant intermediate ages, combined with sensitivity to the largely unknown elemental abundance mix and He content limits the usefulness of this exercise. An age distribution and age-metallicity relations are better derived from turn-off stars, provided that the photometry is at a sufficient level of accuracy. Such an analysis with high-resolution spectra will be subject of a forthcoming paper (Koch et al., in prep.).
5 Radial variations
Previous analyses based on wide-area photometric surveys and thus derived CMDs have shown that the stellar populations in the Carina dSph feature different spatial distributions. Mighell (1997) proposed a strong central concentration of intermediate-age stars from a comparison between a deep HST CMD of the center and ground-based data that covered a wider area. This was confirmed by Harbeck et al. (2001) via wide-field photometry. Harbeck et al. found a pronounced central concentration of the prominent intermediate-age red clump stars in comparison to the old HB. This was subsequently also seen in the photometric study of Monelli et al. (2003). Harbeck et al. (2001) discarded the presence of a significant radial gradient in Carina’s old HB morphology out to its nominal tidal radius.
Our large dataset allows us to address the issue of population gradients by looking for radial gradients in the MDFs. For this purpose we investigated the MDFs as a function of elliptical radius , where and denote the distances along the major and minor axis, respectively555Here we adopted a position angle of (65 and an ellipticity of (Irwin & Hatzidimitriou 1995).. There is no obvious strong radial gradient in the resulting scatter plot of metallicity against elliptical radial coordinate, as shown in Fig. 11 (top panel). A simple linear fit yields a gradient of ( dex arcmin-1.
However, as Fig. 11 (bottom left) implies, there is a clear radial tendency in the respective MDFs to be seen when the data are split into three radial bins. The annuli have been chosen to cover everything within one core radius (r8), then everything within rc to 2rc, and from 2rc to the nominal tidal radius at 288. The ratio of the total number of stars in the annuli is approximately 5:4:1. Fig. 11 shows the single MDFs, represented by normalized generalized histograms, which were obtained from the density distributions of our [Fe/H] measurements by convolution with a Gaussian distribution accounting for the individual measurement errors.
The MDF of the innermost region is already rather broad with a suggestion of both lower and higher metallicities and an indication of a secondary population around approximately dex. However, the MDF of the middle annulus is peaked at a metallicity that is at least 0.1 dex lower than in the inner region and shows an increase of the potential secondary peak at dex. Considering the overall uncertainties in the metallicity measurements, a shift by, e.g., 0.1 dex may not appear significant. However, if we take into account that the uncertainties of the metallicity measurements should be the same everywhere in Carina and that there is no obvious reason why these uncertainties should introduce systematic offsets from one bin to another, these differences may be meaningful.
A K-S test revealed a probability of 98.2% that the MDF from the innermost ring is drawn from the same parent population as the entire sample. Based on the same statistical test, we cannot reject the hypothesis that also the middle annulus is drawn from the same population as the innermost annulus and the entire sample, resp. (at significances of 35% and 50%).
The MDF of the outermost region, on the other hand, shows several peaks, the broadest and most distinct of which is more metal-poor by 0.3 dex than that the one seen in the innermost region. In contrast, the location of a second peak at an [Fe/H] of 1.6 dex is consistent with the MDFs’ peaks in the inner parts of the galaxy to within the measurement uncertainties. Using a K-S test we find that the probability that the outer and inner MDFs are drawn from the same distribution is less than 4% and we can therefore reject this hypothesis. Moreover, the probability of the outer region being compatible with the entire sample is at the 6% level. Hence there do seem to be indications of spatial (and indeed radial) variations in Carina’s stellar populations.
This gradient is also reflected in the cumulative metallicity distributions shown in the bottom right panel of Fig. 11. In a complementary manner, a cumulative plot of the giants’ galactocentric radii clearly indicates a preferential central concentration of the metal-rich component (Fig. 12) compared to the more metal-poor population – a K-S yields a probability that the metal-poor and metal-rich populations take the same spatial distributions of 10%.
The evidence of a concentration of the metal-rich component in Carina that we found is consistent with earlier findings that the intermediate-age stars favor the inner regions, in particular if one takes into consideration that we have likely underestimated their metallicity by dex due to the adoption of the old HB in the reduced CaT width. Thus, if the metal-rich component can be attributed to the intermediate-age population and, vice versa, the metal-poor RGB stars in Carina are to be identified as predominantly belonging to an old population, then the radial variations and progressive shifts of the peaks found in the spectroscopically determined MDFs underscore previous findings of centrally concentrated starbursts based on CMD analyses (Harbeck et al. 2001). A reason for such a concentration could be stronger cooling and dissipation of more metal-enriched gas. It may also indicate that star-forming material can be more easily retained at the center of a dSph’s shallow potential well.
6 Implications for chemical evolution
As the present-day observed MDF of a stellar system reflects its entire integrated history it is relatively insensitive to the star-formation history (SFH). The SFH cannot be unequivocally derived unless these data are combined with accurate ages (and preferably also individual elemental abundances to constrain the actual modes of star formation, see, e.g., Shetrone, Côté, & Sargent 2001). However, the gross properties of the MDF can provide insight into certain aspects of the chemical evolution of a system, such as the importance of gas flows. Following long-standing practice, we gain a basic insight by consideration of variants of the simple model of chemical evolution (e.g., Pagel 1997, Chapter 8) and refer the detailed stochastical modeling to a future paper (Wyse et al., in preparation).
In such basic models, the mean metallicity of long-lived stars at late stages (close to gas exhaustion) is representative of the true nucleosynthetic yield, , if all metals are retained in the system. If the system is not closed and if outflows are possible, the mean metallicity reflects the ‘effective yield”, a combination of true yield and effects of loss of metals (see Hartwick 1976): outflows at a constant factor times the star-formation rate reduce the mean metallicity below the true yield by approximately this factor , . Thus, assuming an invariant stellar initial mass function (and thus invariant true yield ), the low peak metallicity of our derived MDF, compared to say the G dwarfs in the solar neighborhood, which peaks at dex (e.g., Nordström et al. 2004 and references therein) suggests a strong influence of outflows, presumably driven by Type II supernovae. Indeed, this has been the basic model for the evolution of gas-poor dwarf galaxies since Sandage (1965).
6.1 Outflows
A modified simple model with flows overpredicts the number of metal-poor stars (leading to a “G-dwarf problem” just as in applications of this model to the solar neighborhood). Having normalized the fit of our models in Fig. 13 to the total number of stars observed, the discrepancies between the prediction and observations are marginal at dex, but become significant below dex, where the deviations progressively exceed the -level. The fit may be improved by adopting some non-zero initial metallicity (or prompt initial enrichment (PIE), e.g., Tinsley 1975), understood in the present-day context as being from pre-galactic Population III stars. The predicted metallicity distributions for a simple model with outflows, and with PIE, are shown compared to the full Carina data set in Fig. 13. The respective best-fit parameters to our data are for the simple model, and and in the case of PIE. One should note that these models retain the instantaneous recycling approximation and so are not expected to provide a perfect fit to our iron-based MDF. Further, the radial variations discussed in Section 5 imply that the system is not in fact well-mixed at all times, another assumption inherent to the simple model. Given these caveats, the models provide an adequate fit. There are still some discrepancies present, such as the prominent main peak at [Fe/H]CG dex, which deviates by more than 2 (taken as ) from the model curves and a single Gaussian. Note, however that this peak is not distinct in the MDF on the ZW scale. As noted above, any potential substructure may reflect variations in star formation activity. That such variations must have occurred is obvious from the presence of multiple main-sequence turn-offs and the decline in star formation activity in between. Indeed, not just outflows are implicated, but also inflows to sustain star formation over many Gyr (see, e.g., Silk, Wyse & Shields 1987, Lin & Murray 1998; Carigi, Hernandez & Gilmore 2002; Dong et al. 2003).
6.2 Infall and the gravitational potential
Mac Low & Ferrara (1999) investigated starburst-driven mass loss from dwarf galaxies. They distinguish between gas that is blown out but retained by the gravitational potential well of their host galaxy, and gas that is entirely blown away and lost from the galaxy. Lin & Murray (1998) and Dong et al. (2003) present a model for episodic star formation in dwarf galaxies like Carina according to which enriched gas is blown out but eventually re-accreted once it has cooled down sufficiently, leading to a new episode of star formation. Smecker-Hane et al. (1996) argued that episodic accretion of fresh gas seemed unlikely since the mass of Carina’s dark halo seemed to be too low; also Carigi et al. (2002) note that in the case of external accretion the previously measured tidal radius (Irwin & Hatzidimitriou 1995) needs to be larger, i.e., the potential well needs to be deeper to permit the accretion of external gas.
Odenkirchen et al. (2001) demonstrated that tidal radii inferred from photographic data may underestimate the angular extent and nominal limiting radius of dwarf galaxies. For Carina we may expect a firmer limit on the dark matter halo from the analysis of its radial velocity dispersion profile (Wilkinson et al., in prep.). Here we note that our spectroscopic data indicate that four red giants whose radial velocities are consistent with membership in Carina lie beyond of its nominal limiting stellar radius (Fig. 11, top panel). Three of these stars have metallicities consistent with the trend seen in the outskirts of Carina. Claims suggesting the existence of “extratidal” stars around Carina have also been made by Kuhn, Smith, & Hawley (1996) and Majewski et al. (2000, 2005). Whether this implies that Carina is not in virial equilibrium and in the process of losing/having lost substantial amounts of mass as suggested in these studies is beyond the scope of the present paper. However, if Carina were a remnant of a once substantially more massive galaxy then the simple chemical models discussed here would need to be modified.
6.3 A model with outflows and infall
A more sophisticated model (Lanfranchi & Matteucci 2004) is also plotted in Fig. 13. This special model uses as input a SFH consistent with the CMD and hence incorporates two major epochs of outflows and respective winds associated with two main star formation episodes, each with a duration of 3 Gyr. The crucial model parameters were fit such as to reproduce Carina’s total stellar mass, the gas content and observed [/Fe] abundance ratio for five stars. The distribution resulting from this model holds strictly for the true elemental iron abundance as measured from high-resolution spectroscopy, rather than overall metallicity that we derived from our CaT measurements (but see the discussion in Section 3.3). The Lanfranchi & Matteucci model for Carina shows one dominant metallicity peak, demonstrating the insensitivity of the resulting MDF to the details of the SFH, even for Fe. There is again acceptable agreement between this particular model (in a non-instantaneous recycling approximation) and our observations, particularly when observational uncertainties are included (right panel, Fig. 13). However, as before there are also remaining discrepancies, e.g., associated with the metal-rich and metal-poor tails (with a persisting G-dwarf problem).
The Carina model of Lanfranchi & Matteucci tries to reproduce individual element abundance measurements for five stars and has hence constraints only over the narrow metallicity range of these five stars. Lanfranchi & Matteucci’s “best” model (see Fig. 13) requires a wind efficiency of some seven times the SFR and high star formation efficiency, leading to solar metallicities within only a few Gyr. This is at odds with our MDF in combination with the photometrically inferred ages of the different star formation episodes in Carina (e.g., Hurley-Keller et al. 1998; Monelli et al. 2003). Lanfranchi & Matteucci point out that their results also differ from the SFH derived by Tolstoy et al. (2003) on the basis of the five stars mentioned before. Adding more data points (Koch et al., in prep.) should aid in imposing stronger constraints.
The spatial variation of the SFH of the Carina dSph and other dSphs (e.g., Harbeck et al. 2001), plus evidence for cold sub-structures in dSphs (e.g., Kleyna et al. 2004; Wilkinson et al. 2004) suggest that star formation and chemical evolution should be modeled on small scales. We will present the details of such models in a future paper (Wyse et al., in prep.).
7 Summary and Discussion
Carina is the only dSph known to have undergone distinct, well-separated episodic star formation. The dominant episodes of star formation took place at intermediate ages. It is not yet understood what caused the repeated cessation and delayed re-start of star formation in this enigmatic dSph. In the framework of a VLT Large Programme aiming exploring the chemical evolution, kinematics, and dark matter content of Galactic dSphs, we have derived CaT metallicities for 437 red giants in the Galactic dSph Carina. Our spectroscopic sample exceeds the previously largest published dataset (Smecker-Hane et al. 1999) by a factor of . Our targets cover the entire surface area of Carina and allow us to investigate also radial metallicity variations.
While we are using Ca as a tracer of overall metallicity (“[Fe/H]”), we are well-aware of the different dependencies of [Fe/H] and [Ca/Fe] on the detailed star-formation history of a galaxy, and of possible differences between Ca and Fe abundances in globular clusters and dwarf galaxies. We compare our results to direct Fe measurements from the few existing high-resolution spectra in the literature and arrive at the same conclusions as previous authors: The widely used CaT method is indeed a powerful tool for efficient measurements of overall metallicities and for studies of overall trends in the metallicity distribution of intermediate-age and old populations in nearby galaxies as presented here. However, uncertainties in the metallicity measurements for individual red giants may amount to up to more than 0.2 dex when using the CaT method.
The resulting metallicity distribution function shows a wide range of metallicities spanning dex in [Fe/H]. The MDF peaks at a mean metallicity of dex (CG scale) or (ZW scale), respectively. Our mean metallicity on the CG scale is slightly more metal-rich as compared to earlier spectroscopic CaT studies (e.g., Smecker-Hane et al. 1999). The entire distribution’s formal full width at half maximum is 0.92 dex. We proposed that some of this spread might be attributed to the occurrence of an extended SF and self-enrichment, resulting in several subpopulations with different peak metallicities. The question whether these subpopulations of different metallicities are manifestations of corresponding distinct episodes of SF requires a combination of deep photometric and spectroscopic data and detailled modelling and will be left for a future paper. The MDF and its peaks change as one goes to larger distances from Carina’s center. Generally, it shows a trend for more pronounced metal-poor subpopulations with increasing distance.
We found a higher concentration of metal-rich, presumably intermediate-age stars toward the inner regions of the galaxy as compared to more metal-poor stars. Metal-poor stars are, however, detected throughout the entire galaxy. This trend matches the observed central concentration of intermediate-age stars in Carina (Harbeck et al. 2001), supporting that the more metal-rich stars are also the younger ones. Another argument in support of an age-metallicity relation in Carina is the location of the more metal-rich stars on the RGB: Their metallicities in combination with their photometric colors are inconsistent with these stars belonging to the old population.
Our data thus confirm earlier suggestions that Carina shows an age-metallicity degeneracy in the sense that higher metallicities counteract the effects of younger ages. This conspiracy in turn leads to the observed narrow RGB. These findings and the considerable metallicity spread rule out scenarios in which Carina’s unusual episodic star formation history was caused by the repeated accretion of pristine, unenriched gas.
Comparing our MDFs to simple chemical evolution models such as a closed-box model and prompt initial enrichment reveals a G-dwarf problem at low metallicities, but a fairly close approximation of the shape of the MDF at high metallicities. The metallicity peak of the MDF itself is not reproduced by these simple models. One should bear in mind that the peak is most prominent on the CG scale, but does not show up in the MDF based on the scale of ZW. The early star formation in Carina that can still be traced by present-day red giants must have occurred from pre-enriched gas (e.g., by Population III stars). A better match to the MDF can be obtained through more sophisticated models that include infall and outflows. The steep rise toward higher metallicities and its culmination in a prominent peak are qualitatively well reproduced by the models of Lanfranchi & Matteucci (2004), but the subsequent decline toward even higher metallicities is too rapid compared to our observationally derived MDF. Still, the qualitatively good overall agreement between these models and the observations is encouraging. One possible explanation for the repeated onset and cessation of the extended star formation episodes in Carina is the possible re-accretion of previously blown-out, but not blown-away, enriched gas (see, e.g., Lin & Murray 1998; Dong et al. 2003). The predicted time scales for blow-out, cooling, and re-accretion are consistent with the observed long pauses in star formation activity.
Refined chemical evolution models will be presented in a forthcoming paper (Wyse et al., in prep.), complemented by results from high-resolution spectroscopy and a new derivation of the star formation history of Carina that combines spectroscopic and photometric information (Koch et al., in prep.). This will also lead to a quantitative age-metallicity relation. Furthermore, future papers will investigate whether different subpopulations in Carina show different kinematics (Wilkinson et al., in prep.).
A handful of the red giants whose radial velocities make them likely Carina members lie beyond the nominal tidal radius of Carina. Spectroscopic evidence for potential “extratidal” stars has also been found by Majewski et al. (2000, 2005), raising the question whether Carina is a dark-matter-dominated, bound dSph with an even larger limiting radius than previously thought (see, e.g., Odenkirchen et al. 2001) or a disrupted remnant. Carina’s orbit as inferred from its proper motion indicates that its perigalactic distance to the Milky Way is rather close ( kpc), suggesting that Carina needs to be strongly dark-matter dominated in order to have survived these passages (Piatek et al. 2003). The radial velocity dispersion profiles that will be derived as part of of our VLT Large Programme will help to elucidate the extent of Carina’s dark matter halo (Wilkinson et al., in prep.).
In spite of its unusual star formation history, Carina fits in well with the metallicity-luminosity relation of other dSph galaxies. The metallicity-luminosity relation of dSphs is offset from that of dIrrs such that dSphs have higher mean stellar metallicities for a fixed optical luminosity. This offset suggests that star formation in young dSphs was more vigorous than in young dIrrs (Grebel et al. 2003). As is the case for other dSphs, Carina is thus unlikely to simply be a stripped former irregular galaxy. However, Piatek et al. suggest that Carina is currently near apogalacticon and that its pericentric passages bring it very close to the Milky Way, while its star formation history does not seem to be correlated with its orbital motion. Nonetheless, Carina’s orbit would seem to suggest that in addition to intrinsic effects such as feedback, its evolution must also have been influenced by externally induced mass loss. Such mass loss may have been induced through tidal interactions with the Milky Way and/or through ram pressure stripping when passing through the denser regions of the Galaxy’s gaseous halo. There appears to be a correlation between present-day Galactocentric distance and the fraction of intermediate-age populations (van den Bergh 1994; Grebel 1997, 1999). Carina with its distance of 94 kpc and its prominent intermediate-age population seems to fit into this correlation rather well. However, one may ask whether this is merely fortuitous for this galaxy,if one considers Carina’s proposed short pericentric distance and the resulting eccentric orbit. Clearly, a comprehensive exploration of Carina’s history will have to take into account both internal and external influences, its detailed chemical evolution, its age structure, its mass and mass distribution, its internal kinematics and its orbit.
References
- (1) Armandroff, T.E., & Zinn, R. 1988, AJ, 96, 92
- (2) Armandroff, T.E., & Da Costa, G.S. 1991, AJ, 101, 1329
- (3) Ashman, K.A., Bird, C.M., & Zepf, S.E. 1994, AJ, 108, 2348
- (4) Blecha, A., Cayatte, V., North, P., Royer, F., & Simond, G. 2000, Data-reduction software for GIRAFFE, the VLT medium-resolution multi-object fiber-fed spectrograph, in Optical and IR Telescope Instrumentation and Detectors, ed. I.Masanori, & A.F.Moorwood, SPIE, 4008, 467
- Bonifacio et al. (2004) Bonifacio, P., Sbordone, L., Marconi, G., Pasquini, L., & Hill, V. 2004, A&A, 414, 503
- Bosler et al. (2002) Bosler, T.L., Smecker-Hane, T.A., & McWilliam, A. 2002, in Observed HR Diagrams and Stellar Evolution, ASP Conf. Ser. 274, eds. T. Lejeune, & J. Fernandes (San Francisco: ASP), 252
- Cannon et al. (1977) Cannon, R. D., Hawarden, T. G., & Tritton, S. B. 1977, MNRAS, 180, 81
- Cannon et al. (1981) Cannon, R. D., Niss, B., Norgaard-Nielsen, H. U. 1981, MNRAS, 196, 1
- (9) Carigi, L., Hernandez, X., & Gilmore, G. 2002, MNRAS, 334, 117
- (10) Carney, B. 1996, PASP, 108, 900
- (11) Carretta, E., & Gratton, R. 1997, A&AS, 121, 95
- (12) Cole, A., Smecker-Hane, T.A., & Gallagher, J.S 2000, AJ, 120, 1808
- (13) Cole, A., Smecker-Hane, T.A., Tolstoy, E., Bosler, T.L., & Gallagher, J.S 2004, MNRAS, 347, 367
- (14) Cole, A., Tolstoy, E., Gallagher, J.S., & Smecker-Hane, T.A. 2005, AJ, 129, 1465
- Côté et al. (1999) Côté, P., Oke, J. B., & Cohen, J. G. 1999, AJ, 118, 1645
- Dong et al. (2003) Dong, S., Lin, D. N. C., & Murray, S. D. 2003, ApJ, 596, 930
- (17) Ferraro, F.R., Messineo, M., Fusi Pecci, F., De Palo, M.A., Straniero, O., & Limongi, M. 1999, AJ, 118, 1738
- Gallagher et al. (2003) Gallagher, J. S., Madsen, G. J., Reynolds, R. J., Grebel, E. K., & Smecker-Hane, T. A. 2003, ApJ, 588, 326
- (19) Gilmore, G. & Wyse, R.F.G. 1991, ApJ, 367, L55
- Grebel (1997) Grebel, E. K. 1997, Reviews in Modern Astronomy, 10, 27
- Grebel (1999) Grebel, E. K. 1999, The Stellar Content of the Local Group, IAU Symp. 192, eds. P. Whitelock & R. Cannon (San Francisco: ASP), 17
- Grebel (2000) Grebel, E. K. 2000, Star formation from the small to the large scale, 33rd ESLAB Symposium, ESA-SP 445, eds. F. Favata, A.A. Kaas, & A. Wilson (Noordwijk: ESA), 87
- Grebel (2001) Grebel, E. K. 2001, A&SSS, 277, 231
- Grebel (2005) Grebel, E. K. 2005, Stellar Astrophysics with the World’s Largest Telescopes, AIP Conf. Proc. Vol. 752, eds. J. Mikolaewska & A. Olech (New York: AIP), 161
- Grebel & Roberts (1995) Grebel, E. K., & Roberts, W. J. 1995, A&AS, 109, 293
- Grebel, Gallagher, & Harbeck (2003) Grebel, E. K., Gallagher, J. S., & Harbeck, D. 2003, AJ, 125, 1926
- Grebel & Gallagher (2004) Grebel, E. K., & Gallagher, J. S. 2004, ApJ, 610, L89
- Guhathakurta et al. (2000) Guhathakurta, P., Reitzel, D. B., & Grebel, E. K. 2000, Proc. SPIE, 4005, 168
- Harbeck et al. (2001) Harbeck, D., et al. 2001, AJ, 122, 3092
- Harris (1996) Harris, W.E. 1996, AJ, 112, 1487 (2003 version of the Milky Way globular cluster catalog at http://physwww.mcmaster.ca/ harris/mwgc.dat)
- (31) Hartwick, F.D.A., 1976, ApJ, 209, 418
- Hurley-Keller et al. (1998) Hurley-Keller, D., Mateo, M., & Nemec, J. 1998, AJ, 115, 1840
- (33) Irwin, M., & Hatzidimitriou, D. 1995, MNRAS, 277, 1354
- Klessen et al. (2003) Klessen, R. S., Grebel, E. K., & Harbeck, D. 2003, ApJ, 589, 798
- (35) Kleyna, J.T., Wilkinson, M.I., Evans, N.W., & Gilmore, G.F. 2004, MNRAS, 354, 66
- Koch et al. (2004a) Koch, A., Grebel, E. K., Odenkirchen, M., & Caldwell, J. A. R. 2004a, The Messenger, 115, 37
- Koch et al. (2004b) Koch, A., Odenkirchen, M., Grebel, E. K., & Caldwell, J. A. R. 2004b, AN, 325, 299
- Kraft & Ivans (2003) Kraft, R.P., & Ivans, I.I. 2003, PASP, 115, 143
- Kuhn et al. (1996) Kuhn, J. R., Smith, H. A., & Hawley, S. L. 1996, ApJ, 469, L93
- Lanfranchi & Matteucci (2004) Lanfranchi, G. A., & Matteucci, F. 2004, MNRAS, 351, 1338
- Lin & Murray (1998) Lin, D.N.C., & Murray, S.D. 1998, in Dwarf Galaxies & Cosmology, XXXIIIrd Rencontres de Moriond, eds. T.X. Thuan et al. (Paris: Editions Frontières), 433
- Mac Low & Ferrara (1999) Mac Low, M., & Ferrara, A. 1999, ApJ, 513, 142
- Majewski et al. (2000) Majewski, S. R., Ostheimer, J. C., Patterson, R. J., Kunkel, W. E., Johnston, K. V., & Geisler, D. 2000, AJ, 119, 760
- (44) Majewski, S.R., et al. 2005, AJ, in press (astro-ph/0503627)
- (45) Mateo, M., Olszewski, E.W., Pryor, C., Welch, D.L., Fischer, P. 1993, AJ, 105, 510
- Mateo (1997) Mateo, M. 1997, in The Nature of Elliptical Galaxies, ASP Conf. Ser. Vol. 116, eds. M. Arnaboldi, G. S. Da Costa, & P. Saha (San Francisco: ASP), 259
- (47) Mateo, M. 1998, ARA&A, 36, 435
- Mateo et al. (1998) Mateo, M., Hurley-Keller, D., & Nemec, J. 1998, AJ, 115, 1856
- McNamara (2000) McNamara, D. H. 2000, PASP, 112, 1096
- Mighell (1990a) Mighell, K. J. 1990a, A&AS, 82, 207
- Mighell (1990b) Mighell, K. J. 1990b, A&AS, 82, 1
- (52) Mighell, K.J. 1997, AJ, 114, 1458
- Monelli et al. (2003) Monelli, M., et al. 2003, AJ, 126, 218
- Mould et al. (1982) Mould, J. R., Cannon, R. D., Frogel, J. A., & Aaronson, M. 1982, ApJ, 254, 500
- Mould et al. (1983) Mould, J. R., & Aaronson, M. 1983, ApJ, 273, 530
- Nonino et al. (1999) Nonino, M., et al. 1999, A&AS, 137, 51
- (57) Nordström, B.,et al. 2004, A&A, 418, 989
- Odenkirchen et al. (2001) Odenkirchen, M., et al. 2001, AJ, 122, 2538
- (59) Pagel, B. E. J. 1997, Nucleosynthesis and chemical evolution of galaxies (Cambridge: Cambridge University Press)
- Pont et al. (2004) Pont, F., Zinn, R., Gallart, C., Hardy, E., & Winnick, R. 2004, AJ, 127, 840
- Piatek et al. (2003) Piatek, S., Pryor, C., Olszewski, E. W., Harris, H. C., Mateo, M., Minniti, D., & Tinney, C. G. 2003, AJ, 126, 2346
- Poretti (1999) Poretti, E. 1999, A&A, 346, 487
- (63) Press, W. H., Teukolsky, S. A., Vetterling, W. T., & Flannery, B. P. 1992, Numerical Recipes in FORTRAN: The Art of Scientific Computing (2nd ed.; Cambridge: Cambridge University Press)
- Rizzi et al. (2003) Rizzi, L., Held, E. V., Bertelli, G., & Saviane, I. 2003, ApJ, 589, L85
- royston (1995) Royston, P. 1995, Appl. Stat., 44, 547
- (66) Rutledge, G.A., Hesser, J.E., Stetson, P.B., Mateo, M., Simard, L., Bolte, M., Friel, E.D., & Copin, Y. 1997a, PASP, 109, 883
- (67) Rutledge, G.A., Hesser, J.E., Stetson, P.B. 1997b, PASP, 109, 907
- (68) Saha, A., Monet, D. G., & Seitzer, P. 1986, AJ, 92, 302
- (69) Sarajedini, A., & Layden, A. 1997, AJ, 113, 264
- (70) Sandage, A. 1965, in ‘The Structure & Evolution of Galaxies’, Solvay 1964 (London: Interscience) p83
- (71) Schlegel, D.J., Finkbeiner, D.P., & Davis, M. 1998, ApJ, 500, 525
- Shetrone et al. (2001) Shetrone, M. D., Côté, P., & Sargent, W. L. W. 2001, ApJ, 548, 592
- (73) Shetrone, M., Venn, K.A., Tolstoy, E., Primas, E., Hill, V., & Kaufer, A. 2003, AJ, 125, 684
- (74) Silk, J., Wyse, R.F.G. & Shields, G. 1987, ApJ, 322, L59
- (75) Smecker-Hane, T.A., Stetson, P.B., Hesser, J.E., & Lehnert, M.D. 1994, AJ, 108, 507
- Smecker-Hane et al. (1996) Smecker-Hane, T. A., Stetson, P. B., Hesser, J. E., & Vandenberg, D. A. 1996, in From Stars to Galaxies: the Impact of Stellar Physics on Galaxy Evolution, ASP Conf. Ser. Vol 98, eds. C. Leitherer, U. Fritze-von Alvensleben, & J. Huchra (San Francisco: ASP), 328
- Smecker-Hane et al. (1999) Smecker-Hane, T.A., Mandushev, G.I., Hesser, J.E., Stetson, P.B., Da Costa, G.S, & Hatzidimitriou, D. 1999, in Spectrophotometric Dating of Stars and Galaxies, ASP Conf. Ser. Vol. 192, eds. I. Hubeny, S. Heap, & R. Cornett (San Francisco: ASP), 159
- (78) Smith, G. & Drake, J.J. 1990, A&A, 231, 125
- (79) Stetson, P.B. 2000, PASP, 112, 925
- (80) Suntzeff, N.B., Mateo, M., Terndrup, D.M., Olszewski, E.W., Geisler, D., & Weller, W. 1993, ApJ, 418, 208
- (81) Tinsley, B.M. 1975, ApJ, 197, 159
- (82) Tolstoy, E., Irwin, M.J., Cole, A.A., Pasquini, L., Gilmozzi, R., & Gallagher, J.S. 2001, MNRAS, 327, 918
- (83) Tolstoy, E., Venn, K.A., Shetrone, M., Primas, F., Hill, V., Kaufer, A., & Szeifert, T. 2003, AJ, 125, 707
- van den Bergh (1994) van den Bergh, S. 1994, ApJ, 428, 617
- (85) Wilkinson, M.I., Kleyna, J.T., Evans, N.W., Gilmore, G.F., Irwin, M.J., & Grebel, E.K. 2004, ApJ, 611, L21
- Yi et al. (2003) Yi, S. K., Kim, Y., & Demarque, P. 2003, ApJS, 144, 259
- (87) Zinn, R., & West, M.J. 1984, ApJS, 55, 45
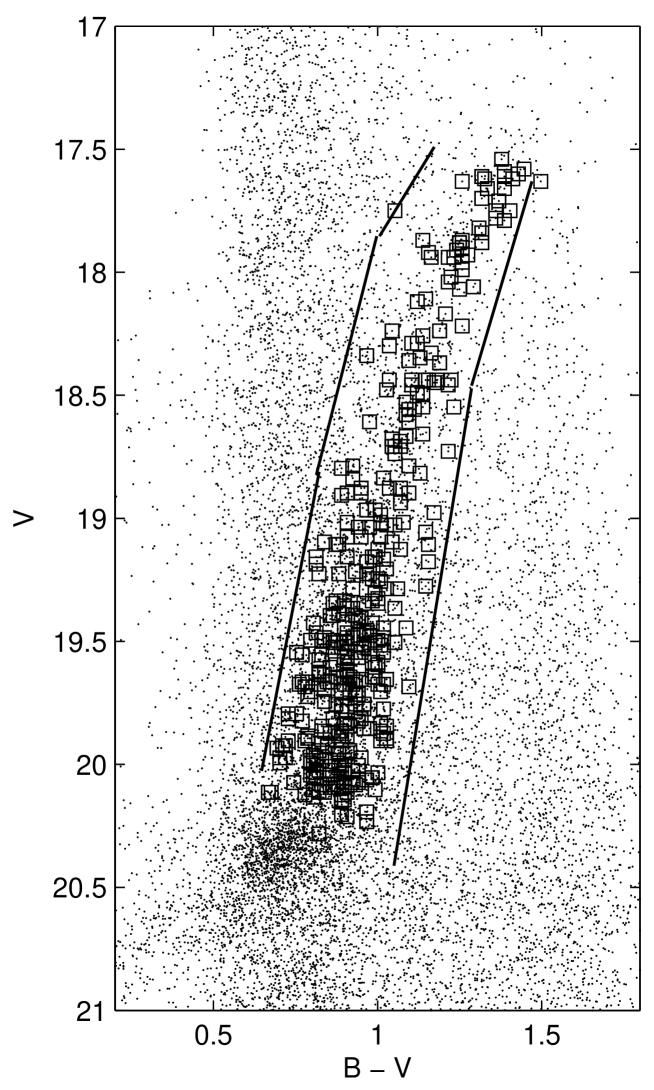
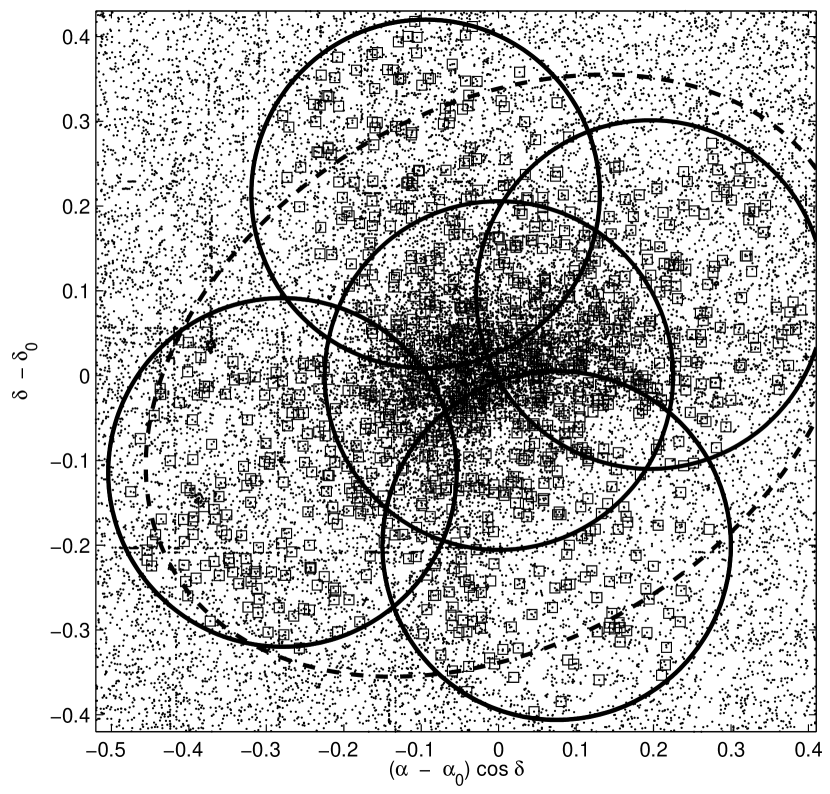
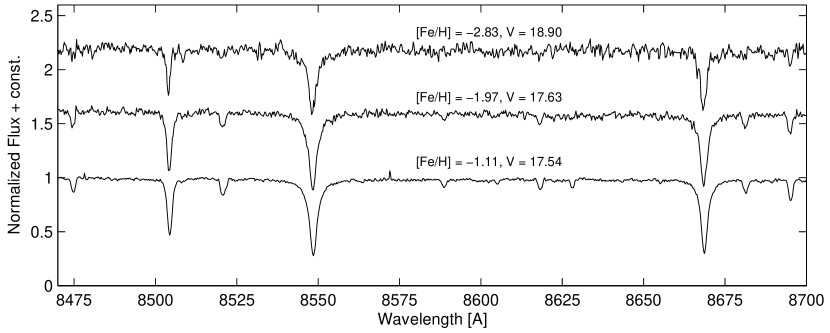
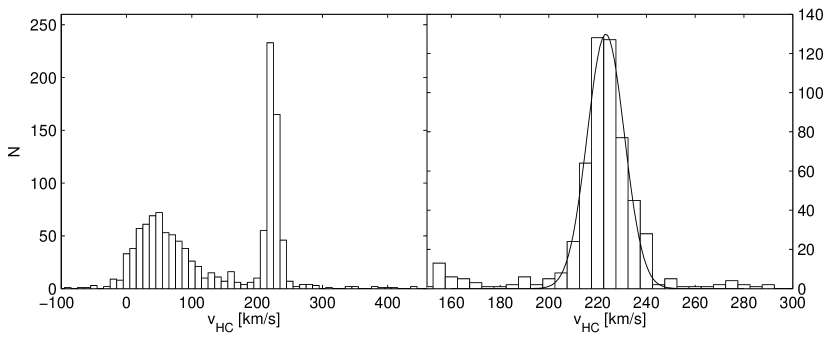
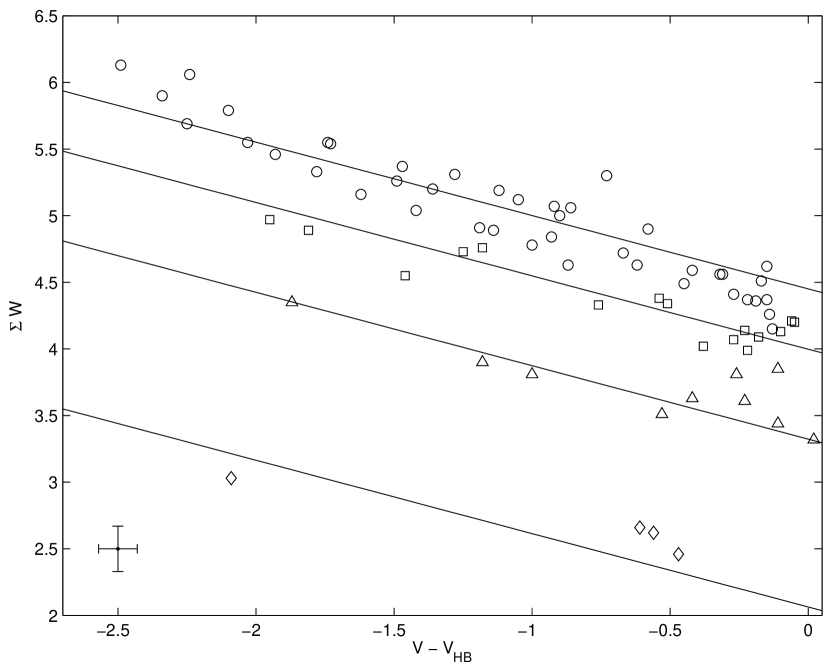
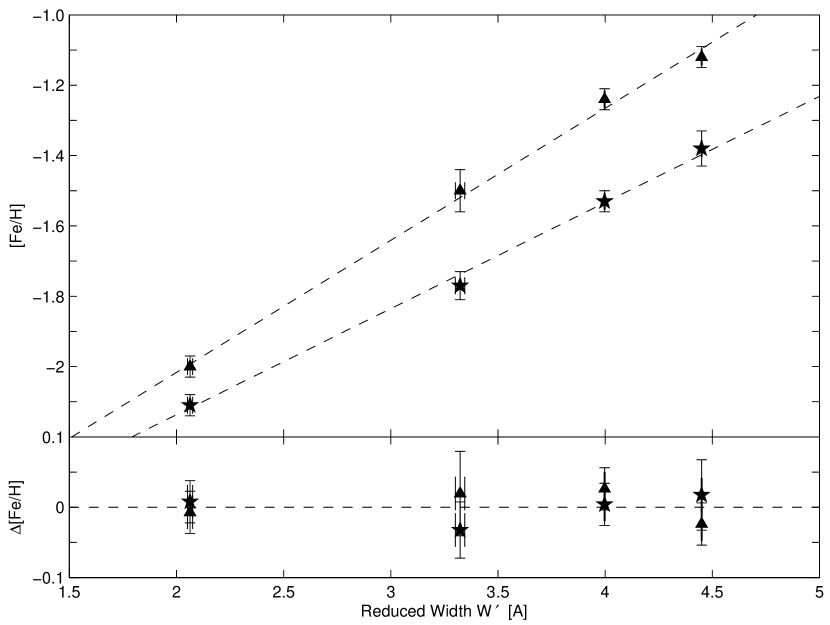
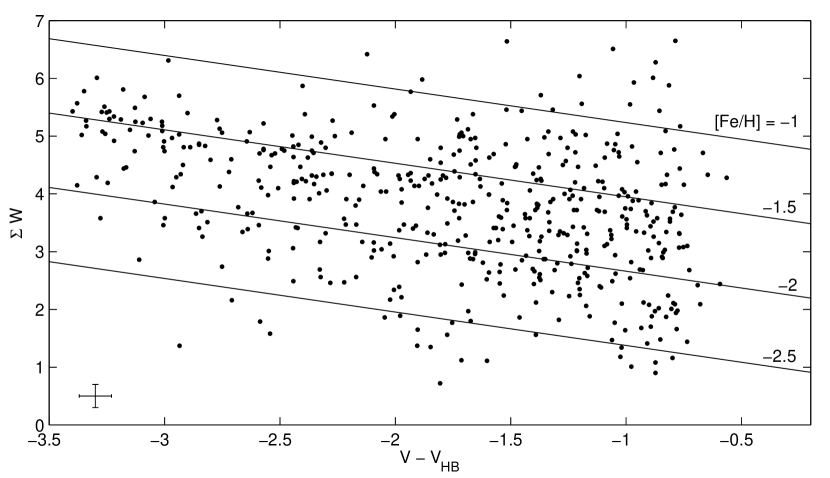
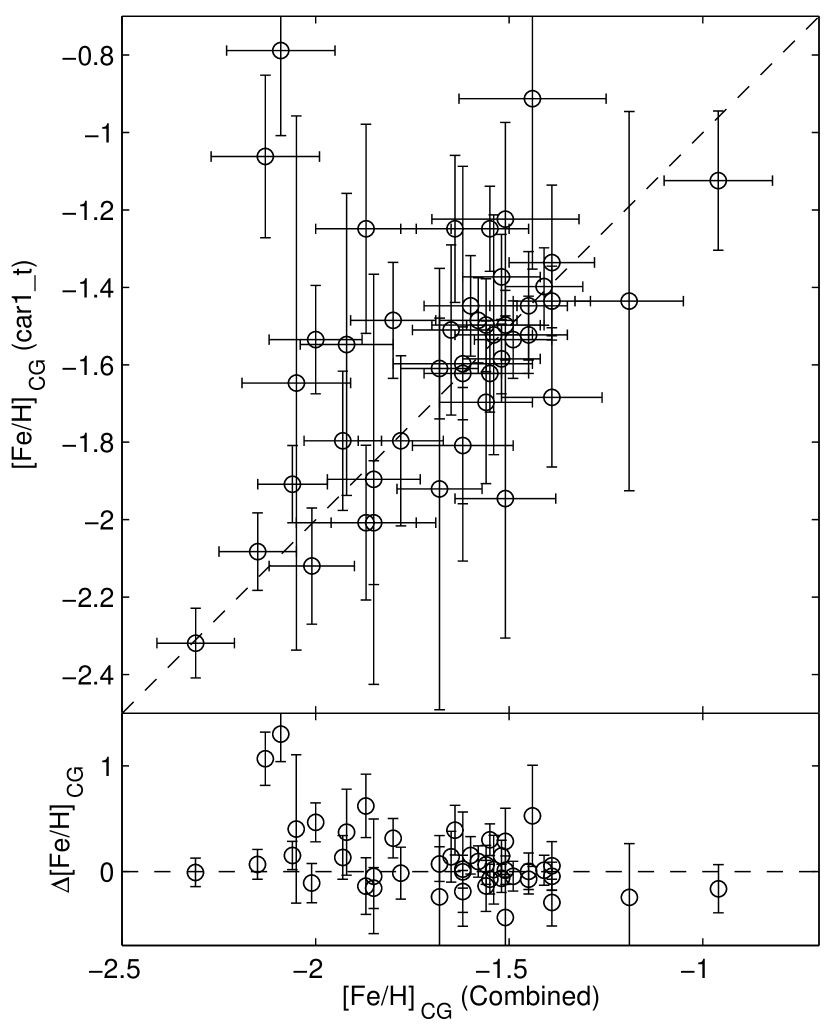
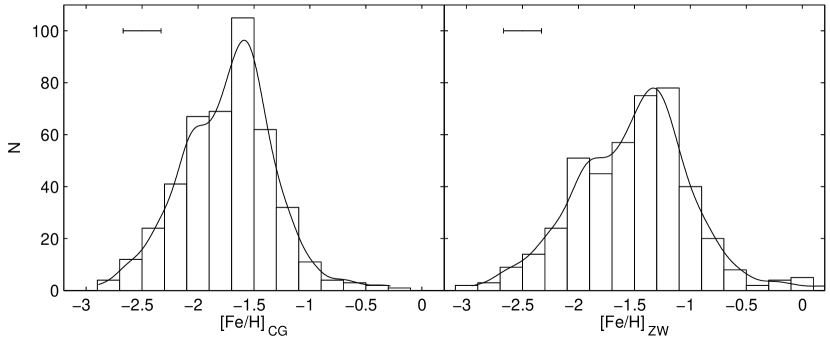
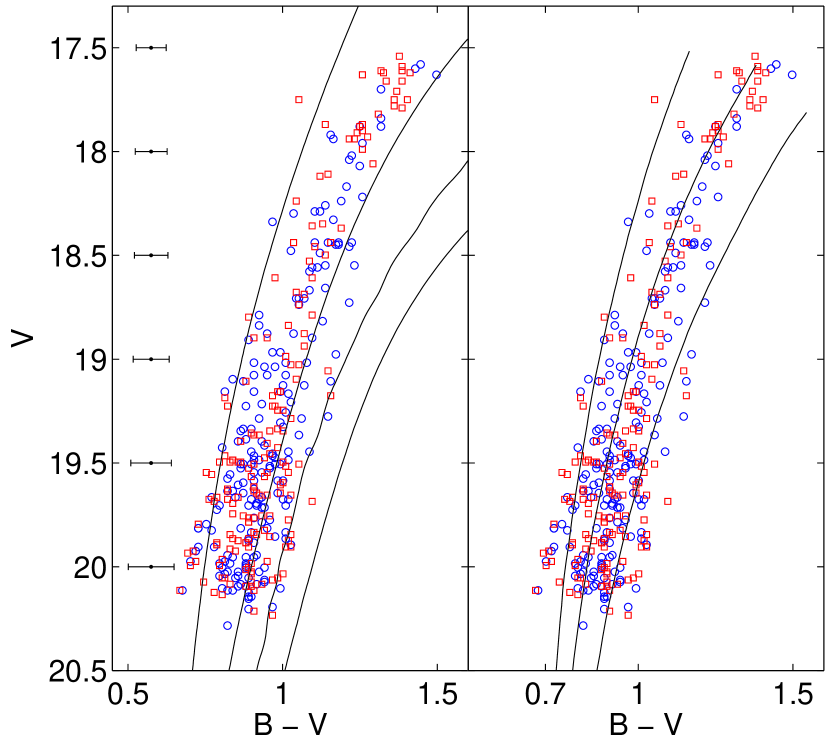
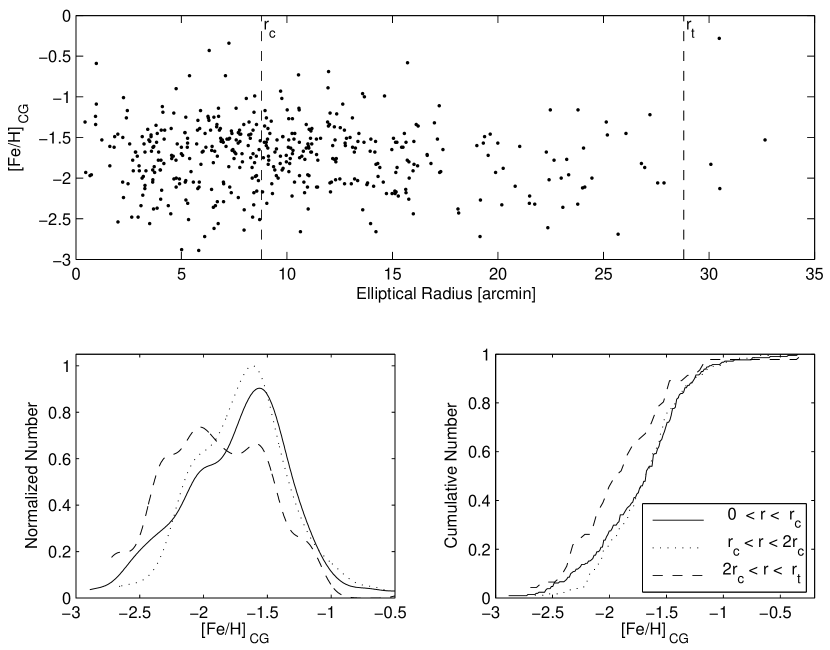
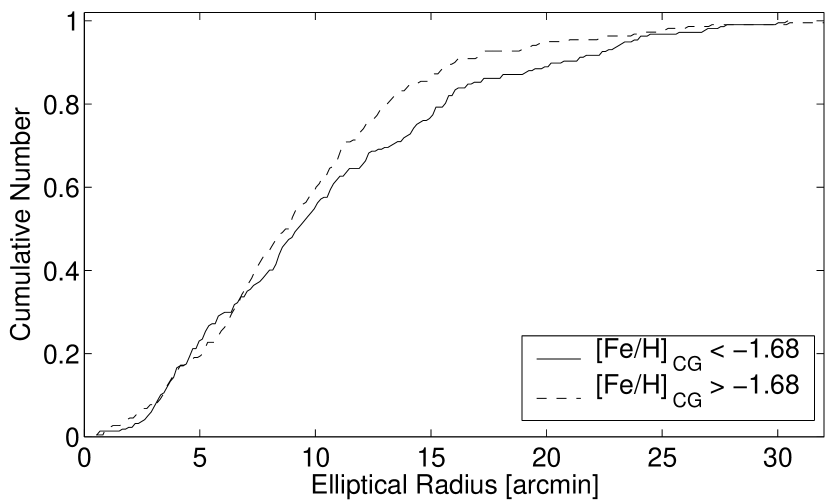
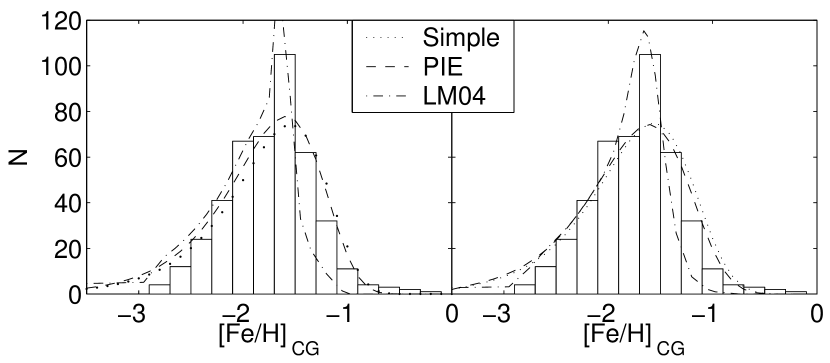
| Cluster | (J2000) | (J2000) | [Fe/H]ZW,R97 | [Fe/H]CG,R97 | (mM)V | E (B V) | VHB | [Ca/Fe] | References |
| NGC 3201 | 10 17 36.8 | 46 24 40 | 1.53 0.03 | 14.21 | 0.21 | 14.74 | 0.11 | 1,2,3,4 | |
| NGC 4147 | 12 10 06.2 | +18 32 31 | 1.77 0.04 | 16.48 | 0.02 | 16.95 | 1,2,3 | ||
| NGC 4590 | 12 39 28.0 | 26 44 34 | 2.11 0.04 | 15.19 | 0.04 | 15.75 | 0.32 | 1,2,3,4 | |
| NGC 5904 | 15 18 33.8 | +02 04 58 | 1.38 0.05 | 14.46 | 0.03 | 15.13 | 0.21 | 1,2,3,4 | |
| References. — (1) Harris (1996); (2) Rutledge et al. (1997); (3) Ferraro et al. (1999); (4) Carney (1996) | |||||||||
| Date | Field (Configuration) | Total exp. time [s] |
|---|---|---|
| 21 Feb 2003 | Center | 1560 |
| NGC 3201 | 627 | |
| 22 Feb 2003 | Center | 9900 |
| NGC 4147 | 2400 | |
| 03 Mar 2003 | Center | 9497 |
| 04 Mar 2003 | Center | 7800 |
| NGC 5904 | 3600 | |
| 05 Mar 2003 | Center | 7800 |
| NGC 4590 | 1800 | |
| NGC 3201 | 1200 | |
| 22 Dec 2003 | NE (1c) | 14981 |
| NE (1b) | 12975 | |
| 23 Dec 2003 | Center (2b) | 13630 |
| Center (2a) | 13213 | |
| 24 Dec 2003 | SW (1e) | 14401 |
| SW (1d) | 13172 | |
| 25 Dec 2003 | NW (1e) | 14333 |
| NW (1d) | 13113 | |
| 26 Dec 2003 | NE (2b) | 14470 |
| NE (2a) | 13001 | |
| 27 Dec 2003 | SE (1e) | 20488 |
| SE (1d) | 13333 | |
| 28 Dec 2003 | SW (2a) | 19469 |
| SW (2b) | 235 | |
| NW (1e) | 7933 | |
| 29 Dec 2003 | SW (2b) | 13421 |
| Center (1e) | 13553 | |
| 30 Dec 2003 | Center (1d) | 13694 |
| Center (2a) | 13393 | |
| 21 Feb 2004 | SE (2a) | 19677 |
| 22 Feb 2004 | SE (2b) | 15162 |
| NGC 4590 | 4794 | |
| NGC 3201 | 3598 | |
| 23 Feb 2004 | NW (2a) | 10824 |
| NGC 4590 | 6596 | |
| 24 Feb 2004 | NW (2b) | 10833 |
| NGC 3201 | 7196 | |
| 25 Feb 2004 | NE (1d) | 23481 |
| 26 Feb 2004 | NE (1e) | 10884 |
| 27 Feb 2004 | NE (2a) | 10931 |
| 28 Feb 2004 | NE (2b) | 10635 |
note — Labels in brackets refer to different configurations
on the fiber positioning plates, thus aiming at different targets.
Only nights relevant for Carina observations are listed.
| Field | (J2000) | (J2000) |
|---|---|---|
| Center | 06 41 36.8 | 50 57 58 |
| NW | 06 41 00.8 | 50 45 06 |
| NE | 06 42 51.1 | 50 52 50 |
| SW | 06 39 50.0 | 51 04 49 |
| SE | 06 42 05.3 | 51 10 00 |
| NGC 3201 | 10 17 36.8 | 46 24 40 |
| NGC 4147 | 12 10 09.6 | +18 35 511 |
| NGC 4590 | 12 39 28.0 | 26 44 33 |
| NGC 5904 | 15 18 03.5 | +02 06 41 |
| Star ID | [Ca/Fe] | [Fe/H] | [Fe/H]CaT,ZW | [Fe/H]CaT,CG | |
|---|---|---|---|---|---|
| (Mateo 1993) | EIS-ID | (Shetrone et al. 2003) | (This work) | ||
| M2 | LG04a_003764 | ||||
| M3 | LG04a_001419 | ||||
| M4 | LG04a_001673 | ||||
| M10 | LG04d_006644 | ||||
| M12 | LG04a_007126 | ||||
note — Metallicities given for the Shetrone et al. (2003) stars are the weighted means from [Fe I/H] and [Fe II/H].
| Star | [Fe/H]CG, first run | [Fe/H]CG, second run | [Fe/H]CG | [Fe/H]CG, combined spectra |
|---|---|---|---|---|
| LG04a_000030 | ||||
| LG04a_000377 | ||||
| LG04a_000451 | ||||
| LG04a_001042 | ||||
| LG04a_001111 | ||||
| LG04a_001142 | ||||
| LG04a_001170 | ||||
| LG04a_001234 | ||||
| LG04a_001298 | ||||
| LG04a_001313 | ||||
| LG04a_001364 | ||||
| LG04a_001390 | ||||
| LG04a_001426 | ||||
| LG04a_001556 | ||||
| LG04a_001558 | ||||
| LG04a_001608 | ||||
| LG04a_001734 | ||||
| LG04a_001875 | ||||
| LG04a_001899 | ||||
| LG04a_001910 | ||||
| LG04a_001917 | ||||
| LG04a_002065 | ||||
| LG04a_002169 | ||||
| LG04a_002181 | ||||
| LG04a_003952 | ||||
| LG04a_004179 | ||||
| LG04b_002633 | ||||
| LG04b_005294 | ||||
| LG04c_000626 | ||||
| LG04c_000710 | ||||
| LG04c_003085 | ||||
| LG04c_004153 | ||||
| LG04c_004227 | ||||
| LG04c_004308 | ||||
| LG04c_006477 | ||||
| LG04c_006479 | ||||
| LG04c_006573 | ||||
| LG04c_006593 | 20 | |||
| LG04c_006601 | 31 | |||
| LG04c_006788 | ||||
| LG04c_007260 | ||||
| LG04d_003625 | ||||
| LG04d_004311 | ||||
| LG04d_004565 | ||||
| car1_t100 | ||||
| car1_t102 |
| Star666 The nomenclature is such that LG04a–d designates the EIS-fields targeting Carina (EIS-team, priv. comm.) followed by the number in the respective input catalog. | (J2000) | (J2000) | r [] | V | B V | W [Å] | [Fe/H]R97,ZW | [Fe/H]R97,CG | [Fe/H] | |
|---|---|---|---|---|---|---|---|---|---|---|
| LG04a_00002 | 06 42 59 | 51 00 06 | 15.4 | 19.50 | 0.86 | 3.81 | 1.82 | 1.62 | 0.16 | 1.31 |
| LG04a_00008 | 06 42 31 | 50 59 59 | 10.6 | 18.55 | 1.13 | 4.01 | 1.92 | 1.74 | 0.09 | 1.31 |
| LG04a_00017 | 06 42 26 | 50 59 43 | 09.6 | 19.71 | 0.94 | 2.72 | 2.11 | 1.99 | 0.39 | 1.32 |
| LG04a_00030 | 06 41 58 | 50 59 32 | 04.8 | 17.93 | 1.27 | 4.29 | 1.94 | 1.77 | 0.10 | 1.27 |
| LG04a_00046 | 06 40 52 | 50 59 12 | 07.4 | 19.56 | 0.83 | 2.30 | 2.27 | 2.18 | 0.20 | 1.46 |
| LG04a_00064 | 06 42 52 | 50 58 48 | 13.4 | 19.86 | 0.84 | 4.08 | 1.68 | 1.45 | 0.33 | 1.31 |
| LG04a_00111 | 06 41 04 | 50 57 41 | 05.8 | 19.57 | 0.83 | 2.68 | 2.15 | 2.03 | 0.47 | 12.92 |
| LG04a_00115 | 06 42 08 | 50 57 32 | 05.2 | 19.70 | 0.90 | 2.63 | 2.14 | 2.02 | 0.11 | 1.30 |
| LG04a_00160 | 06 41 56 | 50 56 51 | 03.3 | 19.29 | 0.92 | 3.17 | 2.05 | 1.91 | 0.10 | 1.55 |
| LG04a_00189 | 06 41 27 | 50 56 05 | 03.6 | 18.84 | 1.02 | 4.04 | 1.86 | 1.67 | 0.21 | 1.29 |
note — This Table is published in its entirety in the electronic edition of the Astronomical Journal. A portion is shown here for guidance regarding its form and content. and W denote the elliptical radius and the CaT linestrength, respectively. [Fe/H] and the respective uncertainty are given following eqs. 1,2. Finally, denotes the targets’ membership probability.