The Nature of the Peculiar Virgo Cluster Galaxies NGC 4064 and NGC 4424
Abstract
Using extensive kinematical and morphological data on two Virgo cluster galaxies undergoing strong nuclear star formation, we show that ram pressure stripping and gravitational interactions can act together on galaxies that have recently fallen into clusters.
We present a detailed study of the peculiar HI-deficient Virgo cluster spiral galaxies NGC 4064 and NGC 4424, using CO 1-0 interferometry, optical imaging and integral field spectroscopic observations, in order to learn what type of environmental interactions have affected these galaxies. Optical imaging reveals that NGC 4424 has a strongly disturbed stellar disk, with banana-shaped isophotes and shells. NGC 4064, which lies in the cluster outskirts, possesses a relatively undisturbed outer stellar disk and a central bar. In both galaxies H emission is confined to the central kiloparsec, and originates in bar-like strings of luminous star-forming complexes surrounded by fainter filaments.
Complexes of young blue stars exist beyond the present location of ongoing star formation, indicating rapidly shrinking star-forming disks. Disturbed dust lanes extend out to a radius of 2-3 kpc, much further than the H and CO emission detected by us, although similar to the blue stellar complexes. CO observations reveal bilobal molecular gas morphologies, with H emission peaking inside the CO lobes, implying a time sequence in the star formation process. Gas kinematics reveals strong bar-like non-circular motions in the molecular gas in both galaxies, suggesting that the material is radially infalling. In NGC 4064 the stellar kinematics reveal strong bar-like non-circular motions in the central 1 kpc, and stars supported by rotation with V/ 1 beyond a radius of 15/1.2 kpc. On the other hand, NGC 4424 has extremely modest stellar rotation velocities ( 30 ), and stars are supported by random motions as far out as we can measure it, with V/=0.6 at r=18/1.4 kpc. The ionized gas kinematics in the core are disturbed and possibly counterrotating. The observations suggest that the peculiarities of NGC 4424 are the result of an intermediate-mass merger plus ram pressure stripping. In the case of NGC 4064, the evidence suggests an already stripped “truncated/normal” galaxy that recently suffered a minor merger or tidal interaction with another galaxy. Observations of the present star formation rate and gas content, suggest that these galaxies will become small-bulge S0s within the next 3 Gyr. We propose that galaxies with “truncated/compact” H morphologies such as these are the result of the independent effects of ram pressure stripping, which removes gas from the outer disk, and gravitational interactions such as mergers, which heat stellar disks, drive gas to the central kpc and increase the central mass concentrations. Together these effects transform the morphology of these galaxies.
1 Introduction
Ever since the times of Hubble & Humason (1931), observations have shown that the galaxy populations in clusters differ from those in the field. Spitzer & Baade (1951) and Gunn & Gott (1972) suggested that dynamical processes within clusters might be responsible for transforming the initial galaxy population. The discover of the “morphology-environment” relationship (Dressler 1980), the “Butcher-Oemler effect” (Butcher & Oemler 1978), and more recently the results of the MORPHS collaboration (Dressler et al. 1997, Poggianti et al. 1999) suggest that the environment in cluster of galaxies is responsible for the morphological evolution of galaxies, with spirals becoming lenticular and redder. Several mechanisms have been proposed as the cause of this evolution, such as merging (e.g; Hernquist 1992, Naab & Burkert 2003, van Dokkum et al. 1999), ICM-ISM stripping (Gunn & Gott 1972; Nulsen 1982; Schulz & Struck 2001; Vollmer et al. 2001; van Gorkom 2004, Kenney et al. 2004), and high speed tidal interactions (also called “harrassment” Moore et al. 1996). However, it is not yet clear which processes are the main drivers of cluster galaxy evolution. Merging has been shown to be important in the formation of large ellipticals such as cD galaxies, boxy and disky elliptical galaxies, and disturbed spirals (Bournaud et al. 2004). It has been argued that the high relative velocities between galaxies in virialized clusters make merging an unlikely mechanism (Ghigna et al. 1998). However, mergers can occur in the unrelaxed part of clusters where the local velocity dispersion may be much lower than that within the virialized inner portion. Conversely, ICM-ISM stripping, would be effective in removing the ISM from galaxies in the virialized portion of the cluster. In fact, under some conditions of ICM density and relative velocities, ram pressure stripping could be strong enough as to completely remove the gas. High velocity tidal interaction or “harassment” (Moore et al. 1996) may make faint Sc-Sd galaxies evolve into dwarf galaxies by tidally removing the stars, although the disks are not completely destroyed (Mastropietro et al. 2004). In the case of Sa-Sb galaxies, their concentrated potential help them maintain their stability under harassment, but this process could disturb their disks and increase the scale height of the stars (Moore et al. 1999). Finally, there is recent evidence that galaxy transformation is not only restricted to core of the clusters. Simulations show that Sc/Sd galaxies under hierarchical growth and galaxy harrassment undergo a significant transformation even in the outskirts of the clusters (Mastropietro et al. 2004). Recent studies find galaxies with reduced star formation far from the centers of some clusters (e.g. Balogh et al 1998, Lewis et al 2002, Gómez et al 2003, Nichol 2004). Solanes et al. (2001) find HI deficient galaxies located out to 2 Abell radii in the Virgo cluster. These may be galaxies that were locally stripped at surprisingly large cluster distances, or stripped in the core then rebounded to large clustercentric distances.
The Virgo cluster is the nearest moderately rich cluster (distance of 16 Mpc, Jacoby et al. 1992; Freedman et al. 1994, yielding a scale of 4.6 kpc/arcmin), with about 2000 identified galaxies Bingelli et al. (1987), of which about 110 spirals and lenticulars are brighter than . Virgo has many disturbed and HI-deficient galaxies, making it an ideal place to study in detail the processes that affect galaxy evolution. The cluster has a significant population of galaxies characterized by truncated star formation morphologies, with no H in the outer disk but strong H in the inner region (Koopmann & Kenney, 2004). Most of these “truncated/normal” galaxies are consistent with having simply ICM-ISM stripped disks , but some of them are more peculiar than that. NGC 4064 and NGC 4424 are the prototypical members of a type of H radial distribution which Koopmann & Kenney (2004) describe as “truncated/compact”. Compared to typical isolated galaxies, “truncated/compact” galaxies have circumnuclear normalized star formation rates enhanced by a factor of at least 5, and virtually no star formation beyond the central kiloparsec (Koopmann & Kenney 2004). In contrast to truncated/normal galaxies, these truncated/compact galaxies have unusually steep H surface brightness profiles resembling the stellar profile of a “bulge”.
These two peculiar 0.25 L Virgo cluster spiral galaxies are particularly interesting because they have small bulges, large HI deficiencies, and strong H emission confined to their cores, with bar-like morphologies. Furthermore, one of them, NGC4064, is located in the outskirts of the cluster, which may suggest that its HI deficiency is the result of environmental effects operating in the outer parts of Virgo. It has been reported that these two galaxies have H rotational gas velocities which are extremely low with respect to other Virgo cluster galaxies with roughly the same luminosity (Rubin et al. 1999). While the galaxies have some similarities, their stellar morphologies differ. NGC 4064 has an outer stellar disk which contains very open stellar spiral arms but appears relatively undisturbed, whereas NGC 4424 has heart-shaped optical isophotes, shells and complex stellar structures which suggest a merger event (Kenney et al. 1996).
In this paper, we present a detailed studied of the kinematics and morphologies of these two Virgo cluster galaxies in the hope of identifying the physical mechanisms responsible for their peculiarities. We present a comparison between the stellar, ionized gas and molecular gas morphology and kinematics in the form of two-dimensional maps. In §2, we briefly describe the known properties of these galaxies. In §3 we present the technical details of our spectroscopic observations as well as those of the CO interferometry and optical imaging. The observational results related to optical morphology, molecular gas morphology, and kinematics, dust morphology, stellar, and ionized gas kinematics are given in §4. We then discuss the nature of these objects in §5, and summarize our results in §6.
2 The Galaxies
2.1 NGC 4064
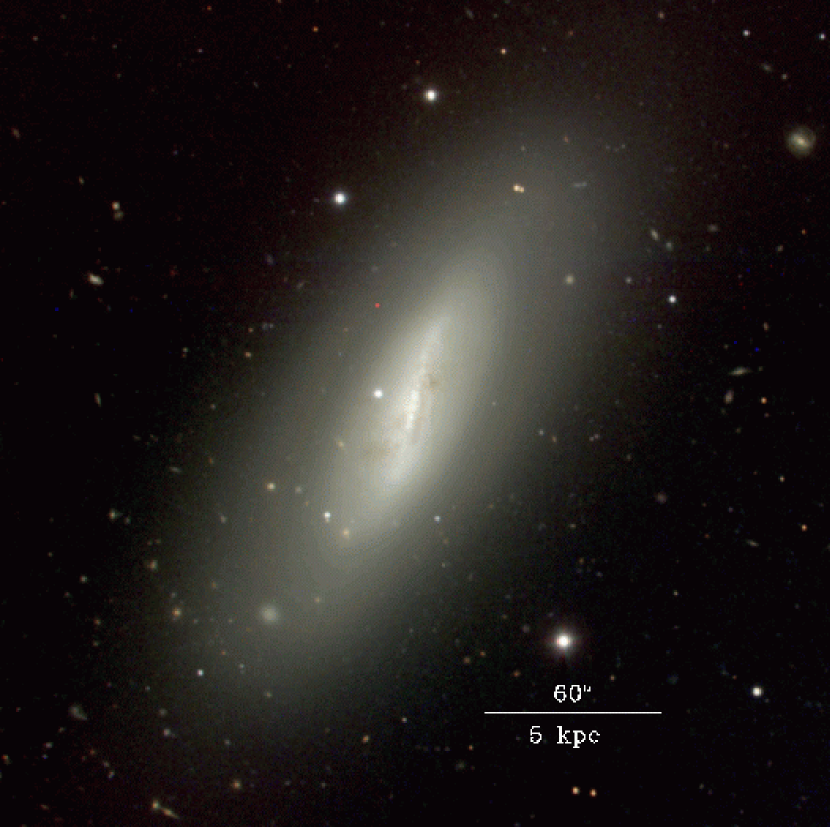
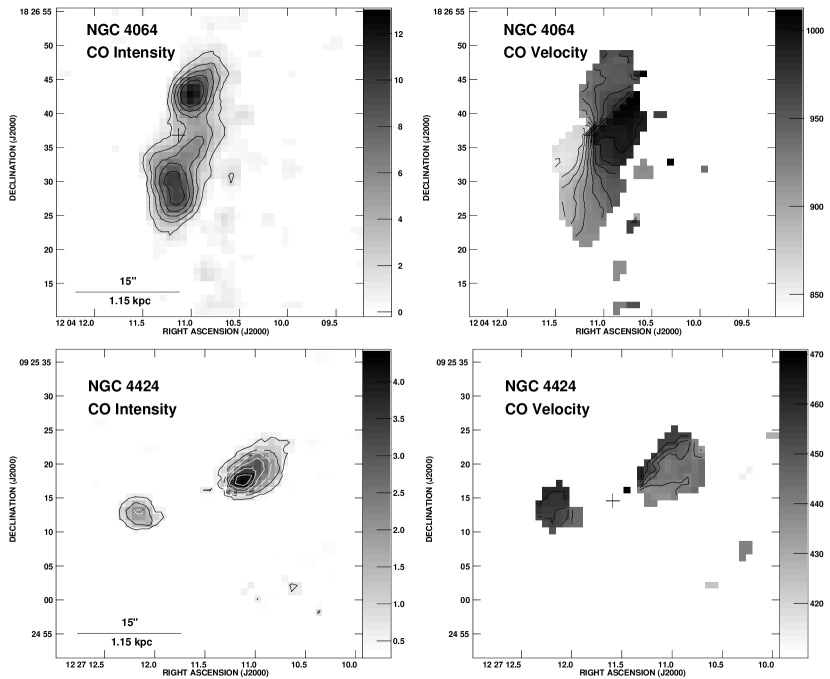
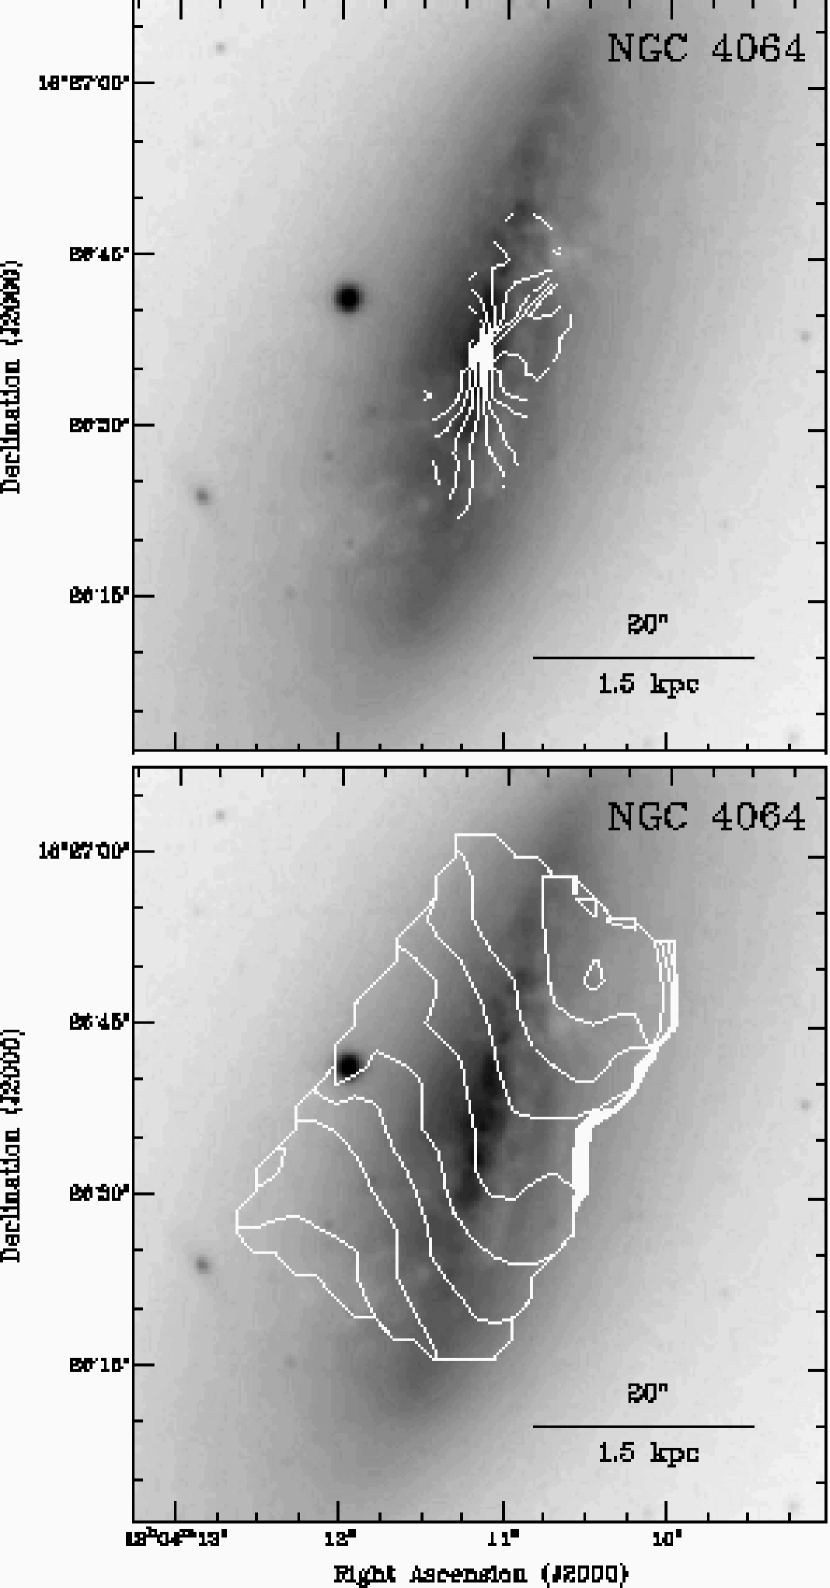
NGC 4064 is a peculiar SB galaxy located 8.8 (2.5 Mpc) from M87, in the outskirts of the Virgo cluster, and is among the most distant known cluster members. The optical image shows perturbed dust lanes and a central bar ending in very open spiral arms (Fig. 1). H imaging by Koopmann et al. (2001) shows that the H emission is confined to the central kpc. The H surface brightness in this central region is among the highest in the Virgo Cluster (Koopmann & Kenney 2004). NGC 4064 has been reported to have low H line-of-sight velocities for its luminosity with 40 (Rubin et al. 1999), but has a HI linewidth of 163 (Helou et al. 1984) consistent with its luminosity. It has a large HI deficiency of H= 1.0, corresponding to one-tenth the HI for a normal spiral of its luminosity. A table of general galaxy properties is given in Table 1.
2.2 NGC 4424
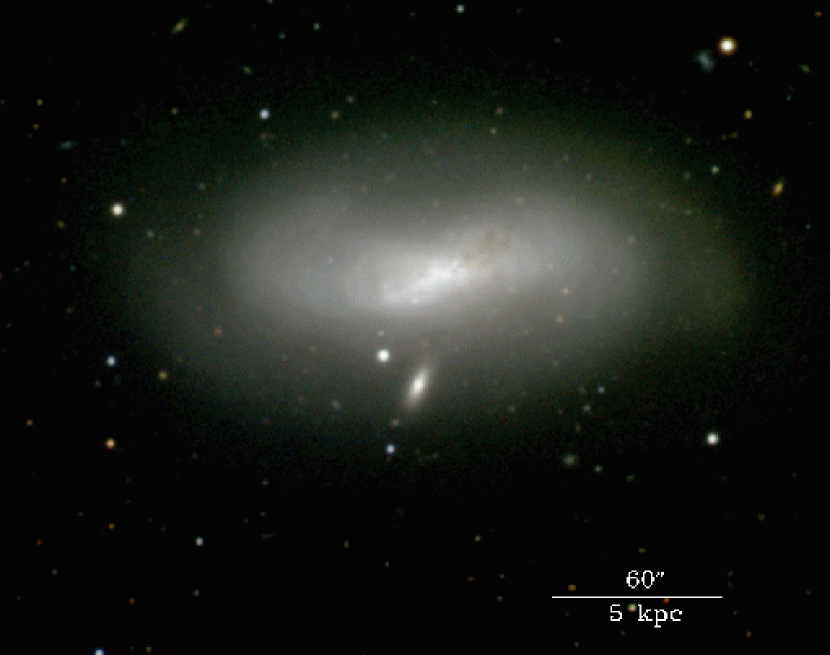
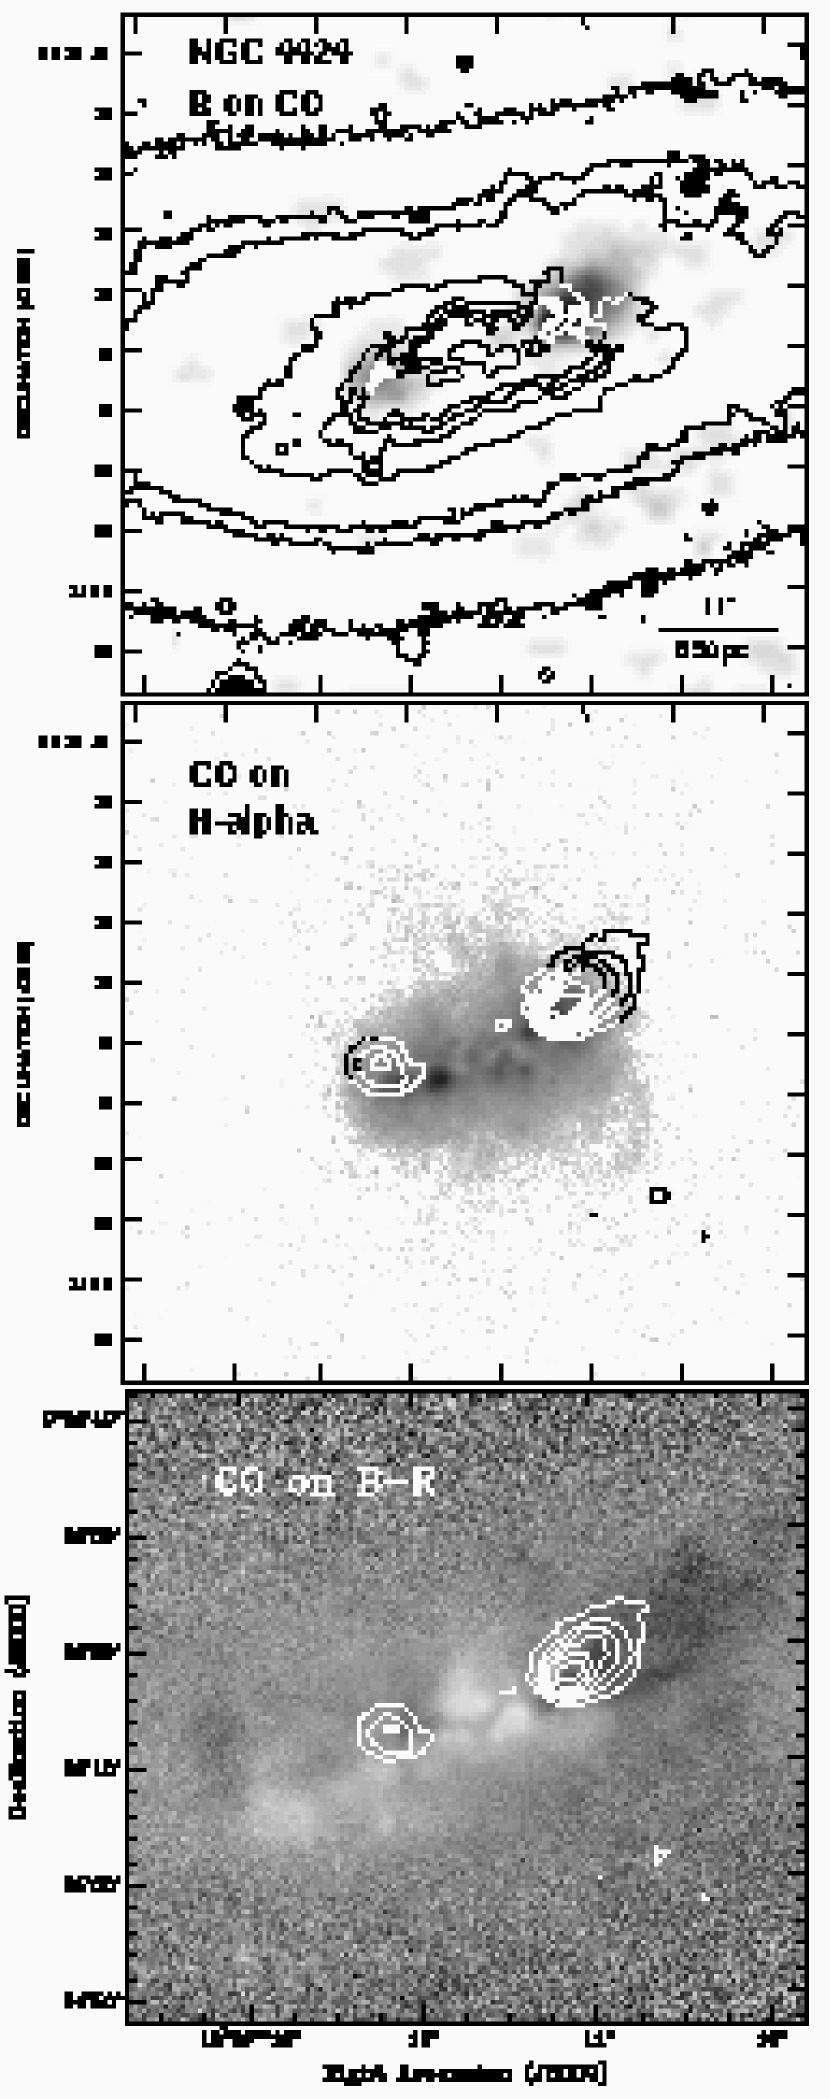
NGC 4424 is a peculiar Sa galaxy located 3.1 (870 kpc projected distance) from M87. It shows a more disturbed morphology than NGC 4064, characterized by unusual heart-shaped inner R isophotes and shell like features (Fig. 2), suggesting a merger event (Kenney et al. 1996). It also has H emission confined to the central kpc and one of the highest H surface brightnesses within the Virgo cluster (Koopmann & Kenney 2004). H velocities derived by Rubin et al. (1999) are extremely low ( 40 ). Its HI deficiency is also high ( 1.0) (Helou etal 1984; Kenney & Young 1989).
3 Observations and Data Reductions
3.1 Optical Imaging
We refer the reader to Table 2 for the details of the instrumental setup and observing conditions. NGC 4064 and NGC 4424 were observed using the Mini-Mosaic imager (Saha et al. 2000) on the WIYN 3.5-meter telescope on Kitt Peak during 2002 March 12-13 and 2001 March 15, respectively. The Mini-Mosaic imager has a 40964096 pixels detector, with a 10’ field-of-view and a pixel scale of 0.14”. NGC 4064 was observed in B, V, R, and the W15 H narrow band filter. For each filter three exposures were taken, with integration times of 180 s each for the broadband filters and 300s each for the narrowband filter. Images were taken in a dither pattern, with incremental offsets of 12” North-South and 5” East-West, in order to help fill in the gap between the two CCDs of Mini-Mosaic. In the case of NGC 4424, only the filters R and W15 (H) were used, with three exposures of 300 s and three exposures of 500 s taken through these filters respectively. B, and R-band images were obtained using the S2KB imager at WIYN on the night of 1997 May 2. The S2KB imager employs a detector of 20482048 pixels, with a field of view of 6.8’ and a pixel scale of 0.2”. Three 180 s exposures were taken through each filter.
Both galaxies (Fig. 3) were reduced in a similar way, using IRAF and especially developed IDL111http://www.rsinc.com routines kindly provided by A. Saha. First, all raw images were corrected by the “ghosting from saturation in another amplifier” effect using the IDL routine preproc3. Overscan and trimming was done with the routine ccdproc in the IRAF package “mscred”. The zeros and flatfield images were processed as usual. Following the flatfield correction, the images were corrected by the difference of the level of each amplifier. The sections corresponding to the same CCD were merged, and the two CCDs were joined into a single image. Next, the independent images were co-added in order to obtain a resulting deeper image. Finally, H continuum subtracted and B-R images were built from the co-added images.
3.2 Millimeter-wave Interferometric Observations
NGC 4064 and NGC 4424 were observed in the CO (1-0) line between January and March 2002 using the Owens Valley Radio Observatory (OVRO) millimeter interferometer, with six 10.4 m telescopes in L and E configurations. The resulting baselines ranged from 30 to 119 m. The quasar 3C 273 was used as pass band and phase calibrator. The average single side-band system temperature was 500 - 600 K. The data were calibrated using OVRO’s software package MMA (Scoville et al. 1993). The CO cube was mapped and deconvolved using the task IMAGR within the software AIPS. The resulting spatial resolution was (i.e., 310 pc at 16 Mpc) with natural weighting.
For NGC 4064, four spectrometer modules were used resulting in 120 channels with a spectral resolution of 10.4 . The resulting noise per channel was 15 mJy beam, and CO emission was detected ( 3) in 18 channels over the velocity range 843 to 1021 (Fig. 5). In the case of NGC 4424, two spectrometer modules were used over 120 channels with a spectral resolution of 5.2 . The resulting noise per channel was 20 mJy beam, and CO emission was detected in 9 channels over the velocity range of 424 to 467 (Fig. 6).
3.3 Integral Field Spectroscopy
We refer the reader to Table 4 for the details of the instrumental setup and observing conditions.
NGC 4064 and NGC 4424 were observed with the DensePak Integral Field Unit (Barden, Sawyer & Honeycutt 1998) at the WIYN 3.5-meter telescope during 1999 April 8-9. The 860@30.9 grating at 5000 Å was used at second order, covering the 4500 to 5500 Å wavelength range with a spectral dispersion of 0.48 Å per pixel, and a spectral resolution of 2.02 Å. Densepak consists of a fiber array of 90 fibers with a 70% area coverage, each 3.5” in aperture and spaced by 4.0” (300 pc).
The total exposure time in both galaxies was 2 hrs in 4 different exposures. The nucleus of the galaxies was centered on the array, and the DensePak major-axis was aligned with the optical major axis of the galaxy as derived from R-Band images by Koopmann et al. 2001. Comparison Cu-Ar lamp exposures were taken after every object integration, and G and K giant radial velocities standard stars were observed with exposure times of 180 s, for use as template stars for the kinematical analysis.
The spectra were reduced with IRAF in the usual way for multifibers spectrographs. They were zero–subtracted and overscan–corrected with the standard IRAF tasks. Flatfield correction, sky subtraction, fiber throughput correction and wavelength calibration were carried out using the IRAF task DOHYDRA in the package HYDRA (Valdes 1995). The galaxy spectra were averaged for improving signal-to-noise and cosmic ray removed.
We derived the two-dimensional stellar velocity field of NGC 4064 and NGC 4424 using the cross-correlation algorithm “corrfit” developed by Statler (1995) and based on the classic cross-correlation method developed by Tonry & Davies (1979). The method cross-correlates the galaxy spectra with the template star spectra, deriving a cross-correlation function which is the convolution between the Line of Sight Velocity Distribution (LOSVD) and the auto-correlation function of the template stars. The LOSVDs is parameterized by a Gaussian although a more detailed parameterization is also possible via Gauss-Hermite functions (van der Marel & Franx 1993), but due to low SNR we didn’t attempt such parameterization. The spectra were prepared by dividing by the continuum emission, rebining logarithmically, and fourier filtering. The emission lines were excluded from the cross-correlation, and the template star was chosen as the star which gives the highest cross-correlation peak with the galaxy spectra. The outcome of the above process was in the form of , maps. Due to the low signal-to-noise ratio of the spectra ( 40 per pixel in the central fibers, and 15 per pixel in the outer fibers), the full resolution line-of-sight velocity dispersions maps were noisy. In order to increase the S/N ratio we binned our data using the Voronoi 2D binning algorithm of Cappellari& Copin (2003) and obtained compact bins with a minimum signal-to-noise ratio of 20 per pixel which yielded line-of-sight velocity dispersions with a error of 10% .
In the case of emission lines (H) and OIII (5007 A), we derived two- dimensional ionized gas velocity maps, by fitting a gaussian function to the emission lines in the continuum subtracted spectra, obtaining and for the ionized gas.
4 Results
4.1 Optical Imaging
4.1.1 NGC 4064
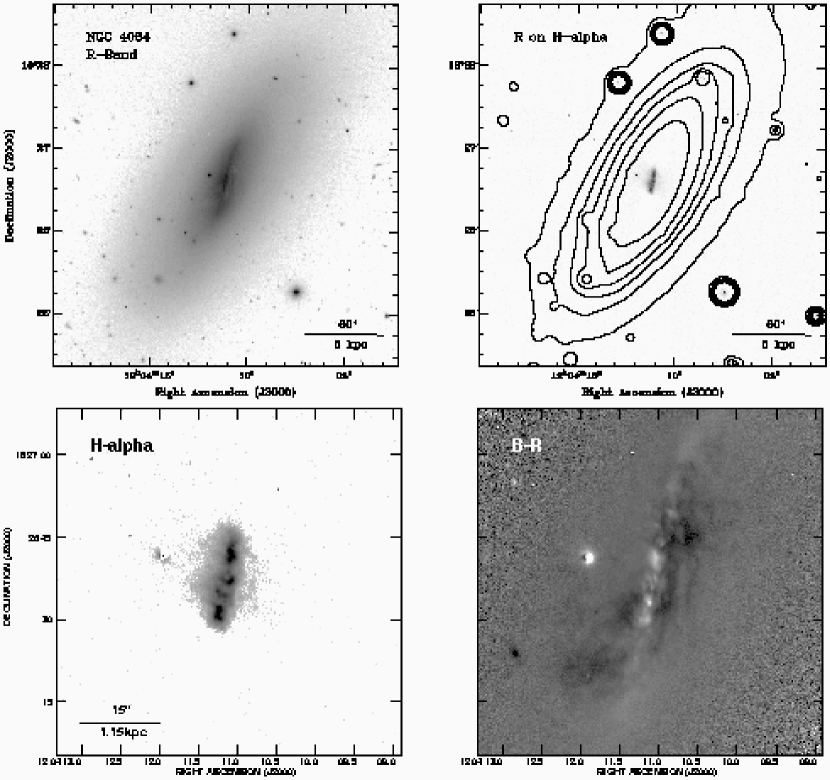
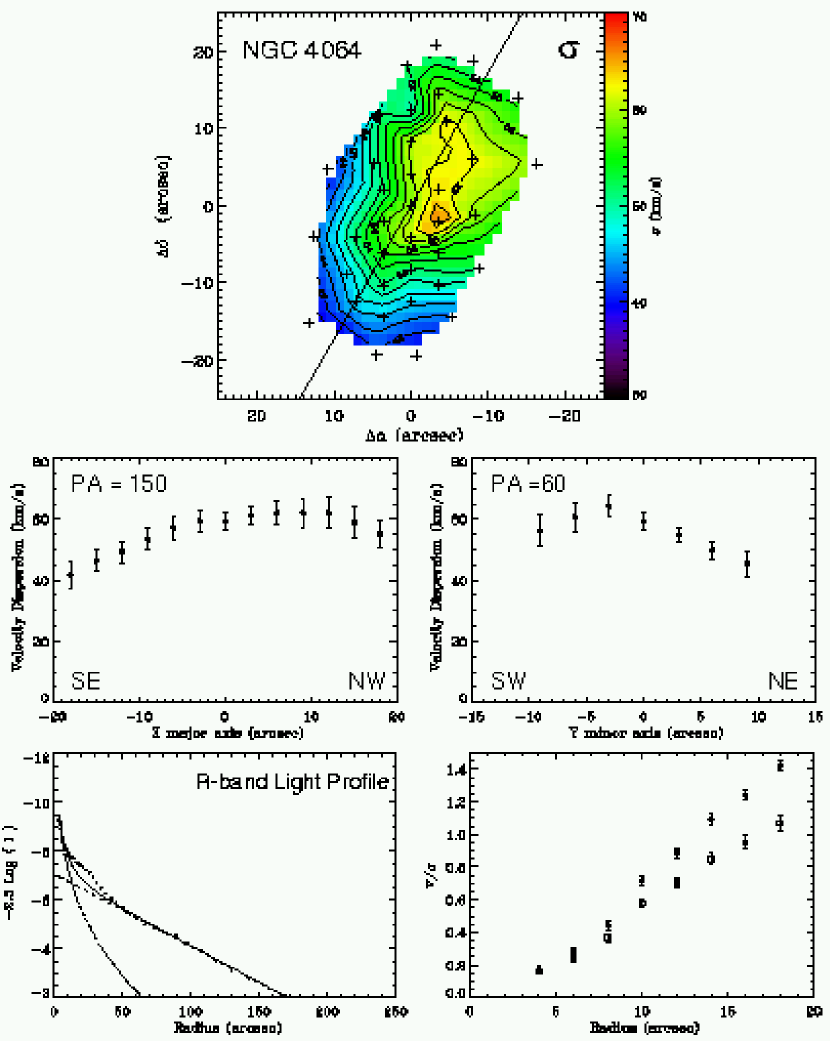
At optical wavelengths, NGC 4064 looks smooth in the outer regions beyond 35” (i.e., 2.7 kpc), as shown in Figure 3. The outermost isophotes are elliptical with no hint of a significant deviation from ellipticity with 0.65, which is consistent with an inclination of 70. The ellipticity rises from 0.65 at 35” (2.7 kpc) to 0.72 at 25” (1.9 kpc), over the same radial range, the P.A shifts from 155 to 165-170 due to the presence of a central bar which turns into open spiral arms at about 30” (2.3 kpc). The inner 15” (1.2 kpc) show three main star forming regions, separated between them by about 4” , which are also present in the H image. The R-band profile shows (a) a compact component in the central 10” which is partly due to the luminous star forming complexes; (b) a secondary component between 10” and 35”, which coincides with the region where the ellipticity rises, and it is due to the presence of the central bar, and, (c), an exponential disk component with a scale length of 37” 2” (2.9 0.2 kpc), which dominates beyond 35” (Fig. 17).
The H emission is confined only to the inner 10”, being aligned with the bar-like structure (P.A ). This emission consists of four bright star forming complexes surrounded by a diffuse component. Some faint filaments can be identified in our image. The filaments are roughly perpendicular to the bar on the eastern side, and form an arc on the western side. These filaments are probably the result of ejection of material from the luminous star forming HII complexes.
4.1.2 NGC 4424
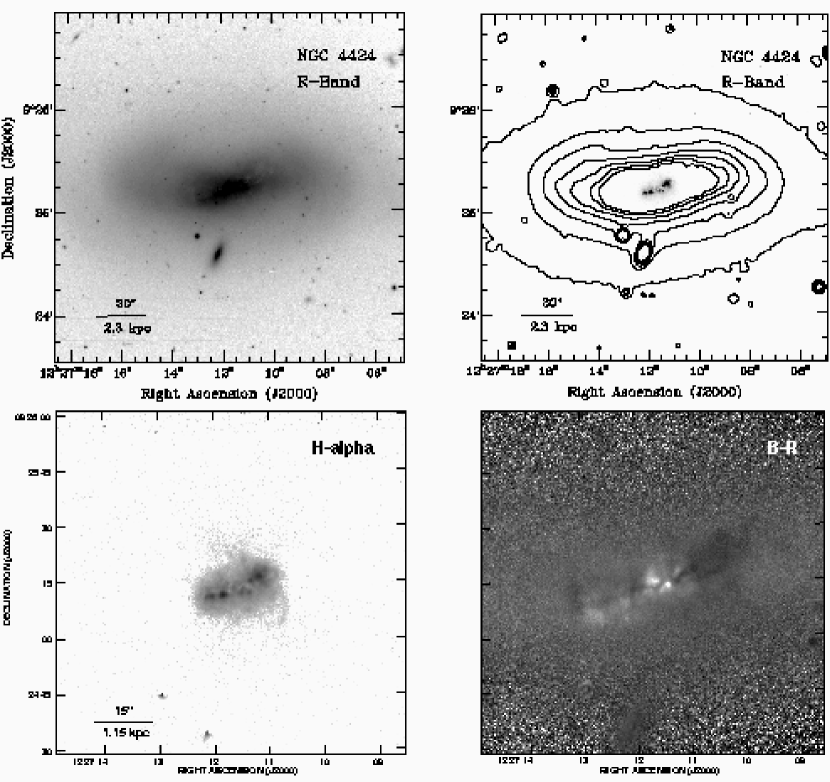
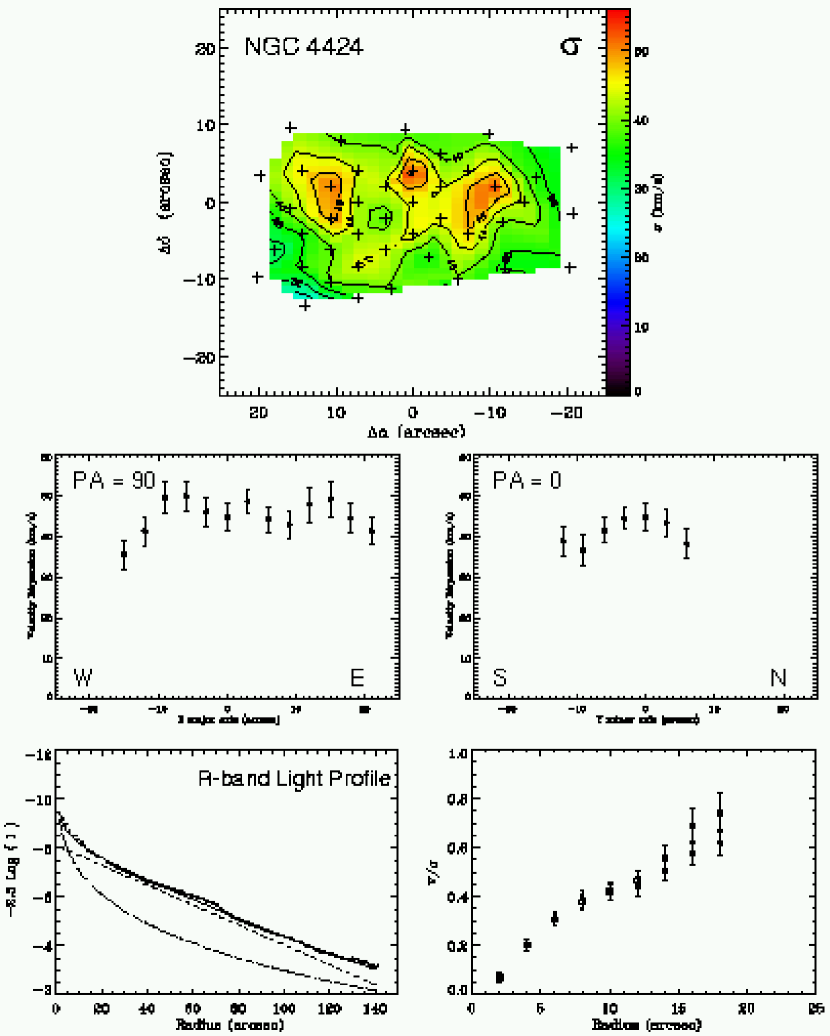
NGC 4424 shows several stellar non-axisymmetric features (Fig. 4) previously reported by Kenney et al. (1996). The ellipticity is almost constant ( 0.65) between 15” (1.2 kpc) and 70” (5.4 kpc), but the position angle decreases steadily from 107 to 91 due to isophote twisting. In addition to this, deviations from ellipticity reveal the presence of unusual banana-shaped or heart-shaped isophotes at 30” 70”, characterized by the fourier term 0.05. In the outer parts ( 70”), the ellipticity is nearly constant ( 0.47), and the deviations from ellipticity are small, but the position angle rises again, reaching a maximum of 95 at 100” (7.8 kpc) due to the existence of asymmetric broad shell-like features. The R-band radial profile reveals an exponential disk with a small compact bulge-like component which dominates in the inner 12” (Fig. 21). The relatively high ellipticity ( 0.6), and diskiness ( 0.1) within the inner 10”, show that this is a significantly flattened component, which could be a circumnuclear disk.
The H image of NGC 4424 shows strong emission confined to the inner 15” and originating from several H II complexes which form a slightly curved arc centered on the nucleus. The nucleus itself is associated with weak emission, and the strongest emission is confined to two regions which are located symmetrically at 4 (300 pc) from the nucleus, aligned with a P.A of 118. Three weak H filaments are present north of the strong H emission and oriented perpendicularly to the major-axis. An arc-shaped filament is present in the SW, being probably associated with the western HII complexes.
4.2 Molecular Gas
4.2.1 Morphology
NGC 4064
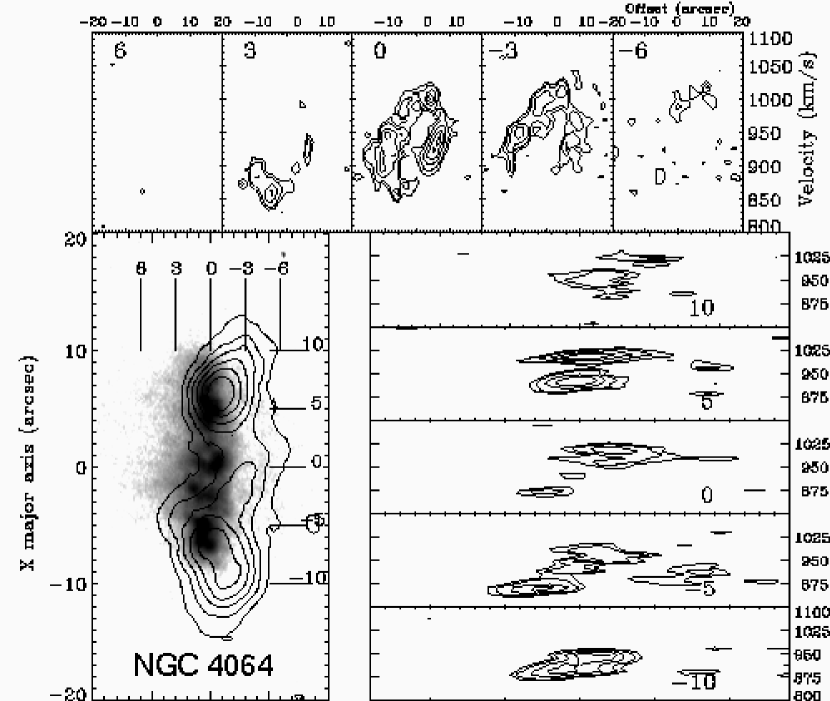
The CO emission in NGC 4064 resembles a bar-like structure confined to the inner 15” (1.2 kpc), and is mainly concentrated in two lobes – as seen in the channel maps of Fig. 5), spanning the velocity range 843 – 1021 . which are located nearly symmetrically about the nucleus, 7” ( 540 pc) from the kinematic center (Fig. 8). The total interferometer CO (1-0) line flux is 61 13 Jy , which is 66 40% of the single dish flux of 93 40 Jy detected by Kenney & Young (1988). Assuming the “standard” conversion factor (Bloemen et al. 1986) , and a distance of 16 Mpc, the mass derived from the interferometer flux is , and assuming solar metallicity the total gas mass is 2.3 .
The CO emission is aligned along a P.A of 170, which is nearly the same as the stellar bar (Fig 11). The CO kinematic center coincides with the position of the nuclear stellar peak. The CO distribution is asymmetric, about both the major and minor axes. The southern lobe, with 40 Jy , has twice as much emission as the northern lobe, with 21 Jy , although the extent of emission along the major axis is similar in the north and south.
CO emission is associated with H emission, but slightly displaced ( 3”–6”), with the H peaks located inside in the CO peaks. Also, the H emission is centered on the major axis, and there is no H counterpart to the extra CO extended to the SW.
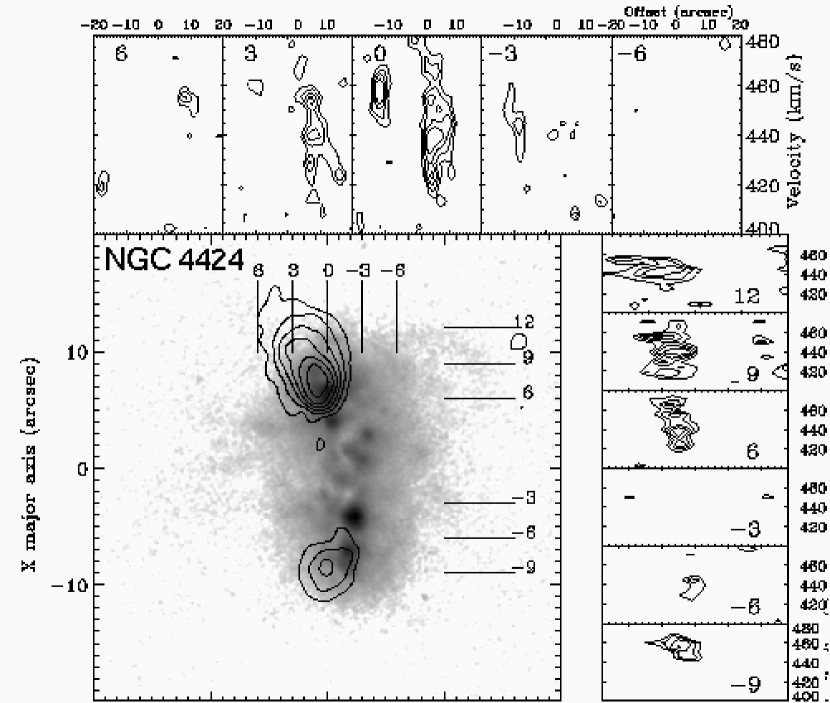
NGC 4424
The CO map of NGC 4424 shows two lobes of emission (Fig. 8), confined to the inner 15” ( 1.2 kpc), as seen in the channel maps of Fig. 6), spanning the velocity range 424 – 460 . The lobes are located symmetrically about the nucleus (Fig. 12), at radii of 8” ( 600 pc), and aligned along a P.A of 105, similar to the inner stellar isophotes. The total CO interferometer flux is 14.3 2.9 Jy , compared to a single dish flux of 56 30 Jy (Kenney & Young 1988), meaning that we are detecting 26 14 % of the total CO flux with the interferometer. Assuming the “standard” conversion factor, and a distance of 16 Mpc, the mass derived from the interferometer flux is 4.0 , and assuming solar metallicity the total gas mass is 5.5 .
In addition to the bi-lobal CO morphology, several other features of the CO morphology in NGC 4424 are similar to NGC 4064. The CO peaks are associated with the brightest HII regions (Fig. 12), and the CO lobes appear offset from the H peaks by 3”-4”, with the H peaks inside the CO peaks. The CO distribution is asymmetric, about both the major and minor axes. The western lobe, with 10.8Jy , has three times as much emission as the eastern lobe, with 3.5 Jy , although the extent of emission along the major axis is similar in the east and west. The emission is also asymmetric about the major axis, with more emission to the north. Unlike NGC 4064, the central HII regions of NGC 4424 are not associated with any detected CO emission, although this may be a reflection of the overall weaker CO emission in NGC 4424.
4.2.2 Kinematics
NGC 4064
The molecular gas in NGC 4064 has highly non-circular motions, with bar-like streaming motions and perhaps shocks. Since the kinematics are somewhat complex, we show channel maps (in (Fig. 5), spectral line profiles at 3 resolution (Fig. 7), position-velocity diagrams, moment maps, and plots of line-of-sight velocities.
The northern CO lobe shows double-peaked line profiles in some locations, with distinct peaks near 930 and 1000 (Fig. 7) The southern lobe shows broad line profiles, some of which have complex shapes, although without clear doubling. A comparison of the line profiles on the 2 sides of the nucleus shows that the peaks of the broad profiles in the southern lobe are either associated with one the double peaks in the northern lobe, or are located between them (after reflection about the systemic velocity). The total line widths in the 2 lobes are similar, although a bit larger in the north, with a maximum FWZI of 165 km/s in the north, and 145 km/s in the south. The double peaked and broad line profiles are likely due to shocks associated with a bar.
A map of intensity-weighted mean velocities in Figure 8 shows a well-ordered velocity field, with nearly symmetric behavior in the 2 lobes, and strong non-circular motions (Fig. 8). The CO kinematic major axis varies from 90 in the center, to 125 at 5, significantly different from the optical major axis (PA=150) and the long axis of the bar (PA). In the lobes the isovelocity contours are nearly parallel to the bar. While the moment 1 map shows a representation of the the overall CO velocity field in NGC 4064, it does not accurately show the kinematics in the region of double-lined profiles and large velocity gradient, since we have not spatially resolved the apparent shock. In positions with double-peaked line profiles, the moment 1 map shows an intensity-weighted average velocity of the 2 peaks. Thus the true CO velocity field would show a much larger velocity gradient in the region of the apparent shock than is shown in the moment 1 map.
A truer view of the kinematics in the region of the apparent shock is provided in Figure 9, which shows position-velocity diagrams parallel and perpendicular to the stellar bar, which is offset by only 20 degrees from the line of nodes (major axis). The PVDs perpendicular to the bar show large velocity gradients across the CO lobes, with 150 over 2 (150 pc) in the southern lobe, and an even larger apparent gradient in the northern lobe. Similar CO kinematics are observed in other galaxies, including the barred galaxy NGC 7479 (Laine et al. 1999), and the Virgo cluster galaxy NGC 4569 (Jogee etal 2004). In the strongly barred galaxy NGC 7479 (Laine et al. 1999), CO is strongly concentrated to a narrow ridge along the bar, with large velocity gradients across the ridge, presumably due to a shock front. NGC 4064 also has large velocity gradients perpendicular to the bar. The broad line profiles in the southern lobe, and the double peak profiles in the northern lobe, could be the result of the large velocity gradient, marginally resolved with our 4” resolution, caused by a shock front. The higher velocity components (with respect to the galaxy center) correspond to the preshocked gas, and the lower velocity components to the postshocked gas. The difference in shape of the line profiles between the lobes could be due to a non-uniform distribution of gas within the velocity field.
The PVDs provide further insight into the asymmetry in line profile shapes in the southern and northern lobes. In the PV diagram along the bar through the nucleus (Fig 9), the low level contours show similar curved features on both sides of the nucleus, but the high level contours have different distributions. Whereas in the north most of the CO emission is concentrated at the high and low velocity ends, with little emission at intermediate velocities. in the south most of the CO emission peaks at intermediate velocities. This is consistent with a nearly bi-symmetric velocity field, but a non-uniform distribution of gas within the velocity field.
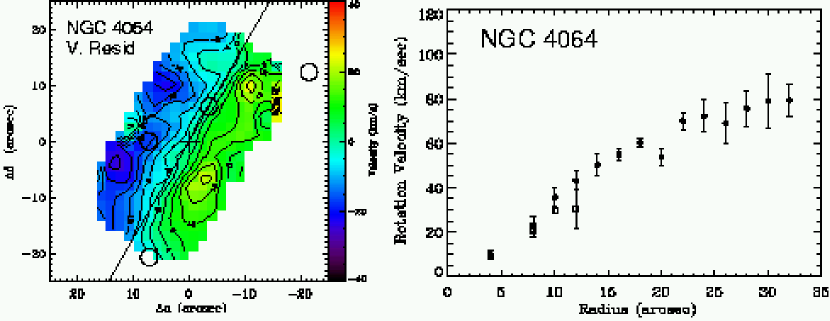
Figures 8 and 15, show that there is a large CO velocity gradient along the minor axis, totalling 130 across the central 3. Given that the southwestern side of the galaxy is the near side (based on the stellar kinematics (§4.4.1), and assuming trailing spiral arms), these correspond to inward radial streaming motions of 70 in the plane of the galaxy.
NGC 4424
The CO velocity field in NGC 4424 has similarities with NGC 4064, although covers less of the central area and is somewhat noiser due to the weaker CO emission. The CO isovelocity contours in Figure 8 are nearly parallel to the optical major axis and the major axis of the CO structure, and nearly perpendicular to the stellar isovelocity contours (section 4.4). Both the moment 1 map and the PVDs show a modest CO velocity gradient along the major axis, with a velocity difference between the 2 CO peaks of only 10 km/s. There are larger velocity gradients perpendicular to the major axis, across the short axis of the CO lobes, of 20 km/s across the eastern lobe and 40 km/s across the western lobe. These motions are consistent with bar-like streaming motions and shocks, although less extreme than in NGC 4064. Unlike NGC 4064, there is no clear stellar bar in NGC 4424, and the gas bar may be dynamically decoupled from the stars.
4.3 Dust Morphology
4.3.1 NGC 4064
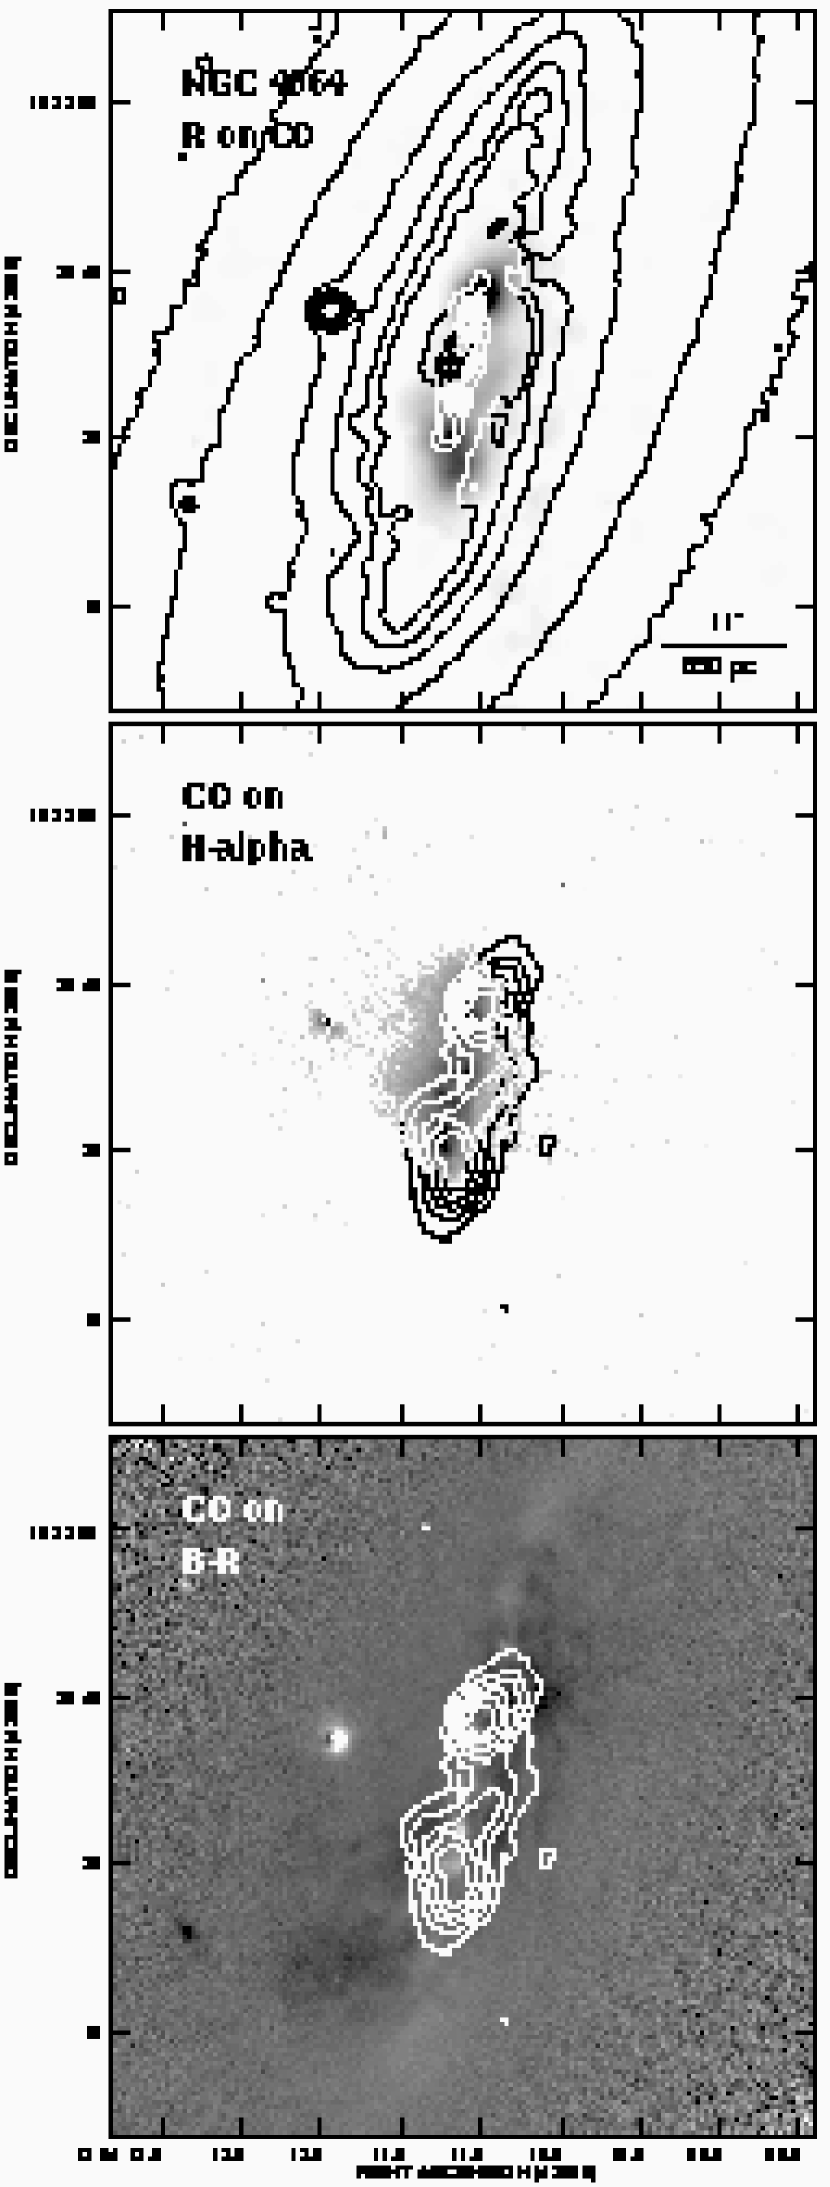
NGC 4064 presents a patchy, filamentary and asymmetric dust configuration (Fig. 3) very different from the typical straight dust lanes found in stronger barred galaxies such as NGC 1300, or from the curved dust shapes in weak bars as in NGC 1433 (Athanassoula 1992). The B-R map (Fig. 3) suggests more extinction on the western side of the galaxy, implying that it is the near side of the disk – assuming the dust lies on a disk coplanar with the stars. The B-R image shows the dust is only present in the inner 30” (2.3 kpc). There are three main dust concentrations located at 11” (850 pc) NW of the center, 6” (470 pc) SE, and 18” (1.4 kpc) SE (Fig. 3). The two first locations lie over the stellar bar, being connected by an irregular linear feature roughly parallel to the bar. At the third location the dust is slightly offset from the stellar bar. Beyond the inner 10” some of the dust shows filamentary structures roughly perpendicular to the bar extending to 25” toward the NW and SE.
The dust lanes extend further from the center of the galaxy than the H and CO emission, as expected. The H emission is located in clumps in the inner 15” (1.2 kpc), whereas much of the dust surrounds these H complexes suggesting that the disturbed dust distribution near the HII complexes are due to the star formation process.
As expected, dust obscuration appears associated with the CO emission, although it is much more widespread and irregular. Extinction peaks are not perfectly coincident with the CO lobes although the strongest features are near them. The CO lobes are connected by the filamentary dust feature, which also has CO emission associated with it (Fig 11).
The gas distribution associated with the dust is not completely truncated to zero at the “gas truncation radius” (12.5” 1 kpc), defined by the extension of the H emission, probably resulting from environmental effects. The gas density is likely to drop significantly at the H gas truncation radius, but there is still enough low column density gas beyond it as to have associated patches of dust extinction.
4.3.2 NGC 4424
NGC 4424 has very disturbed dust lanes (Fig. 4). The extinction is preferentially concentrated on the north side of the galaxy, suggesting that it is the near side of the galaxy. The B-R image shows dust lanes which extends to 35” - 40” (2.7 - 3.1 kpc). A filamentary dust structure extends across the major axis (P.A = 105) of the inner flattened component, or pseudo-bulge. This filament survives in the inner 15” (1.2 kpc), ending in two dust concentrations ( 8” or 600 pc) which in turn coincide with the CO lobes (Fig. 12).
The dust concentration associated with the eastern CO lobe is an extension of the inner filament. On the other hand, the dust concentration associated with the western CO lobe presents a shape similar to the CO lobe, but is more extended. This concentration continues toward the west in the form of two filaments connecting to a patch of dust extending to the north as far as 30” (2.3 kpc). To the east, a patch of dust is present at 28” (2.2 kpc) from the nucleus, and is perpendicular to the major axis of the galaxy. Weak dust filaments perpendicular to the major axis are visible in the R-band image within the inner 40” ( 3 kpc), although they are not evident in the B-R map, probably due to the bigger PSF of the B image.
As usual the strongest dust absorption coincides with the CO emission. Since the dust absorption is more extended than the molecular gas, as was the case for NGC 4064, probably these dust lanes are associated with low column density gas that we are not detecting.
4.4 Stellar and Ionized gas kinematics
4.4.1 NGC 4064
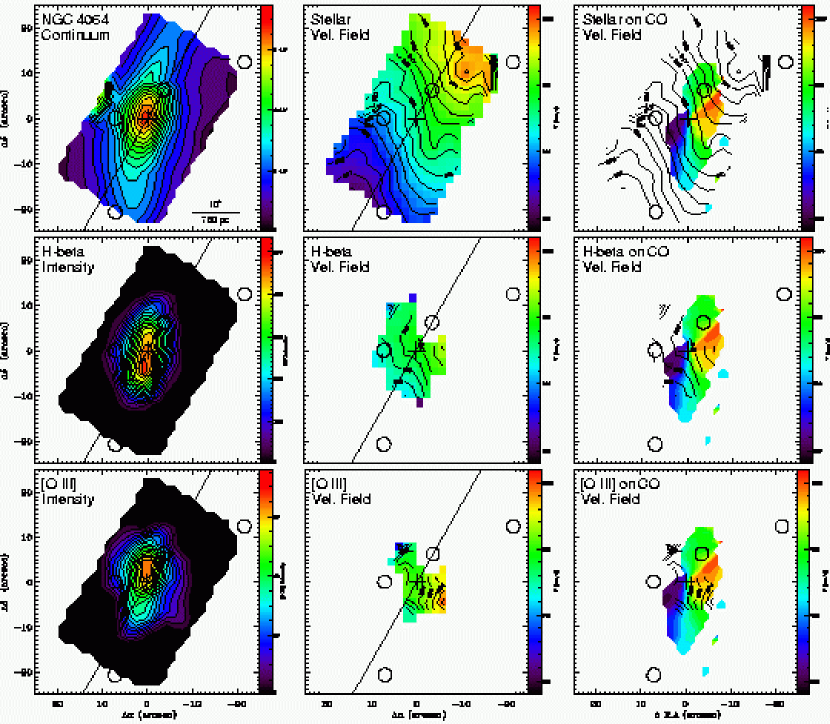
Stellar kinematics NGC 4064 stellar and ionized gas velocity fields are shown in Fig. 13. The observed stellar velocity field is smooth and consistent with rotation plus bar-like streaming motions. In the inner 10”, the isovelocity contours are not parallel to the minor axis, but exhibit the typical S-shape which is a signature of bar-like streaming motion (Vauterin and Dejonghe 1997).
The stellar velocity field in the outer parts of the densepak field of view exhibits a velocity gradient almost parallel to the optical major axis of the galaxy (Fig. 13). On the other hand, the inner stellar velocity gradient is nearly perpendicular to the bar although not as much as the CO velocity gradient (Fig. 14), a difference probably arising from the different nature of the star and gas motions. Usually, in a bar-like potential we have several orbit families. For the gas, being collisional, only non-intersecting orbits can exist. In the case of the stars, several orbit families can co-exist resulting in a velocity field which has isovelocity contours that could be different from those of the gas, and larger velocity dispersion (Vauterin & Dejonghe 1997).
We now turn to the determination of the stellar rotation curves. Fitting a pure circular tilted ring model to the stellar velocity field with fixed P.A = 150 and 70 (Koopmann et al. 2001), we found a stellar systemic velocity is 929 3 . The maximum rotation velocity over the denspack array is of 80 7 . The residual map shows a clear gradient along the minor axis, with a maximum velocity of about 20 (Fig 16).
The velocity dispersion field has a maximum of 64 with a peak slightly offset from the center. The NW side of the galaxy shows a velocity dispersion higher than the SE side (Fig. 17). Comparing the velocity dispersion profile with the stellar rotation curve, we find that the galaxy becomes supported by rotation for R 17” (1.3 kpc) where the 1 (Fig 17) which roughly matches the radius at which the disk begins to dominate the light profile, as expected.
Ionized gas kinematics
The gas (H and [O III] 5007 emission), exhibits a kinematical behavior similar to that of the stars (Fig. 13). The gas emission is confined to the inner 10 arcsec and forms a bar-like structure, with star formation regions (H emission) along the axis of the bar. The isovelocity contours do not appear to be aligned with the bar-like structure as clearly as the stellar velocity field or the CO velocity field is. As we previously did for the stellar velocity field, we determine ionized gas rotation curves by fitting a pure circular, tilted ring model to the H and [O III] velocity field. We found gas systemic velocities of 943 2 , and 947 2 respectively, which are identical within the errors, but higher than the stellar systemic velocity of 929 3 . The ionized gas rotation curves is similar to that of the stars with a maximum velocity of 30 9 at 12”.
Along the bar both stellar and ionized gas kinematics are consistent with circular motions as indicated by Fig. 15. Across the bar stellar and ionized gas velocities exhibit a gradient of about 20 , indicating the presence of radial streaming motions. A velocity gradient 3 times larger is found for the CO velocities (Fig. 15)
4.4.2 NGC 4424
Stellar kinematics
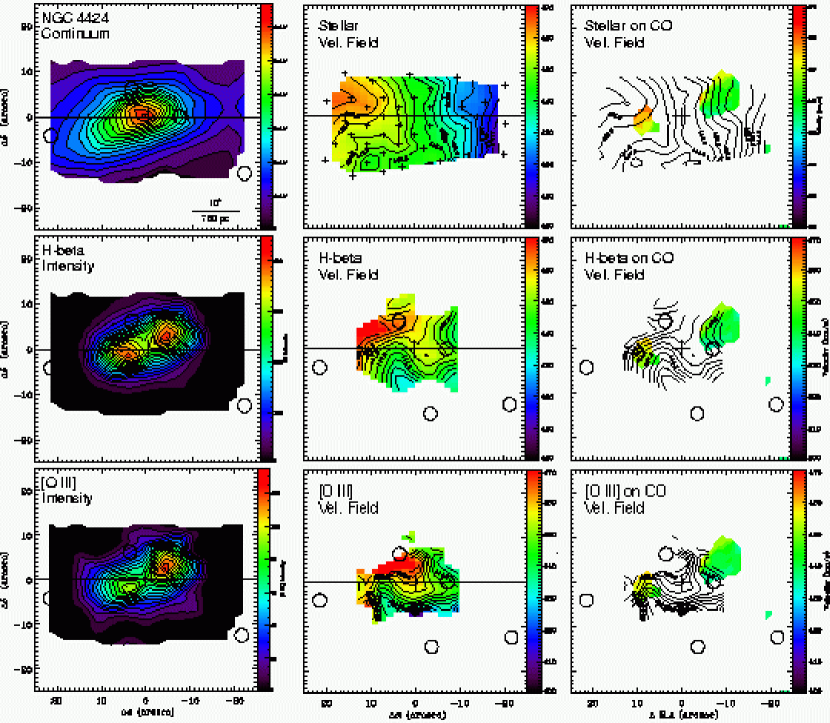
The NGC 4424 stellar and ionized gas velocity fields are shown in Fig. 18. The observed stellar velocity field looks smooth and consistent with circular motions, but with some distortion in the isovelocity contours probably due to low signal-to-noise ratio.
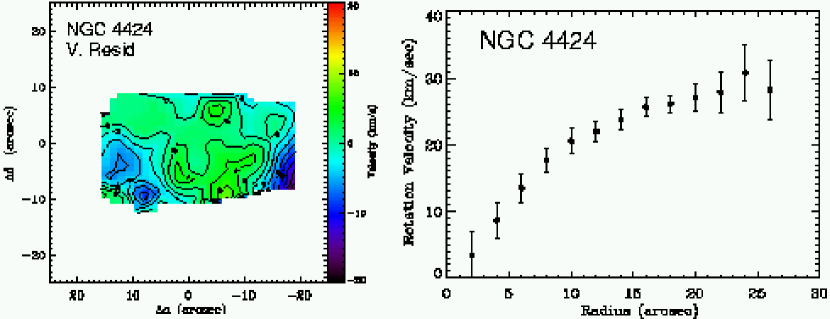
As we did for NGC 4064, we fitted a pure circular tilted ring model to the stellar velocity field with fixed P.A = 90 and inclination = 60 in order to derive the rotation curve. We obtained a smooth curve with a systemic velocity of 442 4 . The rotation velocity reaches a maximum of 31 4 at the end of the array (Fig. 20), a very low value for the observed luminosity but consistent with Rubin et al. (1999). The residual map between the pure rotating model and the data reveals small residuals of 4 (Fig. 20).
The stellar velocity dispersion map shows a central peak of 55 4 slightly offset by 4” (300 pc) from the center of the galaxy (Fig. 21). Secondary peaks are symmetrically located about 10” (800 pc)from the nucleus. Comparing the velocity dispersion profile with the stellar rotation curve, we conclude that the galaxy is dominated, as far as we have measured it, by random motions with a value of 0.7 at 18” (Fig. 21), well inside the region of disk dominancy. This is surprising and unlike the normal behavior we found in NGC4064, and can be attributed to disk heating resulting from a merger.
Ionized gas kinematics
Examination of Fig. 18 reveals that H and O[III] emission are confined to two star forming regions roughly equidistant from the center ( 10”, 780 pc), corresponding to the two H complexes described in §4.1.2.
The ionized gas velocity field is very different from the stellar velocity field. Outside the central 5”, the gas isovelocity contours tend to be perpendicular to the stellar isoveocity contours in the outer parts, indicating that the gas has strong non-circular streaming motions. Within the central 15”, the H and O[III] velocity fields show a twisting in the isovelocity contours. Slicing the velocity field along the major axis (Fig. 19), and referring to the H velocity field (central panel of Fig. 18) suggests (within the limits of the Densepak array resolution of 3.5”) that inside the Eastern 15” region the stars and ionized gas have opposite velocity gradients, which might be consistent with gas counterrotation. This is far from conclusive however as the velocity amplitudes are small. The blue-shifted velocity features exhibited by the Southern ionized gas (bottom central panel of Fig. 18) could be related to the arc-like feature present at the bottom of the H image in Fig. 4. This might suggest an outflow emerging from the circumnuclear star forming region.
Fig. 18 shows that the CO behavior is similar to that of the ionized gas in that both exhibit a velocity gradient along the minor axis of the lobes.
5 Discussion
5.1 Origin of the molecular gas bilobal morphology
NGC 4064 and NGC 4424 each exhibit two distinct concentrations of molecular gas, or CO lobes. Twin gas concentrations, located symmetrically about the nucleus are common in the central kiloparsec of galaxies (e.g. Kenney et al. 1992; Jogee et al. 1999). This is due to the existence of 2 modes, associated with a bar or spiral arms, in galaxy centers. These 2 modes are common especially in barred and interacting systems, and these concentrate gas into features with 2 symmetry. The gas concentrations are not uniform in radius along these azimuthal features, because the radial gas flow rate and/or gas consumption rate due to star formation is not uniform, leading to gas concentrations at certain radii.
Simulations of gas flow in barred systems (e.g. Athanassoula 1992), show that gas is driven radially inwards by a combination of gas dissipation and gravitational torques exerted by the stellar bar. In simulations without star formation and without a bulge, the maximum gas concentrations are along the bar and toward the inner parts of the bar. If there is a bulge, the maximum gas concentrations are typically deep within the bar, in spiral arm or ring features, located near kinematically distinct central regions where orbits (Contopoulos & Papayannopoulos 1980) begin to occur, and where the potential is less bar-like and more axisymmetric. Similar behavior may occur in tidally interacting and merging galaxies, because in tidal interactions there is a strong 2 perturbation to the gravitational potential, which may cause the formation of a bar (Barnes & Hernquist 1996).
The CO distributions in many barred galaxies are more concentrated than the gas distributions seen in simulations, probably because star formation occurs preferentially at certain locations, consuming the gas more at some radii than others. In many galaxies the star formation occurs preferentially at smaller radii, and the main gas concentration is at a slightly larger radius (e.g. Kenney et al. 1992; Kohno et al. 1999) This suggests either a time sequence, with radially inflowing gas first concentrating and then young stars forming, and emerging downstream, and/or a dynamical difference in the gas at smaller radius making it more susceptible to star formation. In many galaxies, this combination of effects leads to “twin peaks” in the molecular gas distribution.
Are NGC 4064 and NGC 4424 consistent with that picture? Both galaxies show non-circular motions within the CO lobes, consistent with bar-like streaming motions, and possibly shocks. In NGC 4064, the stellar morphology and kinematics both clearly show the presence of a stellar bar, extending out to a radius of 30”. Both galaxies have very small bulges, so in neither galaxy is there a kinematically distinct central region observed, as there is in galaxies with larger bulges. The CO peaks at 10” are well inside the bar, and are nearly aligned with it. In NGC 4424, there is no clear evidence of a stellar bar. The gas bar in NGC 4424 may be a dynamically decoupled gas bar, which can form in simulations of both mergers (e.g., Barnes & Hernquist 1996). and the nuclear regions of barred galaxies (Englmaier & Shlosman 2004). The gas does not presently have enough mass to be self-gravitating since it comprises only 15 of the dynamical mass within the central 1 kpc, but maybe it used to.
Both galaxies have H emission located inside the CO lobes, which is consistent with the picture of a time sequence in the star formation process. In NGC 4064, the inflow velocity (corrected by inclination) of 70 and the separation between the star-forming complexes and CO lobes of about 3” (230 pc) corresponds to a time delay of 4 Myrs, which is about the typical time expected for the onset of star formation. In NGC 4424, both the inflow velocity111Take it as the inclination corrected velocity along the minor axis of the CO lobes of 23 and the CO-H separation of 1”-2” are smaller than in NGC 4064, but the corresponding time delay is about the same, 4-8 Myrs. The consumption of gas in the center by star formation likely explains why the CO has a bi-lobal rather than bar-like distribution.
5.2 Star formation history
NGC 4064 & NGC 4424 have central star formation rates which are among the highest in the Virgo Cluster (Koopmann & Kenney 2004), and enhanced with respect to typical spiral galaxies, but lower than extreme starbursts. Using the H parameters derived from H surface photometry (Koopmann et al. 2001), we find that NGC 4064 has an H luminosity of 1.510 erg s, which corresponds to a global star formation rate of 0.12 M yr using the prescription given by Kennicutt (1998). NGC 4424 has a similar H luminosity of 1.810 erg s, and a global star formation rate of 0.15 M yr. These global star formation rates are low, but the star formation densities in the nucleus are high with a value of 0.1 M yr kpc. Both galaxies have total gas masses of 410 M, and similar gas consumption timescales of 3 Gyr.
Optical images show that star formation activity in both galaxies was more spatially extended in the recent past. B-R maps (Fig. 11 and Fig. 12) show blue stellar complexes along the bar in NGC 4064, and along the major axis for NGC 4424, out to 30” (2.3 kpc), much further than the present H emission. The blue stellar complexes are within the region still containing HI (Chung et al. , in prep), suggesting that star formation has ceased at radii of 10-30 because gravitational torques drove the gas inwards, rather than the gas being stripped.
5.3 Nature of the NGC 4424 and NGC 4064 galaxies
NGC 4064 and NGC 4424 show several interesting similarities: (a) CO and H gas distributions which are very truncated and confined to the central kpc. (b) Bar-like CO and H morphologies, with two CO peaks located nearly symmetrically about the kinematical center, and with star formation regions located inside the CO peaks. (c) CO distributions which are asymmetric about both the major and minor axes, suggesting a non-equilibrium gas distribution. (d) disturbed dust distributions. Were these galaxies affected by the same environmental process? Despite these similarities, there are some important differences between these two objects: First, NGC 4064 shows smooth and unperturbed outer isophotes (Fig. 3), consistent with an unperturbed stellar disk. NGC 4424, on the other hand, shows shell-like features, and banana-shapes isophotes, indicating a very perturbed stellar disk. We turn now to the different scenarios which could explain the observed similarities and differences between the galaxies.
5.3.1 ISM-ICM stripping
NGC 4064 and NGC 4424 are very HI-deficient and have extremely truncated gas disks. Could gas depletion and truncation be due to ram pressure stripping? This mechanism is capable of removing the outer gas of cluster spirals, and evidence shows that it affects mosts spirals in the Virgo cluster (Giovanelli & Haynes 1983; Warmels 1988; Cayatte et al. 1990; Solanes et al. 2001). NGC 4522 is an especially clear example of HI gas being stripped from the normal stellar disk of a Virgo spiral (Kenney et al. 2004), and most Virgo spirals have H disks which appear spatially truncated but otherwise normal in their central regions (H/normal), consistent with ICM-ISM stripping (Koopmann & Kenney 2004).
New VLA HI observations (Chung, Van Gorkom, Kenney, & Vollmer 2005) show that both galaxies exhibit HI disks truncated at about 5 kpc. An HI tail with no stellar counterpart in NGC 4424 suggests that ISM-ICM stripping has affected this galaxy. NGC 4064 is very far out in the cluster ( 2 Mpc), so it is unlikely that ram pressure stripping is acting now, unless the ram pressure is much larger than expected from a static and smooth ICM. Although it is outside the virial radius of the cluster, it is probably just inside the maximum rebound radius of the cluster (Cortés et al. in prep.), making it plausible that it was stripped during a core passage 2 Gyr ago.
Judging from the VLA HI maps, ram pressure stripping has played a role in the depletion of the gas content in these galaxies (Chung, Van Gorkom, Kenney, & Vollmer 2005), but both galaxies present other features that are not consistent with simple ram pressure stripping: (1) H morphologies which are “truncated/compact” and not “truncated/normal”, as should be the case in simple ISM-ICM stripping (Koopmann & Kenney 2004). (2) The central starburst suggests that the activity was triggered in the last few hundred Myr, more recently than a core passage time in the case of NGC 4064. (3) The disturbed dust distribution is unlikely to be caused by ISM-ICM stripping, being rather the signature of a recent gravitational interaction ( few orbital times). 4) The disturbed stellar disk in NGC 4424 cannot be explained by simple ISM-ICM stripping, a mechanism unable to alter the structure of stellar disks. 5.) Asymmetric CO distributions in the central kpc suggest a gravitational disturbance.
All these facts suggest that gravitational processes have recently acted on both galaxies, perhaps in addition to ram pressure stripping. Gravitational interactions may have played a role in making some gas less bound to the stellar disks, thus making ram pressure stripping more efficient.
5.3.2 NGC 4424, a case of minor/intermediate mass merger with ISM-ICM stripping
NGC 4424 has several features that can be associated with a merger event, including a disturbed stellar distribution with shell-like features and strong deviations from ellipticity, disturbed dust lanes, non-circular gas streaming motions, an enhanced central star formation rate, and ionized gas kinematics in the core which are disturbed and possibly counterrotating.
Simulations show that mergers are very effective in transforming the morphology of the progenitor galaxies, forming a variety of objects depending of the mass ratio between the progenitors. Elliptical galaxies with radial profiles are the result of collisions with mass ratio of 1:1 to 3:1 (e.g, Barnes 1992, Bendo & Barnes (2000), Cretton et al. 2001, and Naab & Burkert 2003). Minor mergers with mass ratios less than 10:1 lead to thickened spiral disks supported by rotation, and intermediate mass mergers (1:4 - 1:10 mass ratios) generate objects with mixed properties such as disk-like structures with an exponential radial light profile supported by velocity dispersion rather than rotation (Bournaud et al. 2004).
How does NGC 4424 fit in this picture? NGC 4424 shows a large fraction of light in non-axisymmetric features which are short lived, surviving a few rotation periods. These features could be explained by a recent merger event with a mass ratio 1:10, or an older remnant with a larger mass ratio. In major mergers, classical tidal tails, which are not seen in this case, are formed with the first passage of the companion. This suggests the intermediate-minor merger nature of this galaxy. The small bulge or compact stellar component, exponential light profile, and remarkably low ratio (Fig. 21), all indicate that this galaxy shares a disk-like morphology with an elliptical-like kinematics similar to the remnants produced by Bournaud et al. (2004). This suggest a mass ratio of 1:10-1:4 for the progenitors.
We have also considered whether the properties of NGC 4424 might be explained by a high–velocity galaxy–galaxy collision, since such collisions can produce both a gravitational disturbance and ISM–ISM gas stripping. However, we think that the extent of the disturbances, especially the banana-shaped stellar distribution, the shell-like stellar features, and the large velocity dispersion are difficult to explain through a high-velocity collision, and are more naturally explained by a merger.
5.3.3 NGC 4064, case for some type of gravitational interaction plus gas stripping
In the case of NGC 4064, there is evidence for some type of gravitational interaction plus gas stripping, although the detailed scenario is not as clear as in NGC 4424. We consider 4 different scenarios. 1. ICM-ISM stripping of a barred spiral galaxy. 2. First ICM-ISM stripping, then a minor merger. 3. First ICM-ISM stripping, then a tidal interaction. 4. A close, high-velocity galaxy-galaxy collision with ISM-ISM stripping.
1. The simplest scenario is that of a barred spiral galaxy whose outer disk gas was stripped by ICM-ISM stripping by a passage through the cluster core. The gravitational torques exerted by the stellar bar would make some of the remaining gas infall to the center. If the galaxy has a typical orbital velocity of 1000 , passage through the central 2 core, where most stripping probably occurs, would have occurred 2 Gyr ago. This long timescale is difficult to reconcile with the present central star-forming activity, the disturbed dust distribution, and the asymmetric CO distribution. Moreover, the disturbed dust and CO distributions, and the stellar bar itself, are more naturally explained by a gravitational interaction.
We think the observed properties of NGC 4064 indicate a combination of gas stripping, either by an ICM-ISM or ISM-ISM interaction, and a gravitational encounter, either a minor merger or tidal interaction or direct collision.
2. Mergers can drive large amounts of gas to the central kiloparsec ( 60 %, Barnes & Hernquist, 1996), trigger central starburts, and produce disturbed dust distributions. During the first passage, a bar instability develops due to tidal forces between the progenitors. If the galaxy has a small bulge or a small dark matter halo which cannot maintain the axial symmetry, they are more likely to develop a bar instability. Simulations of collisions of bulgeless galaxies by Iono, Yun, & Mihos (2004) show features in the gas morphology which resemble NGC 4064, including a bar in the center which turns into open spiral arms further out, and central gas distributions which are asymmetric about the major axis at some phases.
The lack of H emission in the outer parts suggest that the galaxy was depleted of its outer disk gas by ram pressure stripping before the collision. It could have looked like NGC 4580, which is also in the outskirts of the cluster, or like one of the other “truncated/normal” galaxies (Koopmann & Kenney 2004), before the collision. A pre-collision gas truncation radius of 0.3 - 0.6 seems likely.
A possible difficulty with a merger scenario is that NGC 4064 has an undisturbed outer stellar disk, without any sign of shells or tails. This points to a recent minor merger with mass ratio less than 1:10. The stellar ratio (Fig. 17) reveals an object largely dominated by rotation, implying that any merger had a small mass ratio. Even minor mergers can produce tails and disturbances in the outer disk (e.g, Laine & Heller, 1999), unless the collision occurs with a large inclination angle. Such high inclination encounters are less likely to disturb the outer disk, and also increase the resettling time of gas onto the stellar disk, which could explain the persistence of disturbed dust.
3. An alternate possibility to be considered is that of a non-merging tidal interaction. Tidal interactions can also trigger bar instabilities in bulgeless disks, cause central starbursts, and disturb dust lanes. The closest candidate for such an interaction is NGC 4049, a small irregular galaxy, located at a distance of 30’ ( 130 kpc) from NGC 4064. Its velocity is 829 , and its magnitude is which implies a mass of the mass of NGC 4064. The DSS image shows that NGC 4049 is a disturbed galaxy with a bar-like appearance. If such an encounter took place, it could have happened about 1 Gyr ago or less. A possible problem with this scenario is the lack of tidal tails or outer disk disturbance. Tidal tails are dispersed more quickly in high-velocity encounters, and in clusters (Mihos 2004), although the latter effect may not be so important in the cluster outskirts. A second possible problem is the disturbed dust lanes. While tidal interactions can disturb dust lanes somewhat, it is not clear that they can produce the extent of disturbance seen in NGC 4064.
Minor mergers and non-merging tidal encounters can produce broadly similar effects, although a high-inclination minor merger may be more able to produce the observed central disturbances without strongly disturbing the outer stellar disk.
4. A close, high-velocity, non-merging, galaxy-galaxy collision could both disturb the galaxy through gravitational forces, and strip gas by ram pressure in the ISM-ISM collision. Such interactions are relatively rare, but offer the potential advantage of doing everything with only one interaction (Kenney etal 1995). In this scenario, disturbed dust lanes may arise from gas resettling into the galaxy after the collision. However, it is unclear whether the detailed properties of NGC 4064 are consistent with this scenario. There are no ring-like or tidal arm disturbances to the disk. There is no obvious collision partner. The nearby galaxy NGC 4049 is disturbed, although has more gas than NGC 4064, inconsistent with a collision scenario since it is a smaller galaxy than NGC 4064.
Our best scenario for NGC 4064 is a galaxy with a “truncated/normal” gas distribution due to a past ram pressure stripping event now undergoing a minor merger (1:10 - 1:20) with a large inclination angle. A tidal interaction or collision with a companion (such as NGC 4049) cannot however be ruled out.
5.4 Summary on Environmental Mechanisms and the Future of these Galaxies
Our results suggest that ”truncated/compact” galaxies are the result of the action of at least two environmental processes, namely ram pressure stripping and gravitational interactions. Ram pressure is most important in the core of the cluster where the ICM density is large enough to be efficient in removing the ISM from the galaxies. The perturbed morphologies on the other hand are the result of recent gravitational interactions which drive gas to the central kiloparsec thus triggering star formation. This suggests that the morphological transformation of some galaxies in clusters could be driven by more than a single process.
The future of these galaxies seems clear. Without any reservoir of gas left and assuming the present SFR, the galaxies will consume most their gas during the next 3 Gyrs. As the gas continues to infall and undergo star formation, it will form compact circumnuclear stellar disks (pseudo-bulges)(Kormendy & Kennicutt 2004), or perhaps even bulges. Outer stellar structures will fade in the next Gyr. Since both galaxies have exponential outer galaxy light profiles, they would likely end up as S0 galaxies with small but enhanced bulges or pseudo-bulges.
6 Summary
We have presented optical imaging, 2-D optical spectroscopy and CO interferometry of the peculiar Virgo cluster galaxies NGC 4064 and NGC 4424. Our main conclusions are:
1. Optical imaging reveals that NGC 4424 has a heavily disturbed stellar disk, with banana-shaped isophotes and shells. NGC 4064 has a relatively undisturbed outer stellar disk, with a central stellar bar that smoothly connects with open spiral arms in the outer disk.
2. Both galaxies show strong H emission confined to the central kiloparsec, and little or no H emission beyond. H emission originates from bar-like strings of luminous star formation complexes, surrounded by fainter filaments. The H radial distributions, which resemble the starlight radial distributions of bulges, have been described as “truncated/compact” (Koopmann & Kenney 2004), and are distinct from the“truncated/normal” H morphology associated with simple ICM-ISM stripping that is found in many Virgo spirals.
3. Complexes of young blue stars without associated star formation exist beyond the present location of ongoing star formation, indicating a rapidly shrinking star-forming disks.
4. The optical B-R images show disturbed dust distributions present in both galaxies. Clear dust extinction features extend to radii of 2-3 kpc, much further than the molecular or ionized gas detected by us, although similar to the blue stellar complexes. The inner dust morphology appears to be affected by the active star formation in the central kiloparsec.
5. CO interferometry reveals in each galaxy two main molecular gas concentrations, located symmetrically about the nucleus at radii of 500 pc. The CO lobes have broad, and in some cases, double-peaked line profiles, and large velocity gradients, suggesting the presence of shocks along a bar. In both galaxies, CO velocity fields show strong non-circular streaming motions, suggesting that the gas is infalling. H emission is radially offset inside the CO lobes, suggesting a time sequence in which gas is concentrated in a bar, and closer to the center (downstream) the gas becomes dense enough to undergo star formation. Star formation consumes much of the molecular gas in the center, leaving a bi-lobal rather than bar-like gas distribution. The CO distributions are asymmetric about both the major and minor axes, similar to the gas distributions in some minor merger simulations.
6. In NGC 4064 the stellar velocity field shows clear kinematic evidence for a strong stellar bar, with a clear pattern of rotation plus bar-like streaming motions. There is a velocity gradient along the minor axis of 20 over 500 pc in the stars, which contrasts with a much larger value of 70 in the molecular gas. The stars in the galaxy are supported predominantly by random motions in the inner 15”, where 1, and supported predominantly by rotation by r=20”, where =1.4.
7. In NGC 4424, the stellar velocity field shows a pattern of largely circular motions, with low line-of-sight velocities. There is no clear photometric or kinematic evidence of a stellar bar. The stars in the galaxy are supported predominantly by random motions, with =0.7 0.1 at r=18” (1.4 kpc), which is the outermost point we have measured. The ionized gas in the 5 core has disturbed kinematics, and is possibly counterrotating.
8. With its heavily disturbed stellar morphology, small , disturbed dust lanes, central gas bar, and odd core gas kinematics, NGC 4424 is very likely an intermediate-mass merger. The lack of outer disk gas is likely caused by ram pressure stripping, which would be particularly effective on gas driven outwards by the merger, and which might plausibly occur at NGC 4424’s present location in the cluster, at 0.5 virial radii.
9. The origins of NGC 4064’s disturbances are less clear. Its disturbed dust distribution, asymmetric CO distribution, strong central bar with central enhancement in star formation are all suggestive of a recent gravitational encounter, but one which leaves the outer stellar disk relatively undisturbed. A likely scenario for the gravitational encounter is a recent minor merger with a large inclination angle or a close tidal interaction with the nearby spiral NGC 4049. The outer disk gas deficiency is likely due to ram pressure stripping, although its outer cluster location at 1.5 virial radii means that it was either stripped about 2 Gyr ago in a core crossing, or stripped more locally and recently by ram pressure much stronger than the smooth static ICM case.
10. Our guess about the future of these galaxies is that without any reservoir of gas left and assuming the present SFR, the galaxies will consume most their remaining gas during the next 3 Gyrs. As the gas continues to infall and undergo star formation, it will build compact circumnuclear disks (pseudo-bulges), and perhaps ultimately (through secular evolution) bulges. Outer stellar structures will fade in the next Gyr. Thus both galaxies will end up as S0 galaxies, with smooth stellar disks, little gas and dust in the the inner 2 kpc, and larger (although still small) bulges or pseudo-bulges.
11. While ram pressure stripping likely plays an important role in the formation of lenticular galaxies in clusters, our results support the idea that it is not the only mechanism. Gravitational encounters together with ram pressure stripping play a key role in forming the most peculiar objects such as NGC 4424 and NGC 4064. As demonstrated by NGC 4064, some of these processes can occur in the outskirts of clusters.
We thank to Abhijit Saha for kindly providing IDL routines for reducing the optical imaging data, Rebecca A. Koopmann for providing some of the optical imaging data on NGC 4424, and Pieter van Dokkum and an anonymous referee for helpful comments which improved the paper. The funding for this research has been provided by Fundación Andes Chile, FONDAP project grant 15010003, Chile, and NSF grant AST-0071251.
References
- (1) Athanassoula, E. 1992, MNRAS, 259, 345
- (2) Balogh, M. L., Schade, D., Morris, S. L., Yee, H. K. C., Carlberg, R. G., Ellingson, E. 1998, ApJ, 504, 75
- (3) Barden, S. C., Sawyer, D. G., & Honeycutt, R. K. 1998, Proc. SPIE, 3355, 892
- (4) Barnes, J. E. 1992, ApJ, 393, 484
- (5) Barnes, J. E., & Hernquist, L., 1996, ApJ, 471, 115
- (6) Bendo, G. J., & Barnes, J. E. 2000, MNRAS, 316, 315
- (7) Begeman, K. G. 1989, A&A, 223, 47
- (8) Bingelli, B., Tammann, G. A., & Sandage, A. 1987, AJ, 94, 241
- (9) Binney, J., & Tremaine, S. 1987, Galactic Dynamics (Princeton: Princeton Univ. Press)
- (10) Bloemen, J. B. G. M., et al. 1986, A&A, 154, 25
- (11) Bournaud, F., Combes, F., & Jog, C. J. 2004, A&A 418, L27
- (12) Butcher, H., & Oemler, A. Jr. 1978, ApJ, 219, 18
- (13) Cappellari M., Copin Y. 2003, MNRAS, 342, 345
- (14) Cayatte, V., van Gorkom, J. H., Balkowski, C., & Kotanyi, C. 1990, AJ, 100, 604
- (15) Chung, A., van Gorkom, J. H., Kenney, J. D. P., & Vollmer, B. 2005, in “Extraplanar Gas”, ed R. Braun, ASP Conf Series, Vol. 331, p 275–280
- (16) Contopoulos, G., & Papayannopoulos, T. 1980, A&A, 92, 33
- (17) Cretton, N., Naab, T., Rix, H.-W., & Burkert, A. 2001, ApJ, 597, 893
- (18) deVaucouleurs, G., deVaucouleurs, A., Corwin, H. G., Buta, R. J., Paturel, G., Fouqué, P. 1991, Third Reference Catalog of Bright Galaxies, (New York: Springer- Verlag)
- (19) Dressler, A. 1980, 236, 351
- (20) Dressler, A., Oemler, A. Jr., Couch, W. J., Smail, I., Ellis, R. S., Barger, A., Butcher, H., Poggianti, B. M., & Sharples, R. M. 1997, ApJ, 490, 577
- (21) Englmaier, P., & Shlosman, I. 2004, ApJ, 617, L115
- (22) Freedman, W. L., et al. 1994, Nature, 371, 757
- (23) Ghigna, S., Moore, B., Governato, F., Lake, G., Quinn, T., & Stadel, J. 1998, MNRAS, 300, 146
- (24) Giovanelli, R., & Haynes, M. P. 1983, AJ, 88, 881
- (25) Gómez, P. L. et al. , 2003, ApJ, 584, 210 (17 authors)
- (26) Gunn, J. E., & Gott, J. R. 1972, ApJ, 176, 1
- (27) Helou, G., Hoffman, G. L., & Salpeter, e. E. 1984, ApJS, 55, 433
- (28) Hernquist, L. 1992, ApJ, 400, 460
- (29) Hubble, E., & Humason, M. L. 1931, ApJ, 74, 43
- (30) Iono, D., Yun, M. S., & Mihos j. C. 2004, ApJ, 616, 199
- (31) Jacoby, G. H., et al. 1992, PASP, 104, 599
- (32) Jogee, S., Kenney, J. D. P., & Smith, B. J. 1999, ApJ, 526, 665
- (33) Jogee, S. et al. 2004, ApJ, 615, 105
- (34) Kenney, J. D. P., & Young, J. S. 1988, ApJS, 66, 261
- (35) Kenney, J. D. P., & Young, J. S. 1989, ApJ, 344, 171
- (36) Kenney, J. D. P., Wilson, C., D., Scoville, N.Z., Devereux, N. A., & Young, J. S. 1992, ApJ, 395, 179
- (37) Kenney, J. D. P., Rubin, V. C., Planesas, P., & Young, J. S. 1995, ApJ, 438, 135
- (38) Kenney, J. D. P., & Koopmann, R. A., Rubin, V. C., & Young, J. S. 1996, AJ, 111, 152
- (39) Kenney, J. D. P., van Gorkom, J. H., & Vollmer, B. 2004, AJ, 127, 3361
- (40) Kennicutt, R. C., Jr. 1998, ARA&A, 36, 189
- (41) Kohno, K., Kawabe, R., & Vila-Vilaró, B. 1999, ApJ, 511, 157
- (42)
- (43) Koopmann, R. A., Kenney, J. D. P., & Young, J. 2001, ApJS, 135, 125
- (44) Koopmann, R. A., & Kenney, J. D. P. 2004, ApJ, 613, 866
- (45) Laine, S., Kenney, J. D. P., Yun, M. S., & Gottesman, S. T. 1999, ApJ, 511, 709
- (46) Laine, S., & Heller, C. H. 1999, MNRAS, 308, 557
- (47) Lewis, I., etal 2002, MNRAS, 334, 673 (24 authors)
- (48) Mastropietro, C., Moore, B., Diemand, J., Mayer, L., & Stadel, J. 2004, in Outskirts of Galaxy Clusters: Intense Life in the Suburbs, Proceedings of IAU Symposium, No. 222. (Cambridge: Cambridge University Press), 519
- (49) Mihos, J. C. 2004, in Clusters of Galaxies: Porbes of Cosmological Structure and Galaxy Evolution, ed. J. S. Mulchaey, A. Dressler, & A. Oemler (Cambridge: Cambridge Univ. Press), 278
- (50) Moore, B., Katz, N., Lake, G., Dressler, A. & Oemler, A. 1996, Nature, 379, 613
- (51) Moore, B., Lake, G., Quinn, T. & Stadel, J. 1999, MNRAS, 304, 465
- (52) Naab, T., & Burkert, A. 2003, ApJ, 597, 893
- (53) Nilson, P. 1973, Uppsala General Catalogue of Galaxies (Uppsala)
- (54) Nichol, R. C. 2004, in “Cluster of Galaxies: Probes of Cosmological Structure and Galaxy Evolution”, ed J. S. Mulchaey, A. Dressler, & A. Oemler (Cambridge: Cambridge Univ. Press), 24
- (55) Nulse, P. E. J. 1982, MNRAS, 198, 1007
- (56) Poggianti, B. M., Smail, I., Dressler, A., Couch, W. J., Barger, A. J., Butcher, H., Ellis, R. S., Oemler, A. Jr. 1999, ApJ, 518, 576
- (57) Rubin, V. C., Waterman, A. H., & Kenney, J. D. P. 1999, AJ, 118, 236
- (58) Saha, A., Armandroff, T., Sawyer, D. G., & Corson, C. 2000, Proc. SPIE, 4008, 447
- (59) Scoville, N. Z., Carlstrom, J. E., Chandler, C. J., Phillips, J. A., Scott, S. L., Tilanus, R. P. J., & Wang, Z. 1993, PASP, 105, 1482
- (60) Schulz, S. & Struck, C. 2001, MNRAS, 328, 185
- (61) Solanes, J. M., Manrique, A., García-Gómez, C., González-Casado, G., Giovanelli, R., & Haynes, M. P. 2001, ApJ, 548, 97
- (62) Spitzer, L. Jr., & Baade, W. 1951, ApJ, 113, 413
- (63) Statler, T. S. 1995, AJ, 109, 1371
- (64) Tonry, J., & Davis, M. 1979, 84, 1511
- (65) Valdes, F. 1995, Guide to the HYDRA reduction task DOHYDRA
- (66) van der Marel, R. P., & Franx M. 1993, ApJ, 407, 525
- (67) van Dokkum, P. G., Franx, M., Fabricant, D., Kelson, D. D., Illingworth, G. D. 1999, ApJ, 520, L95
- (68) van Gorkom, J. H. 2004, in “Cluster of Galaxies: Probes of Cosmological Structure and Galaxy Evolution”, ed J. S. Mulchaey, A. Dressler, & A. Oemler (Cambridge: Cambridge Univ. Press), 306.
- (69) Vauterin, P., & Dejonghe, H. 1997, MNRAS, 286, 812
- (70) Vollmer, B., Cayatte, V., Balkowski, C., & Duschl, W., J. 2001, ApJ, 561, 708
- (71) Warmels, R. H. 1988, A&AS, 72, 19
- (72) Young, J. S., Xie, S., Kenney, J. D. P., & Rice, W. L. 1989, ApJS, 70, 699


| Parameter | NGC 4064 | NGC 4424 | Note |
|---|---|---|---|
| Environment | 8.8 from M87 | 3 from M87 | |
| R.A (J2000) | 120411.13 | 122711.6 | |
| Dec (J2000) | 1826’ 36.84” | 0925’14.39” | |
| Morphological type | SBc(s): | Sa pec | 1 |
| SB(s)a:pec | SAB0p | 2 | |
| Systemic radial velocity (stellar) | 929 3 | 442 4 | |
| Systemic radial velocity (CO) | 929 5 | ||
| Adopted distance | 16 Mpc | 16 Mpc | 3 |
| Linear scale | 77.6 pc arcsec | 77.6 pc arcsec | |
| B | 11.84 | 11.96 | 3 |
| (B-V) | 0.68 | 0.62 | 3 |
| M | -19.18 | -19.06 | 3 |
| Optical size | 4.2’ 1.8’ | 3.6’ 1.9’ | 4 |
| R | 138” | 125” | 5 |
| R | 10.7 kpc | 9.7 kpc | 5 |
| P.A (optical isophotes at R) | 150 | 90 | 5 |
| P.A (CO structures) | 170 | 106 | |
| Inclination | 70 | 61? | 4 |
| HI flux | 1.2 Jy | 2.8 Jy | 6 |
| HI Deficiency | 0.99 | 1.09 | 7 |
| CO flux | 93 40 Jy | 56 30 Jy | 8 |
| Maximum stellar rotation velocity | 80 | 31 | 9 |
| FWHM (CO) | 150 | 70 | 8 |
| H flux | 4.9 10 ergs cm s | 6.0 10 ergs cm s | 5 |
| 60m Flux Density | 3.5 Jy | 3.1 Jy | 10 |
| 100m Flux Density | 7.1 Jy | 5.8 Jy | 10 |
| T | 36 K | 37 K | 10 |
| HI mass | 7.2 10 M | 1.7 10 M | 11 |
| H mass | 2.6 10 M | 1.6 10 M | 12 |
| M | 5.0 10 M | 3.8 10 M | 13 |
| L | 2.2 10 L | 1.8 10 L | 10 |
| L | 7.3 10 L | 6.2 10 L | 14 |
Note. — (1) Hubble types from Bingelli et al. 1987. (2) Hubble type from RC3. (3) Jacoby et al. 1992. (4) Optical size at 25 mag arcsec. (5) Radius in units of arc seconds at 25 R mag arcsec isophote, Koopmann et al. 2001. Total H flux. (6) Helou et al. 1984. (7) Kenney & Young 1989. The HI deficiency parameter is defined by Giovanelli & Haynes 1983. (8) Kenney & Young, 1988. (9) this work. Maximum stellar rotation velocity measured over the Densepak array. (10) Young et al. 1989. (11) HI mass from , where is in M, in Mpc, and in Jy (Kenney & Young 1989). (12) H mass from , where is in M, in Mpc, and is in Jy (Kenney & Young 1989). (13) Warm dust masses calculated as described by Young et al. 1989. (14) Blue luminosity, assuming = 5.48, and corrected for Galactic and internal extinction.