Mid Infrared Properties of Low Metallicity Blue Compact Dwarf Galaxies from Spitzer/IRS
Abstract
We present a Spitzer-based mid-infrared study of a large sample of Blue Compact Dwarf galaxies (BCD) using the Infrared Spectrograph (IRS), including the first mid-IR spectrum of IZw18, the archetype for the BCD class and among the most metal poor galaxies known. We show the spectra of Polycyclic Aromatic Hydrocarbon (PAH) emission in low-metallicity environment. We find that the equivalent widths (EW) of PAHs at 6.2, 7.7, 8.6 and 11.2 m are generally weaker in BCDs than in typical starburst galaxies and that the fine structure line ratio, [NeIII]/[NeII], has a weak anti-correlation with the PAH EW. A much stronger anti-correlation is shown between the PAH EW and the product of the [NeIII]/[NeII] ratio and the UV luminosity density divided by the metallicity. We conclude that PAH EW in metal-poor high-excitation environments is determined by a combination of PAH formation and destruction effects.
1 Introduction
Galaxies formed in the early Universe are likely to have very different properties from typical evolved galaxies in the local Universe because they were formed from an environment deficient in heavy elements. Important as they are, those primeval galaxies are beyond the capability of current mid-IR instruments, thus motivating an ongoing effort to identify local analogs of the galaxy formation process in the early Universe.
Blue compact dwarfs are a group of extra-galactic objects with faint, blue optical colors, small sizes and low metallicities. They are generally dominated by one or more recent bursts of star formation. Early studies hinted that BCDs have dramatically different properties compared to normal dwarf galaxies (Arp, 1965; Zwicky, 1966). Accumulated observational evidence over the recent years provided more details on the unique properties of these galaxies (for a review see Kunth & Östlin, 2000). Early ground based observations by Roche et al. (1991) on the mid-IR spectra of 60 galaxies revealed that PAH emission is generally suppressed in low-metallicity galaxies, which could be due to hard photons destroying the particles that produce the unidentified infrared bands. Thuan et al. (1999) has shown that there is no sign of these bands in the mid-IR spectrum of SBS0335-052E taken by the Infrared Space Observatory (ISO). The suppression of the PAH emission is also seen in the mid-IR spectra of 4 BCDs discussed by Madden et al. (2000); Galliano et al. (2005); Madden et al. (2005). Dwek (2004) proposed that the delayed injection of carbon molecules into the interstellar medium(ISM) might be partly responsible for the absence of PAH features in young star forming regions, or for the existence of a metallicity threshold below which PAHs have not formed. Hogg et al. (2005) suggested that the lack of PAH emission is closely related to the low luminosity of their sample. More recent work based on Spitzer observations has confirmed that PAH emission is missing in the most metal-poor galaxies (Houck et al., 2004b; Engelbracht et al., 2005). Hunt et al. (2005) studied the global spectral energy distributions (SEDs) of 7 BCDs and confirmed that those SEDs deviate significantly from the standard templates of “classical”, evolved and massive starburst galaxies, in the sense that the far-infrared (FIR) spectra peak at/or shortward of 60 m and mid-IR spectra show little or no PAH emission. Having a relatively low metallicity, these galaxies are at an early epoch of their evolution, making them similar to samples of the distant, more massive protogalaxies, thus allowing us to study the star formation and chemical enrichment in an environment likely to be similar to that in the early Universe.
Recently, mid-IR imaging and spectroscopy of a handful of such systems revealed the presence of dusty embedded sources as well as fine structure line emission in their spectra, consistent with a hard radiation field from massive young stars (Thuan et al., 1997; Madden et al., 2000, 2005). In general, short bursts (1-5 Myr) of intensive star formation are found to best match the data (Mas-Hesse & Kunth, 1999). Some BCDs appear to be very rapid star formers, and thus true dwarf analogs of giant starbursts (Kunth & Östlin, 2000). The profiles and strengths of the PAHs, which might be good tracers of star formation, vary substantially (Förster Schreiber et al., 2004).
Using the unprecedented sensitivity of the Infrared Spectrograph (Houck et al., 2004a) on the Spitzer Space Telescope (Werner et al., 2004), we compiled a large sample of of the lowest metallicity galaxies known. Since little information on their mid-IR fluxes were available from literature, a large fraction of them were first observed with the peak-up cameras at 16 and 22 m. As we discuss in detail in the following section, those which were bright enough were observed spectroscopically. In this paper we present 5.2–36 m spectra of 12 galaxies for which the signal-to-noise ratio (SNR) was high enough to perform a quantitative analysis on the strength of the spectral features, as well as 16 and 22 m broad band imaging for the remaining of the sample, covering metallicities from 1/50 Z⊙ to 0.65 Z⊙. Many of the remainders are scheduled for re-observation to achieve higher SNR. In Section 2, we describe the sample, the observing strategy, and the data reduction. Section 3 presents the spectral features observed in each source while our analysis on these properties is shown in Section 4. We summarize our conclusions in Section 5. Throughout this work, we assume a CDM cosmology with H0 = 71 km s-1 Mpc-1, = 0.3 and .
2 Observations and Data Reduction
A total of 61 BCDs have been observed as part of the IRS Guaranteed Time Observation (GTO) program. The sample included targets from the Second Byurakan Survey (SBS), Bootes Void galaxies (Kirshner et al., 1981; Popescu & Hopp, 2000), and several well-known BCDs. Some basic properties of these galaxies and the observing parameters, such as: source names, right ascension (RA), declination (Dec), redshift, Spitzer aorkeys, observation date, and on-source integration time for each module and peak-up mode are listed in Table 1.
We used all four IRS modules, Short-Low (SL, 5.2-14.5 m), Long-low (LL, 14.0-38.0 m), Short-High (SH, 9.9-19.6 m) and Long-high (LH, 18.7-37.2 m) to obtain spectra for 26 sources which were expected to be sufficiently bright for spectroscopy. SBS1200+589B was the only one of the targets that was not observed in SL. The low resolution modules (SL, LL) produce spectra with a resolution of 64–128 while the high-resolution modules (SH, LH) have a resolution of 600 (see Houck et al., 2004a). Nearly all targets were acquired using red peak-up (RPU) mode. In the process, an image of the source at 22m was obtained in Double Correlated Sampling (DCS) mode and it was used to locate the mid-IR centroid of the source which was then offset to the appropriate slit (see Spitzer Observers Manual for more details). For BCDs that were too faint for spectroscopy, we only obtained broad band imaging at 16 m (13.5-18.7 m) and 22 m (18.5-26.0 m) using both IRS peak-up cameras in Raw Data Collection (RAW) mode. Details on this method of imaging with IRS, also called CHEAP for Cornell High-Efficiency Advanced Peak-up, and its photometric advantages compared to the usual IRS Peakup Only mode are discussed in Charmandaris et al. (2004). Eight of our galaxies were so faint in the mid-IR that only an upper limit of 0.1mJy could be established for their 16 and 22m flux densities.
The data were processed by the Spitzer Science Center (SSC) data reduction pipeline version 11.0 and 11.4111The usage of data products from two versions of the pipeline was a result of the extended time-span over which sample was observed and the delivery of the files from the SSC. The difference between the two versions is very small and it does not introduce any inhomogeneity in the sample or influence the conclusions of the paper.. The 2-D image data were converted to slopes after linearization correction, subtraction of darks, and cosmic ray removal. The DCS peak-up imaging data were processed on the ground to remove cosmic rays and the residual noise of the electronics. Fixed aperture photometry was then performed in order to obtain the counts of the science target. The conversion to flux density was based on a number of calibration stars for which peak-up images, IRS spectra, and reliable templates are available (Cohen et al., 2003). The reduction of the spectral data started from the intermediate pipeline products (droop files), which only lacked stray light and flat field correction. Individual pointings to each nod position of the slit were co-added using median averaging and for SL and LL spectra, the two apertures were differenced in order to remove the contribution of the background. The 2-D images were extracted with the Spectral Modeling, Analysis, and Reduction Tool (SMART Ver. 5.5.1 Higdon et al., 2004) using a variable width aperture, which scales the extraction aperture with wavelength to recover the same fraction of the diffraction limited instrumental point-spread-function (PSF). The data from SH and LH were extracted using the full slit extraction method from the median of the combined images. Since no sky (off–position) measurements were taken, the contribution of the sky emission was not subtracted from SH and LH spectra. Then the spectra were flux calibrated by multiplication with the Relative Spectral Response Function (RSRF), which was created from the IRS standard stars Lac for SL and LL and Dra for SH and LH for which accurate templates were available (Cohen et al., 2003). We built our RSRFs by extracting the spectra of the calibration stars in the exact same way as the science targets, and dividing the stellar templates by the extracted stellar spectra. We produced one RSRF for each nod position in order to avoid systematic flat field errors. The signal difference between the nod positions provide the error estimates. Finally, the flux calibrated spectra of each order and module of the low-resolution modules except 1st order LL (LL1) (20–36m) were scaled, using LL1 spectrum to define the continuum (presented in Fig.1 and 2). The associated photometric points are also presented on the spectra in Fig.1 and 2.
3 Results
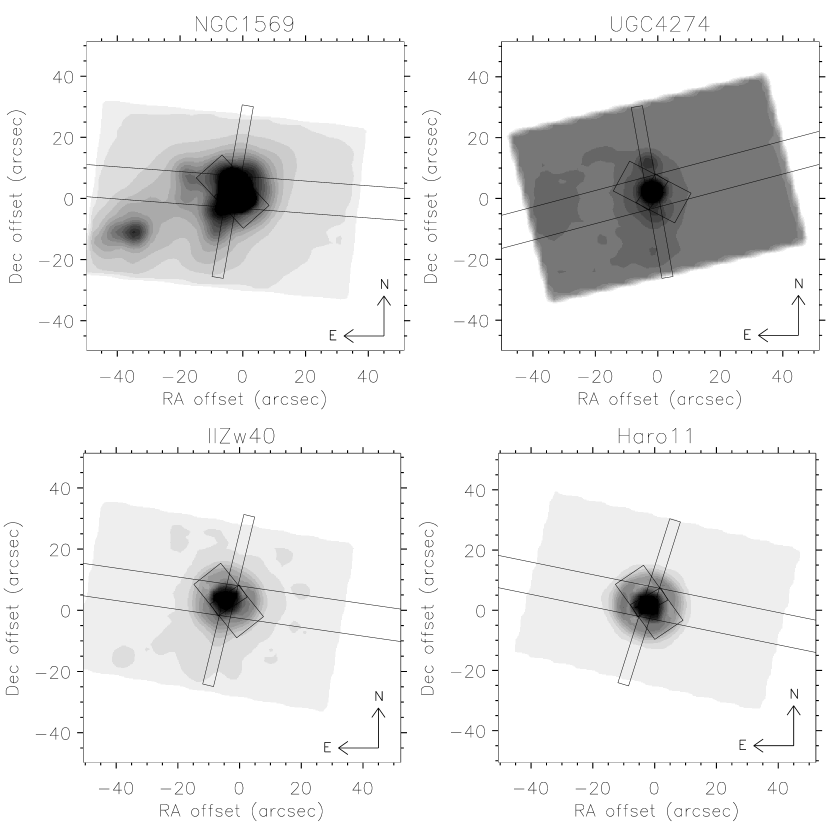
From the 26 BCDs observed spectroscopically, only 11 produced spectra with SNR sufficient for features to be measured (SNR in the 5–8m range of the 2nd order SL, SL2). These spectra are presented in Fig.1 and 2. We also include the first mid-IR spectrum of IZw18222The overall shape of the mid-IR continuum is evident from Fig. 1, but a measurement of spectral features is challenging due to the noise in the spectrum.. The 22 m flux density of each target with an aperture radius of 7.2 measured during its acquisition using the red peak-up camera (circle), as well as a “synthetic” 22 m flux obtained by convolving the spectrum with the filter response function (square) are indicated in the Fig.1 and 2. The IRAC 8 m (asterisk) and MIPS 24 m (triangle) flux densities are also indicated when available (Engelbracht et al., 2005). One can see that for all point sources, including SBS0335-052E, NGC1140, Mrk1499, Mrk1450, CG0598, CG0752, UM461 and IZw18, the two broad band values for the RPU agree very well. NGC1140 is marginally saturated at 22 m, but we correct for this effect based on the PSF profile. The agreement of the spectra and the photometric measurements indicates the internal consistency of the calibration of the instrument between spectroscopy and peak-up photometry when all spectra are scaled to LL1. However, as expected, for sources which are extended or well above the 340 mJy saturation limit of red peak-up in a 8.4 second exposure time, such as NGC1569, IIZw40, Haro11 and UGC4274, there is a disagreement among these photometric measurements (See Fig.1 and 2).
It is clearly seen from Fig. 1 and 2 that the forbidden transitions of [SIV] at 10.51 m and [NeIII] at 15.55 m are visible even in the low-resolution spectra, while [NeII] at 12.81 m, [SIII] at 18.71 m and [SiII] at 34.8 m lines are seen in most of them. The line fluxes used in the analysis are determined from high-resolution spectra (See Fig.3). The emission from PAHs at 6.2, 7.7, 8.6 11.2 and 12.8 m are also clear in several of our targets and they are indicated in the figures but no pronounced silicate emission or absorption features are present. All PAH measurements presented in this paper were measured from the low-resolution spectra.
3.1 Mid infrared Morphology
As mentioned in Section 2, all spectroscopic observations were preceded by an acquisition using the 22m peak-up camera. This provided not only more precise position of the objects for telescope pointing, but also deep 22 m images of our targets. Analysis of those images indicates that with the exception of four galaxies: NGC1569, UGC4274, IIZw40 and Haro11, all other targets are unresolved at 22 m (FWHM=6.5″) . In Fig.4, we display the 22 m images of these four galaxies, overlayed with the spectrograph slits as they were placed when the spectra were obtained. Among those targets NGC1569 shows the most complex structure with two bright cores in the mid-IR. This source also has very extended emission in the optical. Therefore, not surprisingly, it requires a large scaling factor of 80% when we “stitch” the spectra of 1st order SL (SL1) and 2nd order LL (LL2), mostly due to the different slit widths and orientations between the two low-resolution modules. In UGC4274, we find that most of its 22 m flux originates from a compact unresolved knot while a similar peak is seen in the near infrared which is offset by from the mid-IR one.
3.2 Individual Objects
IZw18 — This is the first identified member of the blue
compact dwarf galaxy class (Searle & Sargent, 1972) and until
recently333Only this year (2005) measurements of
Izotov et al. (2005) showed that the brightest star formation region of
the western component of SBS0335-052 has an oxygen abundance of only
12+log(O/H)=7.120.03 (0.017 Z⊙), suggesting it is
the most metal poor galaxy known. held the record of a galaxy with
the lowest metallicity at Z 0.02 Z⊙
(Skillman & Kennicutt, 1993). IZw18 is located at a distance of 12-15 Mpc and
is a bona fide young galaxy and no red giant branch stars are
seen(Izotov et al., 2004). Zwicky (1966) described it as a double
system of compact galaxies, which are in fact two star-forming
regions, a northwest component and a southeast one, separated by an
angular distance of 5.8″. Examination of the spatial
distribution of the stellar populations suggest that the star
formation process is still building the main body from inside out
(Izotov et al., 2004). Both Izotov et al. (1997a) and Legrand et al. (1997)
detected several broad emission components in this BCD, suggesting
that Wolf-Rayet (WR) features can also exist in extremely low
metallicity environment. It is intrinsically very faint in the
infrared. The first mid-IR spectrum of IZw18 is presented in Fig.1. As
we discuss in the subsequent sections we are able to estimate the
mid-IR spectral slope from its low-resolution spectrum. The fine
structure lines of [SIV] and [NeIII] can clearly be seen in its
high-resolution spectrum, though the identification of [NeII] and
[SIII] is not yet firm. A much deeper observation with more exposure
time has been scheduled and the new spectrum will be presented in a
future paper (Wu et al. in prep, 2006).
SBS0335-052E — Currently the third most metal-poor galaxy
known with 0.024 Z⊙ (Izotov et al., 1997b), SBS0335-052E is at a
distance of 58 Mpc. Thuan et al. (1997) found that stars in SBS0335-052E
are younger than 100 Myr and the current burst of star formation
is no older than 5 Myrs, thus making it a truly young system. This
galaxy is unexpectedly bright in the mid-IR
(Thuan et al., 1999; Houck et al., 2004b) with roughly 75% of the total luminosity
coming from the mid-IR (Plante & Sauvage, 2002). It has six compact regions
of massive star formation, five of which are visible and one obscured,
and all of them lying within a diameter of 526 pc (Thuan et al., 1997).
There is no sign of PAH emission in its spectrum and silicate
absorption at 9.7 m is clearly seen. The SED of the galaxy is
dominated by a very strong continuum, which unlike typical star
forming galaxies, such as NGC7714 (Brandl et al., 2004), peaks at
28 m (fν), indicating the presence of little cold
dust. The fine structure lines of [NeIII] and [SIV] are present,
though not very strong.
UM461 — This is a dwarf galaxy with a double nucleus and is
found at a distance of 15 Mpc. It has an external envelope which is
strongly distorted towards the South-West, suggesting a recent tidal
event (Doublier et al., 1999). The metallicity of UM461 is 0.087
Z⊙ (Kniazev et al., 2004). With only 168 seconds of integration
time in SL module, the obtained spectrum is very noisy. However, the
fine structure lines, such as [SIV], [NeIII] and [SIII] can be clearly
seen longward of 10 m. The identification of PAH emission is
doubtful and an upper limit of 0.199 m for the PAH EW at
11.2 m is indicated in Table 4.
Haro11 — This is a metal poor galaxy with 0.1
Z⊙ (Bergvall et al., 2000). Its distance is 88 Mpc and it
has an infrared luminosity, LIR of 1.81011
L⊙444Calculated from the IRAS flux densities
following the prescription of Sanders & Mirabel (1996): LIR=5.6105D()..
Haro11 is a moderately strong radio source, with spatially extended
continuum emission at 6 and 20
cm(Vader et al., 1993; Heisler & Vader, 1995). Multiple nuclei are apparent on
optical broad band images (Heisler & Vader, 1994) as well as narrow-band
H images (Heisler & Vader, 1995). All three nuclei are similar in
continuum stellar emission (Heisler & Vader, 1995) and spectra of the
nuclei confirm that they are all at the same distance
(Vader et al., 1993). The PAH features are much weaker compared with
NGC1140 but the fine structure lines of [SIV], [SIII], [NeIII] and
[NeII] lines are clearly present.
Mrk1450 — A dwarf compact object with a projected dimension
less than 1 kpc, Mrk1450 is located at a distance of 14 Mpc. Its
optical images display moderately deformed circular isophotes and a
central star forming component. A strong color gradient is present
reaching a 2.2 mags at the outskirts of the galaxy, while the
surface brightness distribution obeys an r1/4 law
(Doublier et al., 1997). This galaxy has an LIR555For
this galaxy, the IRAS 12 m and 25 m flux densities
are calculated by convolving our spectrum with the IRAS
filters. The 100 m flux density is an upper limit, thus making
the LIR also an upper limit. less than 1.8108
L⊙. Its metallicity is 0.12 Z⊙
(Izotov & Thuan, 1999). Due to the low SNR in SL2, PAH emission can not be
identified clearly below 10m, even though the 11.2 m and
possibly 12.8 m PAHs are present. The fine structure lines of
[SIV] and [NeIII] are strong.
IIZw40 — This is a prototypical H II galaxy
(Sargent & Searle, 1970) with LIR666For this galaxy, only
upper limit exists for IRAS 100 m, thus making the LIR also an upper limit. less than 2.9109 L⊙ at
a distance of 10 Mpc. The metallicity of this galaxy is
0.17 Z⊙ (Cerviño & Mas-Hesse, 1994). It consists of a compact,
extremely bright core and two fan-like structures, which have been
interpreted as the result of a merger between two small galaxies
(Baldwin et al., 1982; Brinks & Klein, 1988). Star formation is concentrated in the
nucleus while the double structure is quite red and shows no star
formation activity (Cairós et al., 2001). H emission is very
strong, contributing 40% to the band flux at the nucleus. The
starburst could be very young and its strength is rather extraordinary
(Deeg et al., 1997). It also displays WR features (Conti, 1991). Our
mid-IR spectrum indicates that the PAHs are present, though extremely
weak. The fine structure lines of [SIV], [SIII], [NeII] and [NeIII],
have been detected.
NGC1569 — A nearby dwarf galaxy (D2.2 Mpc
Israel, 1988) which has a metallicity of 0.19 Z⊙
(Kobulnicky & Skillman, 1997) and is currently in the aftermath of a massive
burst of star formation (Waller, 1991), with LIR of
5.8108 L⊙. It lies close to the plane of the
Galaxy and therefore its optical properties are strongly affected by
the Galactic dust extinction (Kinney et al., 1993). The presence of a
broad emission feature around 4650 Å and a broad base to the
H line indicate that WR stars are present in the nucleus of
NGC1569 (Ho et al., 1995). It contains two bright super star clusters.
The very hot, bright nucleus of this galaxy resembles a superluminous,
young star cluster (Arp & Sandage, 1985). The fine structure lines of [SIV]
and [NeIII] are stronger compared to [SIII] and [NeII], which can be
seen clearly even in the low-resolution spectrum (See Fig.2). The PAH
features are clearly present. As discussed by
Galliano et al. (2003, 2005), the mid-IR emission is dominated by
small grains.
Mrk1499 — This is an irregular galaxy displaying a very blue
elongated central structure with two components in the optical, the
brightest being off-centered with respect to the outer contours
(Doublier et al., 1997). These authors suggested that this structure is
reminiscent of “double nuclei” objects, while Petrosian et al. (2002)
argued that this could be just an observational artifact. It has an
LIR777For this galaxy, only IRAS 60 m and
100 m are available. For IRAS 12 m and 25 m,
we convolved our spectrum with the two IRAS filters and
calculated their values. of 1.3109 L⊙ and is at a
distance of 38 Mpc. An oxygen abundance of 0.3
Z⊙ has been derived from the line measurements of
Petrosian et al. (2002), using the N2 calibrator (Denicoló et al., 2002),
which allows us to calculate the oxygen abundance based on the
[NII]/H ratio. PAH features are prominent and several fine
structure lines are detected. In this particular galaxy, the SNR in
SL2 is rather poor, thus making the definition of the continuum
challenging. We measured the 6.2 m PAH EW by defining a maximum
and minimum local continuum and then averaging the two
measurements.
NGC1140 —This is a blue irregular galaxy at a distance of
25 Mpc, containing large mass of ionized gas in its center
(Kinney et al., 1993). Its metallicity is 0.4 Z⊙
(Calzetti, 1997). Lamb et al. (1986) concluded that NGC1140 has
experienced a single burst of star formation and its population mainly
consists of main-sequence stars with a contribution from supergiants
and, possibly, WR stars. Hunter et al. (1994) used the Hubble Space
Telescope (HST) Planetary Camera to study the central supergiant
H II region and found that the central 1/2 kpc of NGC1140
contains 7 blue, luminous, compact super star clusters. It has a
very small average size of grains (Galliano et al., 2003, 2005)
and a LIR of 4.3109 L⊙. The low
resolution mid-IR spectrum shows pronounced PAH emission, almost
comparable to that in the typical starburst galaxy NGC7714,
while the fine structure lines are stronger compared with NGC7714.
UGC4274 — A galaxy also known as NGC2537 and Mrk86, UGC4274 is
extended in the mid-IR (see Fig.3) and is located at a distance of
7 Mpc. It has a large, very irregular nucleus consisting of
80 star-forming knots distributed in a circular region which is
surrounded by a red envelope (Gil De Paz, 2000). The H
image shows a very complex gas distribution, with multiple filaments,
loops and twisted features (Cairós et al., 2001). It has an LIR
of 5.0108 L⊙ and emission from PAHs dominates its
spectrum. An oxygen abundance of 12+log(O/H)=8.05 (Z0.13
Z⊙) has been derived by Meier et al. (2001) based on the
relationship between B magnitude and metallicity. Since this method
has a large uncertainty and there is no direct spectroscopically
measured oxygen abundance available, we calculated the metallicity
using the N2 calibrator. A value of 12+log(O/H)=8.52
(Z0.41 Z⊙) has been derived from the line measurement
in Ho et al. (1997). All major mid-IR fine structure lines of the galaxy
are very strong.
CG0598 — This is a galaxy selected from the Bootes Void sample.
It is at a distance of 253 Mpc and it has an
LIR888The IRAS 12 m and 25 m
flux densities are calculated by convolving the spectrum with the
IRAS filters. The IRAS 100 m flux density is an
upper limit thus making LIR an upper limit as well. less than
5.91010 L⊙. In the optical, this galaxy is a
flattened disk system with a bright, round nucleus. It has a smooth,
elongated surrounding disk which is asymmetric with respect to the
nucleus (Cruzen et al., 1997). The metallicity of this galaxy is
0.65 Z⊙ (Peimbert & Torres-Peimbert, 1992). In Fig.2, we can see that
CG0598 shows very strong PAH emission in all bands and the usual fine
structure lines of [NeII], [NeIII], [SIV] and
[SIII] can be identified.
CG0752 — This galaxy is 91 Mpc away with an LIR999The IRAS 12 m flux density is calculated
by convolving the spectrum with the IRAS filter. of
2.21010 L⊙. It has remained uncatalogued for a
long time because of its proximity to bright star
(Sanduleak & Pesch, 1987). PAH emission is moderately strong and the
fine structure lines of [SIV], [SIII], [NeIII] and [NeII] are
present. There is no measured oxygen abundance available from
literature for this galaxy.
4 Analysis
4.1 The mid-infrared spectral slope of BCDs
The photometric properties and metallicities of the 53 galaxies in our BCD sample (excluding the 8 objects that were too faint in mid-IR) are listed in Table 2. The 16 and 22 m flux densities of the sources are based on broad band imaging using the blue or red peak-up cameras, while the B and K magnitudes are taken from literature. For the 12 BCDs with good IRS spectra, we also calculated their “synthetic” 16 and 22 m flux densities by convolving the spectra with the IRS peak-up filters. For comparison, we list those values in Table 3. We also present the 22 to 16 m flux density ratio, / ())in Table 2. This ratio provides the mid-IR slope of the spectrum and can be a useful probe of the shape of the mid-IR SED even if the galaxy are too faint to obtain a spectrum. One of our sources, SBS0335-052E, has a particularly low value of /, indicating the absence of cold dust around the central star forming region. As discussed by Houck et al. (2004b), the SED of SBS0335-052E peaks maximum fν at a much shorter wavelength of 28 m while most normal galaxies peak longward of 60 m.
We explore the variation on the / ratio as a function of metallicity in Fig.5a. In addition to the 12 BCDs, we include in this figure a typical starburst galaxy NGC7714 (Brandl et al., 2004), and an Ultra-Luminous Infrared Galaxy (ULIRG), UGC5101 (Armus et al., 2004), in order to sample a wider range of different types of galaxies forming massive young stars. The BCDs with only photometric CHEAP images are included using crosses as well when their metallicities are available from literature. It has been pointed out by Hunter et al. (1989) that no clear metallicity dependence is observed in mid-IR and FIR colors of normal galaxies. This is also confirmed in Fig.5a where the / ratio for all the BCDs seems to have an average value of 2.5 and shows no metallicity dependence.
In Fig.5b and 5c, we plot the ratio of the flux density at 22 m to the IRAC 8 m band, /, as well as the MIPS 24 m to the IRAC 8 m, /, as a function of their metallicities. The IRAC 8 m and MIPS 24 m flux densities are calculated by convolving the mid-IR spectra of these BCDs with the appropriate filter profiles. Engelbracht et al. (2005) observed that the 8 m to 24 m color changes markedly between 1/3 to 1/5 solar metallicity and suggested that this change is predominantly due to a decrease in the 8 m emission. Our Fig.5b and 5c are very similar to Fig.2 in their paper. It appears that there is a separation on the / ratio around 1/5 Z⊙ on our plots with the exception of SBS0335-052, which as mentioned earlier shows no PAH detection.
It is very important to note that, as shown by our data, using the /, or / ratios to infer the strength of the PAH emission is not a very robust method. Since the 7.7 m and 8.6 m PAH emission is included in the IRAC 8 m band, one might expect that a lower / ratio would indicate the presence of a stronger PAH emission from the galaxy. However, a low / ratio can also be due to decreased emission at 22 m, resulting from the lack of cooler dust. A galaxy with a flat continuum but no PAH emission can have the same / ratio as a galaxy which shows strong PAH emission and a steep continuum. If we consider SBS0335-052E and UGC4274, we can see that they have a very similar / ratio, even though no PAHs are detected in SBS0335-052E while PAHs are prominent in UGC4274. This can be understood when we take into account the / ratio. It is evident from Fig.5a that these two sources have very different mid-IR spectral slopes. This explains why SBS0335-052E lies away from the upper left corner of Fig.5a. We have also plotted the PAH EW at 6.2 m and 11.2 m as a function of the / ratio in Fig.6a and 6b. We can see that overall a lower / value indicates a stronger PAH emission, but there are some measurements that deviate from this trend. For completeness we also present the PAH EW at 6.2 m and 11.2 m as a function of / in Fig.6c and 6d but no clear correlation can be seen.
4.2 PAH and metallicity
In Section 1, we mentioned that the absence of PAH emission could be due to the low abundance of carbon and/or nucleating grains. In SBS0335-052E, the most metal poor galaxy for which a high quality mid-IR spectrum is available, there is an upper limit of just 0.018 m in the EW of the 6.2m feature (Houck et al., 2004b). To examine a possible variation in the PAH EW with metallicity, we plotted the PAH EW of 6.2 m and 11.2 m for our sample as function of their metallicity in Fig.7. The PAH EW were derived by integrating the flux of the feature in the mean spectra of both nod positions above an adopted continuum, and then divided by the average continuum flux in the integration range. The baseline was determined by fitting a spline function to the selected points. The wavelength limits for the integration of the features were approximately 5.95 m to 6.55 m for the 6.2 m PAH, 7.15 m to 8.20 m for the 7.7 m PAH, 8.20 m to 8.90 m for the 8.6 m PAH and 10.80 m to 11.80 m for the 11.2 m PAH feature. Here we only plot the 6.2 m and 11.2 m PAH EW, but measurements on the 7.7 m and 8.6 m PAH EW can be found in Table 4. We can see that PAH emission is absent in the most metal-poor BCDs and its strength is generally suppressed in a low metallicity environment. This result is contrary to what has been found in typical starburst galaxies where the PAH EW is much stronger with values greater than 0.5 m for the 6.2 m and 7.7 m PAH bands (i.e. Brandl et al., 2004; Brandl et al. in prep, 2005). In Fig.7, it appears that there is a trend showing that galaxies with a lower metallicity may have smaller PAH EW. Except for the two galaxies which have large uncertainty in their oxygen abundance, the PAH EW and metallicity seem to correlate quite well. The errors in the EW indicated in Fig.7 vary from one source to the other and are mainly due to the different SNR among the sources. Quantifying this relation by a least-squares (logarithmic) fit gives us a slope of N=1.57 for the 6.2 m PAH EW and N=1.16 for the 11.2 m PAH EW. This weak trend we are seeing that the PAH EW is probably related to metallicity effects agrees with the relation suggested by Hogg et al. (2005) and Engelbracht et al. (2005).
4.3 The hardness of the radiation field
The presence of a young starburst in a low metallicity environment results in the production of high energy photons which can propagate relatively large distances before being absorbed by the metals in the ISM. High-resolution IRS spectra were taken of 26 galaxies and the results for the 12 BCDs that we discussed above are summarized in Fig.3 and Table 4. Because of the rather large difference in the ionization potentials of Ne++ (41eV) and Ne+ (22eV), the ratio of [NeIII]/[NeII] is a good tracer of the hardness of the interstellar radiation field (Thornley et al., 2000). The [SIV]/[SIII] ratio, another indicator of the hardness of the radiation field has also been studied in this paper. Given the fact that extinction in mid-IR is only a few percent of the optical extinction (Draine, 2003), those line ratios are far less sensitive to the differential extinction compared to optical or UV lines. We plot the two line ratios in Fig.8. Since the extinction effects on [NeIII] (15.55 m) and [NeII] (12.81 m) are similar, the ratio of [NeIII]/[NeII] is only weakly affected by extinction, while for [SIV]/[SIII], we indicate the effect of differential extinction by the arrow on the upper left corner of the plot for an Av of 13 mag.
We also studied the dependence of [NeIII]/[NeII] ratio on metallicity and the results are presented in Fig.9. We find that our 11 BCDs (CG0752, which has no metallicity measurements in literature, is not included.) appear to define a band, where galaxies with lower metallicity display a higher [NeIII]/[NeII] ratio, thus harboring a harder radiation field. For a given [NeIII]/[NeII] ratio, there is significant scatter within metallicities. This scatter could be due to local variations or differential/patchy dust extinction in these systems. It also suggests that the metallicity may not be the only factor that affects the hardness of the radiation field. The results on the [SIV]/[SIII] ratio are plotted in Fig.10 and we can see that it shares a similar trend as the [NeIII]/[NeII] ratio. For the discussion that follows we choose the [NeIII]/[NeII] ratio since it is less dependent on the extinction and the neon lines are generally stronger. Further more, the [NeIII] and [NeII] lines span a wider range in ionization potential than [SIV] and [SIII].
4.4 PAH and the [NeIII]/[NeII] ratio
As discussed by Madden et al. (2000), PAHs are at best a minor dust component in dwarf galaxies. In Fig.11, we plot the EW of the 6.2 and 11.2 m PAHs as a function of the hardness of the radiation field, using [NeIII]/[NeII] as an indicator. We observe that the PAH EWs at 6.2 and 11.2 m are generally suppressed in a harder radiation field as indicated by a larger [NeIII]/[NeII] ratios, suggesting that the deficiency in PAH emission may be related to the destruction of the photodissociation region (PDR) by hard UV photons. However, the trend we see is weak. A conventional least-squares fit that minimizes (logarithmic) residuals in PAH EW yields a slope of N=-0.91 for the 6.2 m PAH and N=-0.92 for the 11.2 m PAH. In addition, we found that for a given [NeIII]/[NeII] ratio, we can have different PAH EW values. For example Haro11 has a considerably weaker PAH EW at both 6.2 m and 11.2 m as compared with NGC1140 even though they have a very similar [NeIII]/[NeII] ratio. This scatter indicates that some other or additional process is in play.
4.5 PAH and luminosity density
Another important parameter of the radiation field is its UV luminosity density. Does this also play a role in the destruction of PAH molecules? In young starbursts, LFIR is representative of the total UV luminosity. We estimate the luminosity density of the 12 BCDs in our sample, using the 22 m luminosity. Takeuchi et al. (2005) show that there is linear relation between the mid-IR luminosities (12 m or 25 m) and the total infrared luminosity, even though Dale et al. (2005) has shown a peak-to-peak uncertainty of a factor of 5 in using the 24 m luminosity to indicate the total infrared luminosity for their sample of starburst galaxies. We calculate L22μm using the 22m images obtained with the red peak-up camera and divide it by the estimated volume (V) of the objects from their optical or infrared images101010We use the mid-infrared images to estimate the volume for sources that are resolved at 22 m and the optical images for the rest of the sample.. This should be proportional to the UV luminosity density. The results are listed in Table 5. We present the 6.2 and 11.2m PAH EW as a function of the 22m luminosity density in Fig.12. There are fewer data points on the plot compared to the table since we do not have PAH EW measurement for all the galaxies in Table 5. We can see that there is a trend that PAH EW decreases with increasing luminosity density. However, this relation is somewhat weak. A least-squares fit (logarithmic) of the slope returns N=-0.63 for the 6.2 m PAH and N=-0.77 for the 11.2 m PAH. There is considerable scatter on this plot. For instance, SBS0335-052E and Haro11 have very similar /V value, but we have not found any PAH emission in SBS0335-052E while PAHs are weak but clearly present in Haro11.
A plot of the dependence of the PAH EW as a function of the product of the hardness of the radiation field and the luminosity density, [NeIII]/[NeII]*L22μm/V is presented in Fig. 13. We observed that it is better correlated than both the PAH EW vs [NeIII]/[NeII] and PAH EW vs luminosity density. A least-squares fit (logarithmic) returns N=-0.39 for 6.2 m PAH and N=-0.47 for 11.2 m PAH. This suggests that an increased density of harder photons destroys more PAH molecules. The fact that we are seeing a better correlation on Fig.13 than in Fig.11 or Fig.12 suggests that both the luminosity density and the hardness of the radiation field contribute to the destruction of PAHs.
4.6 PAHs: formation and destruction effects
We have shown in the previous section that there are generally weaker PAHs in metal-poor environments. We have also discussed the effects of the hardness of the radiation field and the luminosity density on the destruction of PAH molecules. Is the absence of PAHs in metal-poor galaxies solely due to formation effects or destruction effects or some combination? To examine this we plot the PAH EW as a function a new quantity: ([NeIII]/[NeII])(L/V)(1/Z), where the product of the neon ratio and the luminosity density represents the destruction effect and Z, the metallicity of the galaxy, represents the formation effect. We can see in Fig. 14 that there is a much tighter anti-correlation on this plot as compared to the previous series of plots on the PAH EW we have shown. A least-squares fit (logarithmic) gives a slope of N=-0.39 for the 6.2 m PAH and N=-0.43 for the 11.2 m PAH. We conclude that both the formation effects (Z) and the destruction effects ([NeIII]/[NeII])(L/V) contribute to the weak PAH EW.
5 Conclusions
We have explored the mid-IR properties of blue compact dwarf galaxies with Spitzer IRS. We obtained broad band images at 16 and 22 m from the IRS peak-up camera. Using the low-resolution IRS spectra, we detected emission from PAHs, at 6.2, 7.7, 8.6, 11.2 and 12.8 m, for most of our galaxies though the strength varies considerably. We also detected a number of fine structure lines in our mid-IR spectra, including [SIV], [NeII], [NeIII] and [SIII] and found that for metallicities ranging between 1/50 Z⊙ to 0.65 Z⊙, the line ratios, [NeIII]/[NeII] and [SIV]/[SIII], which measure the hardness of the ionization field, vary inversely with metallicity. Our study yielded the following conclusions:
1) The ratio of / is 2.5 on average, but it does not show any dependence on metallicity.
2) Both the emission of PAHs and a hot dust component affect the / (or /) ratio in a similar way. These effects are difficult to disentangle without mid-IR spectra or measurements of the mid-IR fluxes at several wavelengths. Predictions of the strength of PAHs based on a single pair of mid-IR broad band fluxes may be problematic and should be used with caution (see Fig. 5 and 6).
3) The emission of PAHs in metal-poor BCDs is generally suppressed (see Fig 7).
4) The product of the hardness of the radiation field as traced by the neon line ratio with the mid-IR luminosity density, a “stand in” for the intensity of UV luminosity, correlates well with the PAH EW (see Fig. 13).
5) The product of the hardness of the radiation field and the luminosity density divided by the metallicity of the galaxies has a strong correlation with the PAH EW. This suggests that the absence of PAHs in metal-poor environment is due to a combination of formation effects and destruction effects (Fig.14).
References
- Armus et al. (2004) Armus, L., et al. 2004, ApJS, 154, 178
- Arp & Sandage (1985) Arp, H., & Sandage, A. 1985, AJ, 90, 1163
- Arp & Oconnell (1975) Arp, H., & Oconnell, R. W. 1975, ApJ, 197, 291
- Arp (1965) Arp, H. 1965, ApJ, 142, 383
- Baldwin et al. (1982) Baldwin, J. A., Spinrad, H., & Terlevich, R. 1982, MNRAS, 198, 535
- Brandl et al. (2004) Brandl, B. R., et al. 2004, ApJS, 154, 188
- Brandl et al. in prep (2005) Brandl, B. R., et al. 2005, in preparation
- Bergvall et al. (2000) Bergvall, N., Masegosa, J., Östlin, G., & Cernicharo, J. 2000, A&A, 359, 41
- Brinks & Klein (1988) Brinks, E., Klein, U. 1988, MNRAS, 231, 63p
- Charmandaris et al. (2004) Charmandaris, V., et al. 2004, ApJS, 154, 142
- Cairós et al. (2001) Cairós, L. M., Caon, N., Vílchez, J. M., González-Pérez, J. N., & Muñoz-Tuñón, C. 2001, ApJS, 136, 393
- Calzetti (1997) Calzetti, D. 1997, AJ, 113, 162
- Cerviño & Mas-Hesse (1994) Cerviño, M., & Mas-Hesse, J. M. 1994, A&A, 284, 749
- Cohen et al. (2003) Cohen, M., Megeath, T.G., Hammersley, P.L., Martin-Luis, F., & Stauffer, J. 2003, AJ, 125, 2645
- Conti (1991) Conti, P. S. 1991, ApJ, 377, 115
- Cruzen et al. (1997) Cruzen, S. T., Weistrop, D., & Hoopes, C. G. 1997, AJ, 113, 1983
- Dale et al. (2005) Dale, D. A. et al. 2005, astro-ph/0507645
- De Vaucouleurs et al. (1991) De Vaucoulers, G., De Vaucoulers, A., Corwin Jr., H. G., Buta, R. J. Paturel, G., & Fouque, P. 1991, Third Reference Catalogue of Bright Galaxies, version 3.9
- Deeg et al. (1997) Deeg, H.-J., Duric, N., & Brinks, E. 1997, A&A, 323, 323
- Denicoló et al. (2002) Denicoló, G., Terlevich, R., & Terlevich, E. 2002, MNRAS, 330, 69
- Dwek (2004) Dwek, E. 2004, in ”The Spectral Energy Distribution of Gas-Rich Galaxies: Confronting Models with Data”, Heidelberg, 4-8 Oct. 2004, eds. C.C. Popescu and R.J. Tuffs, AIP Conf. Ser., in press, astro-ph/0412344
- Doublier et al. (1997) Doublier, V., Comte, G., Petrosian, A., Surace, C., & Turatto, M. 1997, A&AS, 124, 405
- Doublier et al. (1999) Doublier, V., Caulet, A., & Comte, G. 1999, A&AS, 138, 213
- Draine (2003) Draine, B. T. 2003, ARA&A, 41, 241
- Engelbracht et al. (2005) Engelbracht, C. W., Gordon, K. D., Rieke, G. H., Werner, M. W., Dale, D. A., & Latter, W. B. 2005, ApJ, 628, L29
- Förster Schreiber et al. (2004) Förster Schreiber, N. M., Roussel, H., Sauvage, M., & Charmandaris, V. 2004, A&A, 419, 501
- Gallego et al. (1997) Gallego, J., Zamorano, J., Rego, M., & Vitores, A. G. 1997, ApJ, 475, 502
- Galliano et al. (2003) Galliano, F. Madden, A. P., Jones, C. D., Wilson, J.-P., & F. Le Peintre 2003, A&A, 407, 159
- Galliano et al. (2005) Galliano, F., Madden, S. C., Jones, A. P., Wilson, C. D., & Bernard, J.-P. 2005, A&A, 434, 867
- Gil De Paz (2000) Gil de Paz, A. 2000, Ph.D thesis
- Gil de Paz et al. (2003) Gil de Paz, A., Madore, B. F., & Pevunova, O. 2003, ApJS, 147, 29
- Guseva et al. (2003) Guseva, N. G., Papaderos, P., Izotov, Y. I., Green, R. F., Fricke, K. J., Thuan, T. X., & Noeske, K. G. 2003, A&A, 407, 91
- Guseva et al. (2003) Guseva, N. G., Papaderos, P., Izotov, Y. I., Green, R. F., Fricke, K. J., Thuan, T. X., & Noeske, K. G. 2003, A&A, 407, 105
- Heisler & Vader (1994) Heisler, C. A., & Vader, J. P. 1994, AJ, 107, 35
- Heisler & Vader (1995) Heisler, C. A., & Vader, J. P. 1995, AJ, 110, 87
- Higdon et al. (2004) Higdon, S. J. U., et al. 2004, PASP, 116, 975
- Ho et al. (1997) Ho, L. C., Filippenko, A. V., & Sargent, W. L. W. 1997, ApJS, 112, 315
- Ho et al. (1995) Ho, L. C., Filippenko, A. V., & Sargent, W. L. 1995, ApJS, 98, 477
- Hogg et al. (2005) Hogg, D. W., Tremonti, C. A., Blanton, M. R., Finkbeiner, D. P., Padmanabhan, & N., Quintero, A. D., Schlegel, D. J., & Wherry, N. 2005, ApJ, 624, 162
- Houck et al. (2004a) Houck, J. R, et al. 2004, ApJS, 154, 18
- Houck et al. (2004b) Houck, J. R., et al. 2004, ApJ, 154, 211
- Hunt et al. (2005) Hunt, L., Bianchi, S., & Maiolino, R. 2005, A&A, 434, 849
- Hunter et al. (1989) Hunter, D. A., Gallagher, J. S., Rice, W. L., & Gillett, F. C. 1989, ApJ, 336, 152
- Hunter et al. (1994) Hunter, D. A., O’Connell, R. W., & Gallagher, J. S. 1994, AJ, 108, 84
- Israel (1988) Israel, F. P. 1988, A&A, 198, 109
- Izotov et al. (1997a) Izotov, Y. I., Foltz, C. B., Green, R. F., Guseva, N. G., & Thuan, T. X. 1997, ApJ, 487, L37
- Izotov et al. (1997b) Izotov, Y. I., Lipovetsky, V. A., Chaffee, F. H., Foltz, C. B., Guseva, N. G., & Kniazev, A. Y. 1997, ApJ, 476, 698
- Izotov & Thuan (1999) Izotov, Y. I., & Thuan, T. X. 1999, ApJ, 511, 639
- Izotov et al. (2004) Izotov, Y. I., & Thuan, T. X. 2004, ApJ, 616, 768
- Izotov et al. (2005) Izotov, I. I., Thuan, T. X, & Gauseva, N. G. 2005, Aj accepted
- Jarrett et al. (2003) Jarrett, T. H., Chester, T., Cutri, R., Schneider, S. E., & Huchra, J. P. 2003, AJ, 125, 525
- Kinman & Davidson (1981) Kinman, T. D., & Davidson, K. 1981, ApJ, 243, 127
- Kinney et al. (1993) Kinney, A. L., Bohlin, R. C., Calzetti, D., Panagia, N., & Wyse, R. F. G. 1993, ApJS, 86, 5
- Kirshner et al. (1981) Kirshner, R. P., Oemler, A., Schechter, P. L. & Shectman, S. A., 1981, ApJ, 248, l57
- Kniazev et al. (2004) Kniazev, A. Y., Pustilnik, S. A., Grebel, E. K., Lee, H., & Pramskij, A. G. 2004, ApJS, 153, 429
- Kniazev et al. (2000) Kniazev, A. Y., et al. 2000, A&A, 357, 101
- Kniazev et al. (1998) Kniazev, A. Y., Arkhyz, N., Engels, D., Pustilnik, S. A., Ugryumov, A. V., & Masegosa, J. 1998, IAU Circ., 6900, 1
- Kobulnicky & Skillman (1997) Kobulnicky, H. A., & Skillman, E. D. 1997, ApJ, 489, 636
- Kunth & Östlin (2000) Kunth, D. & Östlin, G. 2000, A&A Rev., 10, 1
- Lamb et al. (1986) Lamb, S. A., Hjellming, M. S., Gallagher, J. S., & Hunter, D. A. 1986, Star Formation in Galaxies, ed. J. C. Lonsdale persson(NASA CP-2466), 259
- Lauberts & Valentijn (1989) Lauberts, A., & Valentijn, E. A. 1989, Garching: European Southern Observatory, —c1989
- Legrand et al. (1997) Legrand, F., Kunth, D., Roy, J.-R., Mas-Hesse, J. M., & Walsh, J. R. 1997, A&A, 326, L17
- Madden et al. (2000) Madden, S. C. 2000, New Astronomy Review, 44, 249
- Madden et al. (2005) Madden, S. C. Galliano, F., Jones, A. P., Sauvage, M. 2000, A&A, (accepted astro-ph/0510086)
- Mas-Hesse & Kunth (1999) Mas-Hesse, J. M., & Kunth, D. 1999, A&A, 349, 765
- Masegosa et al. (1994) Masegosa, J., Moles, M. & Campos-Aguilar, A. 1994, apj, 420, 576
- Meier et al. (2001) Meier, D. S., Turner, J. L., Crosthwaite, L. P., & Beck, S. C. 2001, AJ, 121, 740
- Papaderos et al. (1998) Papaderos, P., Izotov, Y. I., Fricke, K. J., Thuan, T. X., & Guseva, N. G. 1998, A&A, 338, 43
- Peimbert & Torres-Peimbert (1992) Peimbert, M., & Torres-Peimbert, S. 1992, A&A, 253, 349
- Petrosian et al. (2002) Petrosian, A. R., Movsessian, T., Comte, G., Kunth, D., & Dodonov, S. 2002, A&A, 391, 487
- Plante & Sauvage (2002) Plante, S. & Sauvage, M. 2002, AJ, 173,25
- Popescu & Hopp (2000) Popescu, C. C., & Hopp, U. 2000, A&AS, 142, 247
- Roche et al. (1991) Roche, P. F., Aitken, D. K., Smith, C. H., & Ward, M. J. 1991, MNRAS, 248, 606
- Sanders & Mirabel (1996) Sanders, D. B, & Mirabel, I. F. 1996, ARA&A, 34,749
- Sanduleak & Pesch (1987) Sanduleak, N., & Pesch, P. 1987, ApJS, 63, 809
- Sargent & Searle (1970) Sargent, W. L. W., & Searle, L. 1970, ApJ, 162, L155
- Schaerer et al. (1999) Schaerer, D., Contini, T., & Pindao, M. 1999, A&AS, 136, 35
- Searle & Sargent (1972) Searle, L. & Sargent, W. L. W. 1972, ApJ, 173, 25
- Skillman & Kennicutt (1993) Skillman, E. D. & Kennicutt, R. C. 1993, ApJ, 411,655
- Spinoglio et al. (1995) Spinoglio, L., Malkan, M. A., Rush, B., Carrasco, L., & Recillas-Cruz, E. 1995, ApJ, 453, 616
- Stasinska & Leitherer (1996) Stasinska, G., & Leitherer, C. 1996, ApJS, 107, 661
- Takeuchi et al. (2005) Takeuchi, T. T., Buat, V., Iglesias-Páramo, J., Boselli, A., & Burgarella, D. 2005, A&A, 432, 423
- Thornley et al. (2000) Thornley, M. D., Schreiber, N. M. F., Lutz, D., Genzel, R., Spoon, H. W. W., Kunze, D., & Sternberg, A. 2000, ApJ, 539, 641
- Thuan et al. (1999) Thuan, T. X., Sauvage, M., & Madden, S. 1999, ApJ, 516, 783
- Thuan et al. (1997) Thuan, T. X., Izotov, Y. I., & Lipovetsky, V. A. 1997, ApJ, 477, 661
- Thuan (1983) Thuan, T. X. 1983, ApJ, 268, 667
- Tully et al. (1981) Tully, R. B., Boesgaard, A. M., Dyck, H. M., & Schempp, W. V. 1981, ApJ, 246, 38
- Vader et al. (1993) Vader,J. P., Frogel, J. .A. Terndrup, D. A., & Heisler, C. A. 1993, AJ, 106, 1743
- Vennik et al. (2000) Vennik, J., Hopp, U., & Popescu, C. C. 2000, A&AS, 142, 399
- Vitores et al. (1996) Vitores, A. G., Zamorano, J., Rego, M., Alonso, O., & Gallego, J. 1996, A&AS, 118, 7
- Waller (1991) Waller, W. H. 1991, ApJ, 370, 144
- Werner et al. (2004) Werner, M., et al. 2004, ApJS, 154,1
- Wu et al. in prep (2006) Wu, Yanling, et al. 2006, ApJ, in preparation
- Young & Currie (1998) Young, C. K., & Currie, M. J. 1998, A&AS, 127, 367
- Zwicky (1966) Zwicky, F. 1966, ApJ, 143, 192


| Object Name | RA | Dec | AORKEY | Observation Date | Redshift | On-source Time (sec) | |||||
|---|---|---|---|---|---|---|---|---|---|---|---|
| (J2000) | (J2000) | SL | LL | SH | LH | BPU | RPU | ||||
| Haro11 | 00h36m52.5s | -33d33m19s | 9007104 | 2004-07-17 | 0.0206 | 168 | 240 | 480 | 240 | 98 | |
| UM283 | 00h51m49.4s | +00d33m53s | 8997888 | 2004-07-13 | 0.0155 | 28 | 56 | ||||
| UM133 | 01h44m41.3s | +04d53m26s | 8987392 | 2004-07-16 | 0.0054 | 28 | 56 | ||||
| UM382 | 01h58m09.3s | -00d06m38s | 9004032 | 2005-01-11 | 0.0118 | 240 | 120 | ||||
| 12628224 | 2005-01-14 | 28 | 56 | ||||||||
| 9003776 | 2004-07-16 | 28 | 56 | ||||||||
| 8993792 | 2005-01-11 | 56 | 120 | ||||||||
| UM408 | 02h11m23.4s | +02d20m30s | 8997120 | 2004-08-07 | 0.0120 | 28 | 56 | ||||
| NGC1140 | 02h54m33.6s | -10d01m40s | 4830976 | 2004-01-07 | 0.0050 | 168 | 240 | 480 | 240 | 98 | |
| SBS0335-052E | 03h37m44.0s | -05d02m40s | 11769856 | 2004-09-01 | 0.0135 | 1440 | 960 | 50 | |||
| 8986880 | 2004-02-06 | 840 | 420 | 50 | |||||||
| NGC1569 | 04h30m47.0s | +64d50m59s | 9001984 | 2004-03-01 | 0 | 112 | 120 | 480 | 240 | 50 | |
| IIZw40 | 05h55m42.6s | +03d23m32s | 9007616 | 2004-03-01 | 0.0026 | 168 | 240 | 480 | 240 | 98 | |
| Tol0618-402 | 06h20m02.5s | -40d18m09s | 4845824 | 2003-12-15 | 0.0350 | 28 | 56 | ||||
| SBS0743+591B | 07h47m46.7s | +59d00m30s | 12625920 | 2005-03-18 | 0.0211 | 28 | 56 | ||||
| 12622080 | 2005-03-20 | 28 | 56 | ||||||||
| SBS0754+570 | 07h58m26.4s | +56d54m22s | 12630272 | 2005-03-20 | 0.0116 | 28 | 56 | ||||
| UGC4274 | 08h13m13.0s | +45d59m39s | 12076032 | 2004-10-23 | 0.0015 | 112 | 240 | 120 | 56 | 50 | |
| 12626688 | 2004-11-11 | 112 | 240 | 120 | 56 | 50 | |||||
| SBS0813+582A | 08h18m04.5s | +58d05m56s | 12629248 | 2005-03-18 | 0.0268 | 28 | 56 | ||||
| HS0822+3542 | 08h25m55.5s | +35d32m32s | 12630016 | 2004-11-11 | 0.0024 | 28 | 56 | ||||
| IZw18 | 09h34m02.0s | +55d14m28s | 9008640 | 2004-03-27 | 0.0025 | 168 | 240 | 480 | 240 | 98 | |
| 12622848 | 2005-04-23 | 960 | 480 | 98 | |||||||
| SBS0935+495 | 09h38m24.0s | +49d18m17s | 12624640 | 2004-11-13 | 0.0314 | 28 | 56 | ||||
| SBS0940+544 | 09h44m16.7s | +54d11m33s | 9010432 | 2004-03-26 | 0.0055 | 28 | 56 | ||||
| SBS0943+563 | 09h47m13.0s | +56d06m07s | 12627200 | 2004-11-13 | 0.0253 | 28 | 56 | ||||
| SBS1001+555 | 10h04m41.8s | +55d18m43s | 12624384 | 2005-04-15 | 0.0037 | 28 | 56 | ||||
| KUG1013+381 | 10h16m24.5s | +37d54m46s | 4846336 | 2003-12-15 | 0.0040 | 28 | 56 | ||||
| 8999168 | 2004-04-16 | 120 | 120 | ||||||||
| 9012224 | 2004-04-16 | 56 | 240 | ||||||||
| 12628992 | 2005-04-22 | 960 | 50 | ||||||||
| SBS1116+597 | 11h18m47.4s | +59d26m02s | 12622592 | 2004-11-17 | 28 | 56 | |||||
| [RC2]A1116+51 | 11h19m34.3s | +51d30m12s | 4846592 | 2003-12-15 | 0.0044 | 28 | 56 | ||||
| SBS1119+586 | 11h22m37.8s | +58d19m43s | 12631040 | 2005-04-15 | 0.0053 | 28 | 56 | ||||
| VIIZw403 | 11h27m59.9s | +78d59m39s | 9005824 | 2004-12-09 | 0 | 168 | 240 | 480 | 240 | 50 | |
| SBS1129+576 | 11h32m02.5s | +57d22m46s | 12632320 | 2005-01-06 | 0.0052 | 28 | 56 | ||||
| SBS1135+598 | 11h37m43.7s | +59d35m34s | 12624896 | 2004-11-17 | 0.0327 | 28 | 56 | ||||
| Mrk1450 | 11h38m35.6s | +57d52m27s | 9011712 | 2004-12-12 | 0.0032 | 168 | 240 | 480 | 240 | 50 | |
| SBS1136+607 | 11h39m11.5s | +60d30m45s | 12622336 | 2004-11-14 | 0.0116 | 28 | 56 | ||||
| SBS1137+589 | 11h40m32.0s | +58d38m32s | 12630528 | 2004-11-17 | 0.0068 | 28 | 56 | ||||
| SBS1141+576 | 11h44m16.6s | +57d24m32s | 12627456 | 2005-04-15 | 0.0310 | 28 | 56 | ||||
| UM461 | 11h51m33.3s | -02d22m22s | 9006336 | 2005-01-03 | 0.0035 | 168 | 240 | 480 | 240 | 50 | |
| SBS1149+596 | 11h52m34.0s | +59d22m56s | 12623360 | 2004-11-17 | 0.0112 | 28 | 56 | ||||
| SBS1150+599 | 11h53m28.9s | +59d39m57s | 12621824 | 2004-11-17 | 0.0371 | 28 | 56 | ||||
| SBS1159+545 | 12h02m02.4s | +54d15m50s | 4847104 | 2003-12-15 | 0.0118 | 28 | 56 | ||||
| 9010176 | 2004-04-17 | 120 | 120 | ||||||||
| 9008896 | 2004-04-17 | 56 | 240 | ||||||||
| 12629504 | 2005-04-23 | 960 | 50 | ||||||||
| SBS1200+589B | 12h03m22.6s | +58d41m36s | 4824064 | 2004-01-06 | 0.0321 | 240 | 98 | ||||
| SBS1210+537A | 12h12m55.9s | +53d27m38s | 8989952 | 2004-06-06 | 168 | 240 | 480 | 240 | |||
| SBS1211+564 | 12h13m35.9s | +56d08m35s | 12623104 | 2005-04-21 | 0.0107 | 28 | 56 | ||||
| SBS1212+563 | 12h14m48.5s | +56d05m19s | 12633088 | 2005-04-21 | 28 | 56 | |||||
| Tol1214-277 | 12h17m17.1s | -28d02m33s | 9008128 | 2004-06-28 | 0.0260 | 168 | 240 | 480 | 240 | 98 | |
| SBS1219+559 | 12h21m29.0s | +55d38m23s | 12631296 | 2005-04-21 | 0.0308 | 28 | 56 | ||||
| SBS1221+545B | 12h24m23.0s | +54d14m48s | 12625152 | 2005-04-21 | 0.0187 | 28 | 56 | ||||
| HS1222+3741 | 12h24m36.7s | +37d24m36s | 12630784 | 2005-01-03 | 0.0409 | 28 | 56 | ||||
| Tol65 | 12h25m46.9s | -36d14m01s | 4829696 | 2004-01-07 | 0.0090 | 168 | 240 | 480 | 240 | 98 | |
| SBS1227+563 | 12h30m07.3s | +56d05m13s | 12632832 | 2005-04-21 | 0.0153 | 28 | 56 | ||||
| [RC2]A1228+12 | 12h30m48.5s | +12d02m42s | 8998656 | 2004-06-27 | 0.0042 | 28 | 56 | ||||
| SBS1235+559 | 12h37m36.9s | +55d41m04s | 12628480 | 2005-04-21 | 0.0293 | 28 | 56 | ||||
| UGCA292 | 12h38m40.0s | +32d46m01s | 4831232 | 2004-01-07 | 0.0010 | 168 | 240 | 480 | 240 | 98 | |
| 12076288 | 2005-01-03 | 28 | 56 | ||||||||
| Tol1304-353 | 13h07m37.5s | -35d38m19s | 9006848 | 2004-06-25 | 0.0140 | 168 | 240 | 480 | 240 | 50 | |
| 12075520 | 2005-02-10 | 28 | 56 | ||||||||
| HS1319+3224 | 13h21m19.9s | +32d08m23s | 12625664 | 2005-02-07 | 0.0182 | 28 | 56 | ||||
| Pox186 | 13h25m48.6s | -11d37m38s | 9007360 | 2004-07-14 | 0.0039 | 168 | 240 | 480 | 240 | 50 | |
| 12625408 | 2005-02-15 | 28 | 56 | ||||||||
| SBS1415+437 | 14h17m01.4s | +43d30m05s | 4844288 | 2004-01-07 | 0.0020 | 28 | 56 | ||||
| 8990464 | 2004-05-15 | 120 | 120 | ||||||||
| 9008384 | 2004-05-13 | 56 | 240 | ||||||||
| HS1424+3836 | 14h26m28.1s | +38d22m59s | 12628736 | 2005-02-13 | 0.0226 | 28 | 56 | ||||
| Mrk475 | 14h39m05.4s | +36d48m22s | 8995840 | 2004-02-07 | 0.0019 | 28 | 56 | ||||
| 8996864 | 2004-06-05 | 120 | 120 | ||||||||
| 8988672 | 2004-06-26 | 56 | 240 | ||||||||
| CG0598 | 14h59m20.6s | +42d16m10s | 8992256 | 2005-03-19 | 0.0575 | 168 | 240 | 480 | 240 | 50 | |
| CG0752 | 15h31m21.3s | +47d01m24s | 8991744 | 2005-03-19 | 0.0211 | 168 | 240 | 480 | 240 | 50 | |
| SBS1533+574B | 15h34m14.1s | +57d17m04s | 12627968 | 2005-01-09 | 0.0110 | 28 | 56 | ||||
| SBS1538+584 | 15h39m56.9s | +58d15m33s | 12623616 | 2005-01-08 | 0.0435 | 28 | 56 | ||||
| SBS1541+590 | 15h42m55.8s | +58d55m09s | 12631552 | 2004-12-12 | 0.0450 | 28 | 56 | ||||
| Mrk1499 | 16h35m21.1s | +52d12m53s | 9011456 | 2004-06-05 | 0.0090 | 168 | 240 | 480 | 240 | 98 | |
| [RC2]A2228-00 | 22h30m33.9s | -00d07m35s | 9006080 | 2004-06-24 | 0.0052 | 168 | 240 | 480 | 240 | 50 | |
| Object Name | B | K | / | Z/Z⊙ | References | |||||
|---|---|---|---|---|---|---|---|---|---|---|
| (mJy) | (mJy) | (mJy) | (mJy) | (mag) | (mag) | B/K | Z | |||
| Haro11 | 190.0 | 851.2aaThe coordinates and redshifts of the objects are cited from The NASA/IPAC Extragalactic Database (NED)(NED is operated by the Jet Propulsion Laboratory, California Institute of Technology, under contract with the National Aeronautics and Space Administration). | 1900 | 14.31 | 12.0 | 0.1 | 1) , 2) | 19) | ||
| UM283 | 3.0 | 8.2 | 17.38 | 2.7 | 0.048 | 9) | 24) | |||
| UM133 | 2.0 | 6.6 | 15.41 | 3.4 | 0.052 | 3) | 25) | |||
| UM382 | 0.7 | 1.5 | 18.20 | 2.2 | 0.035 | 3) | 25) | |||
| UM408 | 1.3 | 3.5 | 17.46 | 2.7 | 0.052 | 3) | 25) | |||
| NGC1140 | 294.4 | 12.56 | 10.51 | 0.4 | 4) , 5) | 14) | ||||
| SBS0335-052E | 11.2 | 78.0 | 66 | 17.07 | 0.024 | 10 | 17) | |||
| NGC1569 | 2067.5aaThe 22m peak-up is saturated. | 9.42 | 7.86 | 0.19 | 4) , 6) | 16) | ||||
| IIZw40 | 105.0 | 796.1aaThe 22m peak-up is saturated. | 1500 | 11.87 | 12.35 | 0.17 | 3) , 5) | 15) | ||
| SBS0743+591B | 2.3 | 4.7 | 2.1 | |||||||
| SBS0754+570 | 0.8 | 2.4 | 2.9 | |||||||
| UGC4274 | 130.2 | 12.07 | 9.13 | 0.41 | 4) , 6) | 18)ggThe oxygen abundance is calculated from [NII]/H measurement using the method proposed by Denicoló et al. (2002) | ||||
| HS0822+3542 | 0.2 | 1.3 | 4.1 | 2.7 | 17.92 | 3.1 | 0.028 | 26) | 26) | |
| IZw18 | 0.7 | 4.1 | 5.5 | 16.05 | 15.92 | 0.018 | 3) , 11) | 27) | ||
| SBS0935+495 | 1.2 | 2.9 | 2.3 | |||||||
| SBS0940+544 | 1.1 | 2.3 | 17.18 | 2.1 | 0.033 | 3) | 21) | |||
| SBS0943+563 | 1.4 | 3.8 | 2.8 | |||||||
| KUG1013+381 | 6.4 | 17.1 | 16.04 | 2.7 | 0.047 | 28) | 28) | |||
| SBS1116+597 | 1.0 | 1.1 | 13.28 | 1.2 | 5) | |||||
| [RC2]A1116+51 | 0.5 | 1.7 | 17.46 | 3.6 | 0.049 | 12) | 29) | |||
| SBS1119+586 | 0.6 | 1.5 | 2.6 | |||||||
| VIIZw403 | 2.5 | 7.7 | 28 | 14.11 | 12.7 | 0.060 | 3) , 7) | 21) | ||
| SBS1129+576 | 0.3 | 1.4 | 4.0 | 0.032 | 30) | |||||
| SBS1135+598 | 0.2 | 0.8 | 3.7 | |||||||
| Mrk1450 | 2.4 | 52.1 | 48 | 15.75 | 0.117 | 3) | 21) | |||
| SBS1136+607 | 0.5 | 1.8 | 3.8 | |||||||
| SBS1137+589 | 0.5 | 1.0 | 2.2 | |||||||
| SBS1141+576 | 1.1 | 2.9 | 2.5 | |||||||
| UM461 | 1.6 | 29.2 | 30 | 0.087 | 22) | |||||
| SBS1149+596 | 1.5 | 4.4bbThe error in this value is higher 10% in the blue and 15% in the red due to the presence of a bright star. | 3.1 | |||||||
| SBS1150+599 | 0.3 | 0.6 | 12.67 | 1.8 | 5) | |||||
| SBS1159+545 | 2.6 | 6.4 | 2.5 | 0.038 | 21) | |||||
| SBS1212+563 | 1.0 | 1.2 | 1.2 | |||||||
| Tol1214-277 | 0.2 | 3.5 | 5.5 | 0.045 | 24) | |||||
| SBS1219+559 | 1.0 | 2.1 | 2.1 | |||||||
| SBS1221+545 | 0.6 | 1.9 | 3.0 | |||||||
| HS1222+3741 | 3.0 | 6.9 | 18.40 | 2.3 | 0.054 | 13) | 32) | |||
| Tol65 | 0.9 | 15.7 | 15 | 17.26 | 0.031 | 3) | 24) | |||
| SBS1227+563 | 1.0 | 1.7 | 1.7 | |||||||
| [RC2]A1228+12 | 1.2 | 3.4 | 17.96 | 2.9 | 0.054 | 8) | 29) | |||
| SBS1235+559 | 0.3 | 1.0 | 2.9 | |||||||
| Tol1304-353 | 6.0 | 10.8 | 1.8 | 0.058 | 33) | |||||
| HS1319+3224- | 1.3 | 2.1 | 19.0 | 1.6 | 0.048 | 13) | 32) | |||
| Pox186 | 5.8 | 13.1 | 17.0 | 2.3 | 0.066 | 14) | 31) | |||
| SBS1415+437 | 6.0 | 19.6 | 15.43 | 3.2 | 0.048 | 3) | 21) | |||
| HS1424+3836- | 0.5 | 1.5 | 18.68 | 2.8 | 0.115 | 13) | 32) | |||
| Mrk475 | 3.2 | 10.8 | 16.20 | 3.3 | 0.105 | 3) | 21) | |||
| CG0598 | 23.0 | 13.17 | 0.65 | 5) | 23) | |||||
| CG0752 | 138.9 | 11.73 | 5) | |||||||
| SBS1533+574B | 21.2 | 53.4 | 16.02 | 2.5 | 0.158 | 3) | 21) | |||
| SBS1538+584 | 1.4 | 3.9 | 2.8 | |||||||
| SBS1541+590 | 1.3 | 3.3 | 2.5 | |||||||
| Mrk1499 | 29.5 | 16.00 | 0.3 | 4) | 20) ggThe oxygen abundance is calculated from [NII]/H measurement using the method proposed by Denicoló et al. (2002) | |||||
| Object Name | IRAC 8 m | IRS 16 m (BPU) | IRS 22 m (RPU) | MIPS 24 m |
|---|---|---|---|---|
| (mJy) | (mJy) | (mJy) | (mJy) | |
| IZw18 | 2.6 | 5.9 | 6.5 | |
| SBS0335-052 | 12.3 | 58.1 | 79.8 | 81.5 |
| UM461 | 1.8 | 16.9 | 34.5 | 37.7 |
| Haro11 | 164.2 | 932.6 | 2307.0 | 2640.4 |
| Mrk1450 | 2.4 | 22.0 | 53.5 | 59.7 |
| IIZw40 | 90.1 | 763.7 | 1481.9 | 1624.0 |
| NGC1569 | 72.2 | 921.8 | 2596.0 | 2991.0 |
| Mrk1499 | 4.2 | 12.4 | 30.4 | 33.8 |
| NGC1140 | 28.7 | 103.5 | 279.5 | 316.6 |
| UGC4274 | 17.0 | 53.1 | 120.5 | 132.5 |
| CG0598 | 7.2 | 11.2 | 24.8 | 28.3 |
| CG0752 | 32.9 | 63.6 | 148.6 | 169.9 |
| Object Name | PAH EW (m) | FluxaaThe integrated fluxes are measured from the high resolution spectra of the targets. Background emission hasn’t been subtracted and no scaling between the two modules, SH and LH has been applied. (W m-2) | ||||||
|---|---|---|---|---|---|---|---|---|
| 6.2 m | 7.7 m | 8.6 m | 11.2 m | [SIV](10.51 m) | [NeII](12.81 m) | [NeIII](15.55 m) | [SIII](18.71 m) | |
| IZw18 | 0.06 | 0.011 | 0.05 | 0.021 | ||||
| SBS0335-052 | 0.018 | 0.018 | 0.16 | 0.016 | 0.135 | 0.045 | ||
| UM461 | 0.199 | 0.47 | 0.021 | 0.29 | 0.09 | |||
| Haro11 | 0.126 | 0.241 | 0.055 | 0.087 | 4.6 | 3.2 | 10.1 | 4.81 |
| Mrk1450 | 0.158 | 0.75 | 0.13 | 0.96 | 0.46 | |||
| IIZw40 | 0.025 | 0.069 | 0.009 | 0.013 | 18.6 | 0.60 | 11.4 | 4.7 |
| NGC1569 | 0.220 | 0.402 | 0.045 | 0.100 | 14.8 | 1.55 | 17.4 | 7.2 |
| Mrk1499 | 0.831 | 0.997 | 0.345 | 0.788 | 0.18 | 0.19 | 0.50 | 0.30 |
| NGC1140 | 0.532 | 0.579 | 0.142 | 0.558 | 1.30 | 1.17 | 3.8 | 2.17 |
| UGC4274 | 0.732 | 0.671 | 0.191 | 0.563 | 0.46 | 0.88 | 1.31 | 1.30 |
| CG0598 | 0.746 | 0.954 | 0.331 | 0.807 | 0.13 | 0.206 | 0.18 | 0.23 |
| CG0752 | 0.522 | 0.645 | 0.171 | 0.625 | 0.15 | 1.23 | 0.58 | 0.82 |
| Object | aaThe 22 m flux density are calculated using the “synthetic” method. | Radiusbb indicates no available PAH EW measurement. It is mostly due to the low SNR of the spectrum. In this case, the determination of the continuum is highly uncertain and will significantly change the PAH EW. A much deeper observation with more exposure time has been submitted and more analysis will follow when data come in. For SBS0335-052, the SNR is high enough, but no PAH features can be identified in its mid-IR spectrum. We do not have a template to derive the upper limit of PAH EW at 7.7 m and 8.6 m. | cc indicates that no data are available. | Volume | /Volume |
|---|---|---|---|---|---|
| (Jy) | (arcsec) | () | () | (L) | |
| IZw18 | 0.006 | 7.2 | 0.01 | 0.2 | 0.007 |
| SBS0335-052 | 0.080 | 3.8 | 3.8 | 3.9 | 0.099 |
| UM461 | 0.030 | 6.8 | 0.1 | 0.4 | 0.030 |
| Haro11 | 2.307 | 9.9 | 249.7 | 241.4 | 0.103 |
| Mrk1450 | 0.053 | 5.9 | 0.1 | 0.2 | 0.076 |
| IIZw40 | 1.482 | 9.5 | 2.1 | 0.3 | 0.700 |
| NGC1569 | 2.596 | 55.4 | 0.2 | 0.1 | 0.124 |
| Mrk1499 | 0.030 | 6.1 | 0.6 | 4.6 | 0.014 |
| NGC1140 | 0.279 | 28.0 | 1.8 | 5.8 | 0.031 |
| UGC4274 | 0.120 | 30.5 | 0.1 | 0.1 | 0.057 |
| CG0598 | 0.025 | 5.9 | 20.8 | 1185.6 | 0.002 |
| CG0752 | 0.149 | 9.9 | 16.9 | 258.3 | 0.007 |