The DEEP2 Galaxy Redshift Survey: Discovery of Luminous, Metal-poor, Star-forming Galaxies at Redshifts 11affiliation: Based on observations obtained with the KECK2 Telescope at the W. M. Keck Observatory, which is operated as a scientific partnership among the California Institute of Technology, the University of California, and the National Aeronautics and Space Administration. The Observatory was made possible by the generous financial support of the W.. M. Keck Foundation. This work also uses data obtained with the NASA/ESA Hubble Space Telescope through the Space Telescope Science Institute, which is operated by the Association of Universities for Research in Astronomy (AURA), Inc., under NASA contract NAS 5-26555.
Abstract
We have discovered a sample of 17 metal-poor, yet luminous, star-forming galaxies at redshifts . They were selected from the initial phase of the DEEP2 survey of 3900 galaxies and the Team Keck Redshift Survey (TKRS) of 1536 galaxies as those showing the temperature-sensitive [O III] auroral line. These rare galaxies have blue luminosities close to , high star formation rates of 5 to 12 yr-1, and oxygen abundances of 1/3 to 1/10 solar. They thus lie significantly off the luminosity-metallicity relation found previously for field galaxies with strong emission lines at redshifts . The prior surveys relied on indirect, empirical calibrations of the diagnostic and the assumption that luminous galaxies are not metal-poor. Our discovery suggests that this assumption is sometimes invalid. As a class, these newly-discovered galaxies are: (1) more metal-poor than common classes of bright emission-line galaxies at or at the present epoch; (2) comparable in metallicity to Lyman Break Galaxies but less luminous; and (3) comparable in metallicity to local metal-poor eXtreme Blue Compact Galaxies (XBCGs), but more luminous. Together, the three samples suggest that the most-luminous, metal-poor, compact galaxies become fainter over time.
Subject headings:
galaxies:abundances — galaxies:evolution — galaxies:high-redshiftTo appear in Astrophysical Journal Letters.
1. Introduction.
The metal content of galaxies is an important diagnostic because it relates directly to the integral history of star formation, galaxy mass, and the inward and outward flows of gas (see reviews by Kunth & Östlin, 2000; Pagel, 1997, or, for a review on chemical evolution models, see Cen & Ostriker, 1999). Local studies reveal the existence of a luminosity-metallicity relation (LZR) (Lequeux et al., 1979; Skillman, Kennicutt, & Hodge, 1989; Kinman & Davidson, 1981; Richer & McCall, 1995; Campos-Aguilar et al., 1993) that presumably arises from the higher retention rate of enriched gas in the gravitational wells of galaxies with larger masses, where the assumption is that more luminous galaxies are also more massive. The luminosity-metallicity relation (LZR) is expected to evolve over the lifetime of galaxies, but any predicted changes in the slope, offset, and dispersion of the LZR are subject to many uncertainties. Observations of the metallicity of galaxies at intermediate redshifts have been few and include three studies of field galaxies at 0.5 to 1 by Kobulnicky et al. (2003, henceforth K03), Lilly, Carollo, & Stockton (2003, henceforth L03), and Kobulnicky & Kewley (2004, henceforth KK04) and a few targets at very high redshifts by, e.g., Pettini et al. (2001) and Kobulnicky & Koo (2000, henceforth KK00). The intermediate-redshift studies suggest that, at a given metallicity, galaxies were typically more luminous in the past, while the high-redshift samples show metallicities that are sub-solar with luminosities 5–40 times brighter than local galaxies of comparable metallicity.
The distant galaxy metallicities in these studies were all based on the [O/H]111We will henceforth refer to 12+log(O/H) as “[O/H]”. of the emission lines and estimated from the empirical method introduced by Pagel et al. (1979), and further developed by McGaugh (1991) and Pilyugin (2000), among others. No galaxies had less than 1/3 solar abundances, but this was in part due to the assumption of using the metal-rich (upper) branch of the -metallicity relation. This letter presents a new sample of distant galaxies selected for the presence of the [O III] 4363 Å auroral line. This line is sensitive to electron-temperatures (Osterbrock, 1989) and can, together with and other oxygen lines, provide reliable gas metallicities without assumptions about the ionization and metallicity. This selection also strongly favors [O/H] abundances less than solar and has enabled us to discover a new distant sample of luminous metal-poor field galaxies. We summarize our observations and measurements in §2; we present our data analysis in §3 and compare our results to the LZR derived from previous studies of field galaxies. The main conclusions of this study are presented in §4.
We adopt the concordance cosmology, i.e., a flat Universe with and . Magnitudes are all on the Vega system.
2. Observations & Measurements
Galaxies were selected by inspection of reduced spectra from two redshift surveys of faint field galaxies, DEEP2 and TKRS, both using the DEIMOS spectrograph (Faber et al., 2003) on the 10-meter Keck II Telescope. DEEP2 (Davis et al., 2002) spectra had a total exposure time of one hour, covered the wavelength range 6400-9000 Å with the 1200 mm-1 grating, and yielded FWHM resolutions of around 60 km s-1. The initial DEEP2 sample consisted of 3900 galaxies, 1200 of which had redshifts that allowed the [O III] and [O III] lines in principle to be observed. This search yielded 14 galaxies, or about 1%, that display the weak auroral line [O III] along with prominent oxygen emission lines.
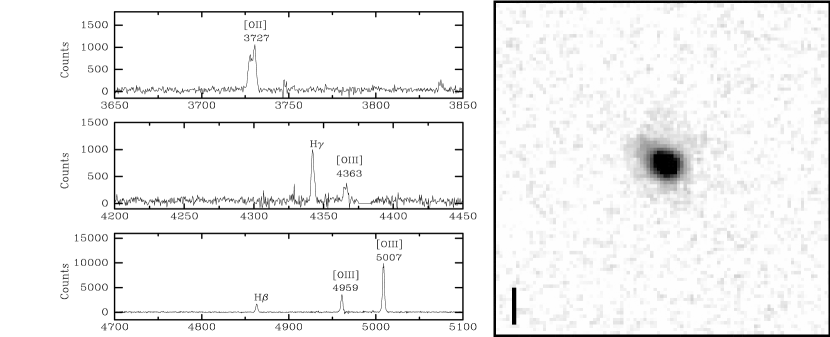
The TKRS (Wirth et al., 2004) is a similar one hour survey targeting the GOODS-North field (Giavalisco et al., 2004). It used the 600 mm-1 grating, and covered a wider range of wavelengths (4600–9800 Å), but had a lower FWHM resolution of 170 km s-1. This survey yielded 1536 galaxies with reliable redshifts. For 1090 galaxies, the redshifts allowed the [O III] and [O III] lines to be observable. Of these, three galaxies, or 0.3%, showed the auroral line and had redshifts above . Fig. 1 shows one example along with its HST image. Table 1 identifies all 17 targets, henceforth called the O-4363 sample and tabulates the measurements described below.
The [O/H] metallicities are derived from emission lines, including the temperature sensitive [O III] line along with [O II], , and [O III]. For the DEEP2 sample, only 4/14 galaxies possessed the full set of lines, while 10 had the [O II] lines outside the observable wavelength range. All oxygen lines were detected for the 3 TKRS galaxies. When [O II] was unobservable, its line strength was estimated using the following fit to local H II galaxies, with errors about 50% larger than from using direct [O II] measurements (A. Díaz, private communication):
| (1) |
The electron temperature in the [O II] zone was then derived according to the method given in Pérez-Montero & Díaz (2003), while the oxygen abundances were all calculated using the formulae given in Pagel et al. (1992). Objects showing [O II] 3727 have abundance uncertainties set to 0.1 dex, while the others have uncertainties of 0.15 dex.
Blue absolute magnitudes () and rest-frame U B colors were calculated from the BRI photometry (Coil et al., 2004) in DEEP2 and the 4-band HST-ACS photometry in the GOODS-N field of the TKRS, with K-corrections following those described by Willmer et al. (2005). Half-light radii, , were estimated from curve-of-growth profiles derived from multi-aperture photometry of the HST ACS image taken with the filter that yielded the closest match to restframe at the target’s redshift. The star formation rates (SFR) were calculated from the luminosity as in Kennicutt, Tamblyn, & Congdon (1994), valid for T and case B recombination. Since the DEIMOS spectra are not flux calibrated, the line luminosity was estimated via and following Terlevich & Melnick (1981), with no extinction or color corrections. The derived luminosities and SFR are thus lower limits.
| ID aaThe first 14 entries are DEEP2 sources. The last 3 entries are TKRS galaxies. | z bbRedshifts marked with asterisks denote galaxies for which all emission lines from [O II]3727 to [O III]5007 could be measured. | RA | DEC | 12+log(O/H) | [O III]/H | EW(H) | MB ccRest-frame Johnson blue absolute magnitude. | U B ddRest-frame Johnson U B color. | SFR | Vel. | eeB-band half-light radii from HST-ACS imaging. |
|---|---|---|---|---|---|---|---|---|---|---|---|
| (J2000) | (J2000) | Rest frame Å | (mag) | (M⊙yr-1) | (km-s-1) | (kpc) | |||||
| D2-1 | 0.851* | 23 29 08.20 | +00 20 40.70 | 8.10.1 | 8.00.8 | 985 | -19.90 | -0.47 | 11.50.6 | 4014 | |
| D2-2 | 0.730* | 02 29 33.65 | +00 26 08.00 | 7.90.1 | 8.10.8 | 905 | -19.24 | -0.47 | 5.80.3 | 256 | |
| D2-3 | 0.749* | 16 53 03.49 | +34 58 48.90 | 7.80.1 | 6.30.6 | 965 | -19.23 | -0.35 | 6.10.3 | 3014 | |
| D2-4 | 0.631 | 23 28 47.84 | 8.00.15 | 6.10.6 | 885 | -19.27 | -0.51 | 5.80.3 | 324 | ||
| D2-5 | 0.636 | 23 28 41.65 | +00 18 20.00 | 8.20.15 | 8.10.8 | 965 | -19.24 | -0.34 | 6.20.3 | 284 | |
| D2-6 | 0.530 | 8.10.15 | 7.80.8 | 16020 | 345 | ||||||
| D2-7 | 0.706 | 16 50 05.43 | +35 06 30.40 | 8.10.15 | 7.40.7 | 705 | -20.10 | -0.35 | 9.80.7 | 414 | |
| D2-8 | 0.659 | 02 31 17.32 | +00 37 28.20 | 8.10.15 | 6.60.7 | 7010 | -19.97 | -0.49 | 9.01.0 | 5010 | |
| D2-9 | 0.750* | 02 30 20.03 | +00 42 49.70 | 8.10.1 | 5.90.6 | 915 | -20.55 | -0.49 | 20.01.0 | 4010 | |
| D2-10 | 0.657 | 02 28 38.46 | +00 28 52.30 | 8.30.15 | 4.90.5 | 6010 | -21.40 | -0.52 | 27.05.0 | 6016 | |
| D2-11 | 0.551 | 02 28 40.39 | +00 36 07.70 | 8.00.15 | 8.10.8 | 819 | -18.48 | -0.45 | 2.60.3 | 2020 | |
| D2-12 | 0.680 | 02 28 45.05 | +00 41 32.80 | 8.20.15 | 9.40.9 | 11015 | -21.00 | -0.28 | 26.03.0 | 322 | |
| D2-13 | 0.702 | 02 30 02.06 | +00 47 34.70 | 8.30.15 | 4.80.5 | 913 | -19.94 | -0.55 | 11.20.4 | 3016 | |
| D2-14 | 0.725 | 02 30 12.32 | +00 36 52.50 | 7.80.15 | 7.10.7 | 595 | -19.53 | -0.29 | 5.00.4 | 375 | |
| TK-1 | 0.855* | 12 36 42.83 | +62 20 01.58 | 8.00.1 | 5.30.5 | 15020 | 576 | 1.0 | |||
| TK-2 | 0.681* | 12 36 33.02 | +62 15 37.52 | 7.80.1 | 8.20.8 | 10015 | -19.35 | -0.38 | 7.01.0 | 484 | 0.7 |
| TK-3 | 0.512* | 12 36 50.22 | +62 17 17.91 | 7.80.1 | 3.20.3 | 163 | -19.30 | -0.28 | 1.10.2 | 218 | 1.6 |
Note. — Redshifts, J2000 coordinates, oxygen abundances, [O III]/H, H rest-frame equivalent widths (EWβ), absolute magnitudes, colors, star formation rates, emission line width () and B-band half-light radii of the studied sample.
3. The Luminosity-Metallicity Relation (LZR)
The key result is seen in the [O/H] vs. relation in Fig. 2, which shows that [O/H] for the 17 galaxies in our O-4363 sample is 1/3 to 1/10 the solar value of [O/H]⊙ = 8.69 (Allende Prieto et al., 2001). While the O-4363 galaxies have luminosities close to ( locally), they are offset to lower metallicities by about 0.6 dex in [O/H] when compared to 180 other field galaxies studied by K03, L03, and KK04. All these studies used empirical calibrations, such as , and adopted the upper, metal-rich branch222The K03 sample had 25 galaxies in the redshift range ; L03 had 55 galaxies between 0.48 and 0.91; and KK04 had 102 between 0.55 and 0.85. .
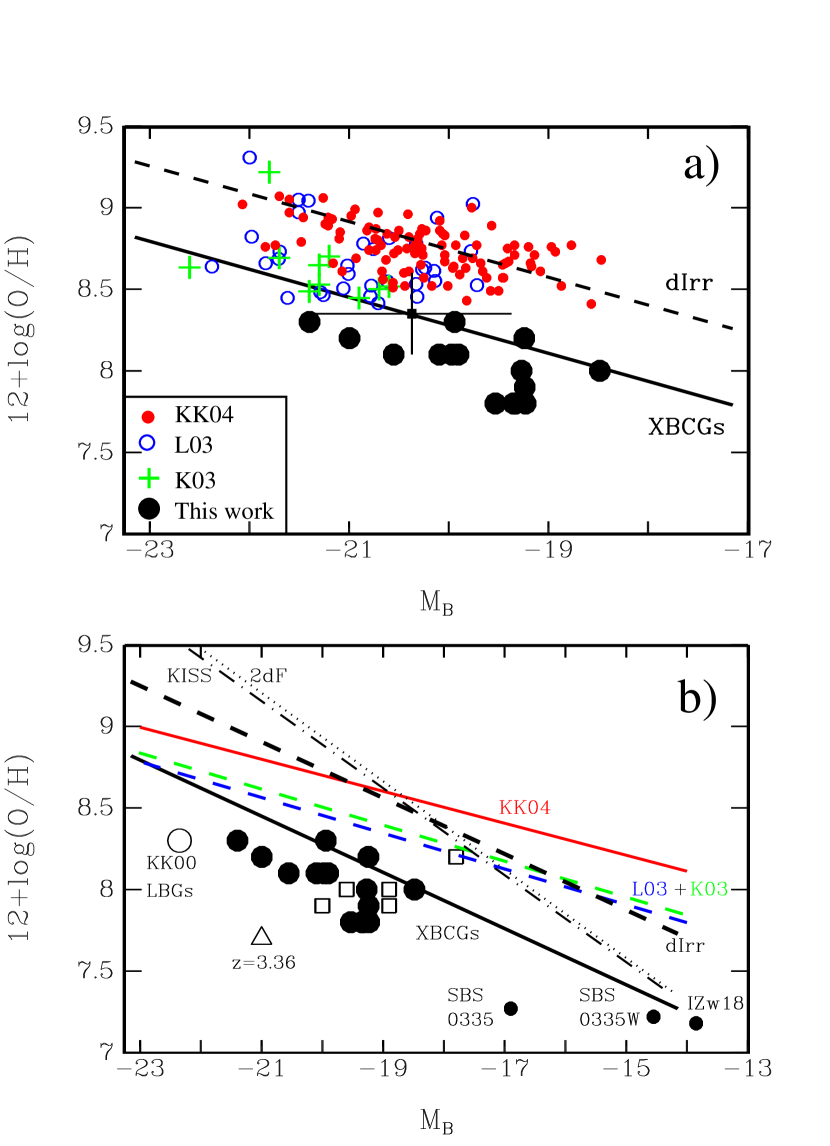
For galaxies at , the oxygen abundances derived here are the first using the direct method based on the temperature-sensitive [O III] line. Our discovery of luminous galaxies with low [O/H] gas metallicities suggests that adopting the metal-rich branch when using, e.g., the method should be made with caution. Such an assumption precludes finding [O/H] below 8.4. If the empirical method and upper branch assumption were to be applied to the O-4363 sample, [O/H] would be greater by about 0.4 0.2 dex, nearly enough to place the O-4363 points atop the mean LZR of the field galaxies (see Fig. 2).
What fraction of the three other moderate-redshift samples are actually metal-poor? One estimate adopts two criteria suggested by the O-4363 sample to identify metal-poor galaxies. The first is based on calculating 333Defined as the value that an ionized H II region would show if the reddening-corrected ionization ratio [O III]/[O II] were equal to one, leaving the oxygen content unchanged. We used the Pilyugin (2000) calibration for the upper branch. In the case of the L03 objects, a uniform extinction of was used. This value was adopted since this is the average extinction found for emission-line galaxies in the Nearby Field Galaxy Survey of similar luminosity (Lilly, Carollo, & Stockton, 2003). For both K03 and KK04 sources, EW’s were used as surrogates for line strengths, but with no extinction corrections for K03 and a uniform extinction of for KK04. In this latter case, we have used the mean value of a very large sample of bright local H II galaxies from Hoyos & Díaz (2005). for all galaxies. The O-4363 galaxies have . This places them near the turnaround region of the –[O/H] relation, where a small range in spans a wide range in metallicity. Our discovery of distant, luminous, metal-poor galaxies in this region implies that the other distant samples may also have such metal-poor galaxies. The second criterion is based on large EWs of . The O-4363 sample yield EW’s greater than 40 Å for all but one object 444TK-3 with TKRS catalogue ID-3653 has an unusually low EW() of about 20 Å. Its ionization ratio [O III]/[O II] is approximately 0.7, and the ratio EW([O II])/EW() is . These values indicate that this object is probably a Seyfert 2 galaxy, according to Rola et al. (1997). For all other objects for which the Rola et al. (1997) diagnostics could be calculated, all tests indicate that they are normal star-forming galaxies.. This additional criterion selects those galaxies in the turnaround region that were most likely to be metal-poor. In the other distant galaxy surveys, we found 13 galaxies (7%) with high EW’s of and , that together suggest low-metallicities. This 7% fraction is a lower limit since some metal-poor galaxies may be outside the turnaround region or may have smaller EW of . In any case, independent tests are critical to assess the true fraction of intermediate redshift galaxies that have abundances below the upper branch, e.g., by observing [N II]/ in the near-infrared at our redshifts as suggested by Kewley & Dopita (2002) and Denicoló et al. (2002).
What is the nature of our O-4363 sample, and do such galaxies exist locally or at higher redshifts? Fig. 2b. shows several relevant LZRs from local to distant samples. One sees that relatively common samples of emission line galaxies, such as those of local dIrr, the galaxies from K03, L03, and KK04 and the local emission line galaxies from 2dF or KISS surveys all have LZRs that are offset to metallicities higher than that of the O-4363 sample555The comparison with the latter samples of local galaxies should not be taken beyond , because the KISS and 2DF abundances at high luminosities are clearly too high (Pettini & Pagel, 2004). It is then only below () that valid comparisons can be made between our O-4363 sample and the KISS or 2DF samples. Fortunately, most of the O-4363 objects are less luminous than this limit.. On the other hand, the O-4363 galaxies are far better matches to local XBCG’s and even to the luminous Lyman Break Galaxies (LBG) at redshifts (KK00), or to a gravitationally-lensed galaxy at redshift , which has a metallicity of 1/10 solar, a blue absolute magnitude of -21.0 and a SFR of 6 yr-1 (Villar-Martín et al., 2004)666This object is rather extreme, being 1.0 dex below L03, K03 and KK04 objects of similar luminosity.. We do not find any correlation between the residuals of the O-4363 sample with respect to the LZR of local Extreme Blue Compact Galaxies (XBCG) (Kunth & Östlin, 2000) with U B color, strength of Hβ, and internal velocity dispersion (see Table 1). Much like the XBCG and LBG, the O-4363 galaxies may belong to the compact class of galaxies. But this suggestion is based presently on the small 1–2 kpc sizes seen in the only three galaxies with HST images. Moreover, the emission-line velocity widths (see Table 1.) are narrow and suggest that the O-4363 galaxies are more likely to be galaxies with small dynamical masses; the very blue colors and high star formation rates suggest a recent, strong burst of star formation. Overall, the trend suggested by Fig. 2b is that the most luminous, metal-poor galaxies are getting fainter with time.
4. Summary.
Based on a search for the [O III] emission line in the TKRS and initial DEEP2 surveys of field galaxies, we have discovered 17 galaxies at redshift that are luminous, very blue, compact, and metal poor, roughly 1/3 to 1/10 solar in [O/H]. Though rare, such metal-poor galaxies highlight the diversity among galaxies with similar luminosities and serve as important laboratories to study galaxy evolution (Kunth & Östlin, 2000). This sample is lower in [O/H] by 0.6 dex on average in the LZR when compared to prior studies at these redshift, which used empirical calibrations, such as . The previous studies, however, assumed the metal-rich branch of the calibration, while our results show that this assumption may not apply, even for luminous galaxies, especially when high values of EW(Hβ) and are found (roughly 7% of the other samples). Based on comparisons to local and high redshift samples, we speculate that our metal-poor, luminous galaxies at provide an important bridge between local Extreme Blue Compact Galaxies (XBCGs) and Lyman Break Galaxies (LBGs) at redshifts . All three samples share the property of being overluminous for their metallicities, when compared to local galaxy samples, and of having very high EWs of , typically above 40 Å and up to 150 Å and, thus, similar to that found for some local H II galaxies (Terlevich et al., 1991; Hoyos & Díaz, 2005). The calculated star formation rates of the O-4363 galaxies are mostly from 5 to 12 yr-1, indicating that the star-forming activity is very strong (c.f., the SFR of 30 Doradus is 0.1 yr-1) and thus lying roughly between that of local metal-poor, blue compact galaxies and distant Lyman Break Galaxies. When DEEP2 is complete, we expect to have a sample nearly 10 larger, many with HST images. The resulting data set should thus provide vastly improved probes of their nature, enable us to understand their relationship to other classes of galaxies at different epochs, and yield constraints on the physical processes involved in chemical and galaxy evolution.
References
- Allende Prieto et al. (2001) Allende Prieto, C., Lambert, D. L., & Asplund, M. 2001, ApJ, 556, L63
- Bergvall & Östlin (2002) Bergvall, N., & Östlin, G. 2002, A&A, 390, 891
- Campos-Aguilar et al. (1993) Campos-Aguilar, A., Moles, M., & Masegosa, J. 1993, AJ, 106, 1784
- Cen & Ostriker (1999) Cen, R., & Ostriker, J. P. 1999, ApJ, 519, L109
- Coil et al. (2004) Coil, A. L., Newman, J. A., Kaiser, N., Davis, M., Ma, C., Kocevski, D. D., & Koo, D. C. 2004, ApJ, 617, 765
- Davis et al. (2002) Davis, M., et al. 2003, Proc. SPIE, 4834, 161
- Denicoló et al. (2002) Denicoló, G., Terlevich, R., & Terlevich, E. 2002, MNRAS, 330, 69
- Faber et al. (2003) Faber, S. M., et al. 2003, Proc. SPIE, 4841, 1657
- Giavalisco et al. (2004) Giavalisco, M., et al. 2004, ApJ, 600, L93
- Hoyos & Díaz (2005) Hoyos, C., & Díaz, A. I. 2005, MNRAS, in press.
- Kennicutt, Tamblyn, & Congdon (1994) Kennicutt R. C., Jr., Tamblyn, P., & Congdon C. E. 1994, ApJ, 435, 22
- Kewley & Dopita (2002) Kewley, L. J., & Dopita, M. A. 2002, ApJS, 142, 35
- Kinman & Davidson (1981) Kinman, T. D., & Davidson, K. 1981, ApJ, 243, 127
- Kobulnicky & Kewley (2004) Kobulnicky, H. A., & Kewley, L. J. 2004, ApJ, 617, 240 (KK04)
- Kobulnicky & Koo (2000) Kobulnicky, H. A., & Koo, D. C. 2000, ApJ, 545, 712 (KK00)
- Kobulnicky et al. (2003) Kobulnicky, H. A., et al. 2003, ApJ, 599, 1006 (K03)
- Kunth & Östlin (2000) Kunth, D., & Östlin, G. 2000, A&A Rev., 10, 1
- Lamareille et al. (2004) Lamareille, F., Mouhcine, M., Contini, T., Lewis, I., & Maddox, S. 2004, MNRAS, 350, 396
- Lequeux et al. (1979) Lequeux, J., Peimbert, M., Rayo, J. F., Serrano, A., & Torres-Peimbert, S. 1979, A&A, 80, 155
- Lilly, Carollo, & Stockton (2003) Lilly, S. J., Carollo, C. M., & Stockton, A. N. 2003, ApJ, 597, 730 (L03)
- McGaugh (1991) McGaugh, S. S. 1991, ApJ, 380, 140
- Melbourne & Salzer (2002) Melbourne, J., & Salzer, J. J. 2002, AJ, 123, 2302
- Osterbrock (1989) Osterbrock, D. E. 1989, Astrophysics of Gaseous Nebulae and Active Galactic Nuclei (Mill Valley:Univ. Science Books)
- Pagel et al. (1979) Pagel, B. E. J., Edmunds, M. G., Blackwell, D. E., Chun, M. S. & Smith, G. 1979, MNRAS, 189, 95
- Pagel et al. (1992) Pagel, B. E. J., Simonson, E. A., Terlevich, R. J., & Edmunds, M. G. 1992, MNRAS, 255, 325
- Pagel (1997) Pagel, B. E. J. 1997, Nucleosynthesis and chemical evolution of galaxies (Cambridge: Cambridge Univ. Press)
- Pérez-Montero & Díaz (2003) Pérez-Montero, E., & Díaz, A. I. 2003, MNRAS, 346, 105
- Pettini & Pagel (2004) Pettini M., & Pagel B. E. J. 2004, MNRAS, 348, L59
- Pettini et al. (2001) Pettini, M., et al. 2001, ApJ, 554, 981
- Pilyugin (2000) Pilyugin, L. S. 2000, A&A, 362, 325
- Richer & McCall (1995) Richer, M. G., & McCall, M. L. 1995, ApJ, 445, 642
- Rola et al. (1997) Rola, C. S., Terlevich, E., & Terlevich, R. J. 1997, MNRAS, 289, 419
- Salzer et al. (2000) Salzer, J. J., et al. 2000, AJ, 120, 80
- Skillman, Kennicutt, & Hodge (1989) Skillman, E. D., Kennicutt, R. C., Jr., & Hodge, P. W. 1989, ApJ, 347, 85
- Terlevich & Melnick (1981) Terlevich, R. J., & Melnick, J. 1981, MNRAS, 195, 389
- Terlevich et al. (1991) Terlevich, R., Melnick, J., Masegosa, J., Moles, M., & Copetti, M. V. F. 1991, A&AS, 91, 285
- Villar-Martín et al. (2004) Villar-Martín, M., Cerviño, M., & González Delgado, R. M. 2004, MNRAS, 355, 1132
- Wirth et al. (2004) Wirth, G. D., et al. 2004, AJ, 127, 3121