INFRARED [Fe II] EMISSION FROM P CYGNI’S NEBULA: ATOMIC DATA, MASS, KINEMATICS, AND THE 1600 A.D. OUTBURST
Abstract
We present moderate and high-dispersion 1–2.5 spectra of the 10″-radius nebula around P Cygni, dominated by bright emission lines of [Fe ii]. Observed [Fe ii] line ratios disagree with theoretical transition rates in the literature, so we use the spectrum of P Cygni’s nebula to constrain the atomic data for low-lying levels of [Fe ii]. Of particular interest is the ratio [Fe ii] 12567/16435, often used as a reddening indicator, for which we empirically derive an intrinsic value of 1.49, which is 10–40% higher than previous estimates. High-dispersion spectra of [Fe ii] 16435 constrain the geometry, detailed structure, and kinematics of P Cygni’s nebula, which is the major product of P Cygni’s outburst in 1600 A.D. We use the [N ii]/[N i] line ratio to conclude that the nebula is mostly ionized with a total mass of 0.1 M⊙; more than the mass lost by the stellar wind since the eruption. For this mass, we would expect a larger infrared excess than observed. We propose that the dust which obscured the star after the outburst has since been largely destroyed, releasing Fe into the gas phase to produce the bright [Fe ii] emission. The kinetic energy of this shell is 1046.3 ergs, far less than the kinetic energy released during the giant eruption of Car in the 1840s, but close to the value for Car’s smaller 1890 outburst. In this respect, it is interesting that the infrared spectrum of P Cygni’s nebula resembles that of the “Little Homunculus” around Car, ejected in that star’s 1890 eruption. The mass and kinetic energy in the nebulae of Car and P Cygni give insight to the range of parameters expected for extragalactic Car-like eruptions.
1 INTRODUCTION
P Cygni is a key object for understanding mass loss in the most luminous evolved stars. At a distance of 1.7 kpc (adopted throughout this paper; Najarro et al. 1997) it is the nearest luminous blue variable (LBV), and it is one of only two stars in our Galaxy to have been observed during a giant LBV eruption (P Cyg’s eruption in 1600 and Car’s giant eruption in the 1840s; see Humphreys et al. 1999). Giant eruptions of LBVs — where the bolometric luminosity increases by a few magnitudes and the progenitor star survives the event — have been recognized in other galaxies as well; examples include the “Type V” supernovae SN1961v in NGC 1058 (van Dyk et al. 2002; Filippenko et al. 1995; Goodrich et al. 1989) and SN1954j (V12) in NGC 2403 (Tamann & Sandage 1968; Smith et al. 2001b; van Dyk et al. 2005), and several more recent Car analogs classified as Type IIn supernovae (e.g., Filippenko 2005; van Dyk et al. 2000; Wagner et al. 2004; Drissen et al. 2001). The lightcurves of Car and P Cyg showed dips of several magnitudes after their eruptions (Humphreys et al. 1999; de Groot 1988; Lamers & de Groot 1992), usually attributed to dust formation. Nebulae around these stars provide useful clues to the physics of their outbursts, such as the explosion geometry, chemical composition, ejection speed, mass, and kinetic energy. Since the extragalactic Car analogs are too distant to spatially resolve their nebulae, and since Car itself is such an extreme example, P Cyg’s nebula provides an important benchmark for understanding the evolution of intermediate-luminosity LBVs (see Smith et al. 2004).
P Cyg’s nebula is harder to observe than the Homunculus of Car because of its weaker contrast with the central star at all wavelengths. This difference is partially due to the longer time elapsed since P Cyg’s eruption (400 yr, as opposed to only 160 for Car), allowing the ejecta more time to disperse and fade. Excess infrared (IR) emission from dust in P Cyg’s nebula is much less pronounced than in Car — dust emission at 2–20 has not been detected above the thermal-bremsstrahlung emission from P Cyg’s stellar wind (Smith et al. 2001a; Waters & Wesselius 1986). The cool dust excess at far-IR wavelengths (Waters & Wesselius 1986) is also meager compared to other LBV nebulae like the Homunculus of Car (Morris et al. 1999; Smith et al. 2003) or the ring nebula around AG Car (McGregor et al. 1988). While the most basic physical quantities (mass, kinetic energy) of the ejecta from Car’s giant eruption are now fairly well constrained (Smith et al. 2003), those same quantities for P Cyg’s nebula are not.
P Cyg is surrounded by complex emission-line nebulosity, including an inner shell with a radius of 10–11″, an outer shell with a radius of 16, and some more extended infundibular debris in a “giant lobe” several arcminutes across (Barlow et al. 1994; O’Connor et al. 1998; Meaburn 2001; Meaburn et al. 1996, 1999, 2004). In this paper we focus on the near-IR spectrum of the bright “inner shell”, which is also observed in radio free-free emission (Skinner et al. 1998). Johnson et al. (1992) found the inner nebula to be nitrogen rich, indicating CNO-processed ejecta like in Car (e.g., Smith & Morse 2004).
A valuable spectral diagnostic of P Cyg’s nebula is its bright emission from IR lines of [Fe ii], such as 12567, 16435, and related transitions between the term to the and terms. These are collisionally-excited lines with an upper level 1 eV above the ground state. They are bright in the nebula of P Cyg and in the nebulae of several other LBVs (Smith 2002a, 2002b, 2005; Hamann et al. 1994; Allen et al. 1985). While bright IR emission from these [Fe ii] transitions is seen in shock-excited sources like Herbig-Haro objects and supernova remnants (e.g., Hartigan et al. 2004b; Graham et al. 1987; Oliva et al. 1990; McKee et al. 1984), and so is often taken as a signpost of shocks, the excitation mechanism in all LBVs is not uniform. In some LBV nebulae the [Fe ii] emission is due to shocks, while in others UV excitation is responsible (see Smith 2002a). Analysis of these [Fe ii] lines is complicated by disagreement in the literature on their relative transition rates (Nussbaumer & Storey 1988; Quinet et al. 1996; Bautista & Pradhan 1998).
Preliminary near-IR spectra of P Cyg in the H band showed bright [Fe ii] 16435 out to 10″ from the star (Smith 2001, 2002a), consistent with the inner shell seen in images (Barlow et al. 1994). Here we investigate the IR emission from [Fe ii] in more detail with spectral observations from NASA’s Infrared Telscope Facility (IRTF), sampling many [Fe ii] transitions across the 1–2.5 wavelength range at moderate resolution using Spex, and at high spectral resolution for the 16435 Å line alone using CSHELL.
2 OBSERVATIONS
2.1 SPEX
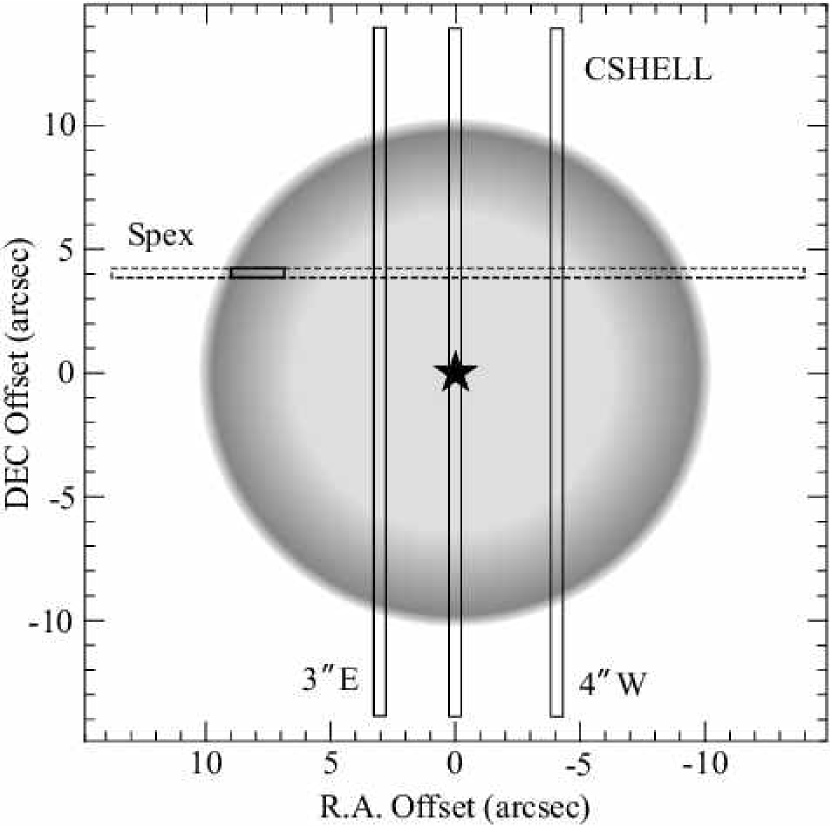
We obtained long-slit 1-2.5 spectra of P Cygni’s nebula on 2004 August 19 with the near-IR spectrograph Spex (Rayner et al. 2003) mounted on the IRTF. Spex uses a 10241024 Aladdin3 InSb array, with a spatial pixel scale of 015. We used Spex in long-slit mode with the 03-wide slit (providing a spectral resolution of 2000) oriented along P.A.=270, and positioned 4″ north of the star to sample emission from the nebula while avoiding the bright central star (see Figure 1). Sky subtraction was accomplished by nodding 30″ along the slit so that the nebula was always in part of the slit; the total on-source exposure time was 16 minutes in each of four filters (K, H, and two filters in the J band). Wavelength calibration was measured using an internal emission lamp, while flux calibration and correction for telluric absorption were accomplished using observations of spectroscopic standard stars. On the night these observations were obtained, the conditions were photometric and the seeing was 08.
Figure 2 shows the spectrum extracted from a 2″-wide segment of the long-slit data, corresponding to a bright knot in the nebula located 4″ north and 8″ east of the star (see Fig. 1). However, this is not a true sample of the nebular emission, since there is significant contamination from instrumental scattered starlight, and starlight reflected by dust (continuum emission and stellar wind lines are seen).
Therefore, Figure 3 shows the same spectrum, but with the reflected starlight subtracted. The reflected starlight was sampled from a different region along the slit closer to the star where the continuum emission was much stronger relative to the nebular emission (it was simple to disentangle the contributions of nebular emission and scattered light, since [Fe ii] lines like 16435 are absent in the spectrum of the central star). Intensities of nebular lines measured in this spectrum are listed in Table 1, where noise in fitting the continuum level dominates the uncertainties. Additional uncertainties in the flux calibration between various wavelength regions depend on the seeing and the exact position of the slit aperture during observations of the standard star, potentially causing changes in the fraction of the total point spread function included in the slit; these uncertainties are harder to quantify. However, it is reassuring that the scattered continuum light from the star in Figure 2 follows a smooth trend from one band to the next — there is no strong discontinuity in the continuum level between the and bands, for example, indicating no severe difference in slit position between exposures of the standard star. Figure 4 shows tracings of the 12567 and 16435 intensities and ratios along the slit, as well as the 15335/16435 flux ratio, which is a diagnostic of variations in the electron density.
2.2 CSHELL
On 2003 July 31 we observed P Cygni with the high-resolution spectrograph CSHELL (Greene et al. 1993) mounted on the IRTF. These observations were conducted remotely from the University of Colorado. CSHELL has a 256256 SBRC InSb array with a spatial pixel scale of 02, although only 160 pixels are illuminated in the spatial direction, yielding an effective slit length of roughly 30″. We used a slit width of 05, providing a spectral resolving power of 43,000 or 7 km s-1. The circular variable filter (CVF) wheel isolates a single order, and we chose a central wavelength corresponding to the bright [Fe ii] 16435 emission line (vacuum wavelength 16439.98 Å).
We observed three separate pointings with the slit oriented at P.A.=0° and centered on the central star, 3″ east, and 4″ west (see Fig. 1). At each position, we used total on-source integration times of 20–30 minutes, and sky-subtraction was accomplished with identical observations of an off-source position. The resulting 2-D spectra at these three pointings are shown in Figure 5. Wavelengths were calibrated using telluric absorption lines, adopting vacuum wavelengths in the telluric spectrum available from NOAO. Velocities in Figure 5 are heliocentric, and have been corrected for the motion of the Earth (to convert to LSR velocities for P Cygni, add 18.1 km s-1).
2.3 Optical Spectra
To supplement these IR spectra (specifically for the purpose of investigating the electron density and ionization fraction), we also obtained visual-wavelength spectra of the nebula. We observed P Cygni on 2005 May 5 using the Goldcam spectrograph on the Kitt Peak National Observatory (KPNO) 2.1m telescope. We used two different settings to cover the full optical spectrum from about 3400 – 7200 Å. For blue wavelengths, we used grating 58 in second order, and for red wavelengths we used grating 47 in first order. Both observations used a 125′ slit aperture offset 4″ north of the star (identical to the Spex slit position shown in Fig. 1). Total exposure times were 30 minutes in the blue, and 40 minutes for the red spectrum. Flux calibration was performed with reference to spectra of the central star, P Cygni itself, for which the visual spectral energy distribution has been studied extensively (e.g., Lamers et al. 1983). Some relative line intensities are discussed further in §5.1 and §5.2 to aid our interpretation of the IR spectra.
3 ANALYSIS OF RELATIVE LINE INTENSITIES
3.1 General Comments on the Near-IR Spectrum
After subtracting the scattered starlight, the near-IR spectrum of P Cygni’s nebula in Figure 3 is dominated by lines of [Fe ii]. The strength of the [Fe ii] lines is unusual compared to circumstellar nebulae around other types of evolved stars, such as planetary nebulae and Wolf-Rayet ring nebulae, and is a testament to the high density of the gas, and the high luminosity and relatively low effective temperature of the central star. The bright [Fe ii] spectrum of P Cygni’s nebula resembles that of the Homunculus nebula around Car (Smith 2002), although P Cygni shows no emission lines of molecular hydrogen. The lack of H2 is probably due to the much lower mass of P Cygni’s nebula (see §5.3) and to the extreme youth of the Homunculus. The lack of H2 is also consistent with the fact that we detect no emission from the 2.3 CO emission features. These bright near-IR lines of [Fe ii] are common in the circumstellar nebulae of LBVs in general (Smith 2002).
The long-slit aperture allows us to investigate spatial variations across the nebula. For example, Figure 4 shows that across the Spex slit placed 4″ north of the star, there is little variation in either the reddening or electron density, traced by the [Fe ii] ratios 12567/16435 and 15335/16435, respectively. This verifies that in general, the physical conditions we derive for one particular region of the nebula probably apply to most of the bright [Fe ii] shell as well.
Figure 3 and Table 1 also show several emission lines of [Ni ii]. Of particlar interest are [Ni ii] 23079 and 23688 (both are ), which are rarely seen in circumstellar nebulae.111Another line of this multiplet, [Ni ii] 19388 (), is expected to be strong but was not within the wavelength range of our observations. These lines share the same upper term as [Ni ii] 7379 and 7412 (), which are extremely bright in the nebula of P Cygni (Johnson et al. 1992; Barlow et al. 1994), and whose strength is thought to be a consequence of fluorescence (Lucy 1995). These same lines are also strong in the Crab Nebula (Dennefeld & Pequignot 1983; Henry et al. 1984), and are seen in Herbig-Haro jets very close to their sources (Hartigan et al. 2004a). It is not known if a similar continuum-fluorescence process affects the [Fe ii] lines.
3.2 Atomic Data
The numerous [Fe ii] lines in our P Cyg spectra make it possible to constrain Einstein A coefficients. These calculations are important because the A values for these transitions computed in two previous studies (Quinet et al. 1996, hereafter Q96; Nussbaumer & Storey 1988, hereafter NS88) differ by as much as 30%. A 30% error in the [Fe ii] 12567/16435 flux ratio, used to estimate reddening because these lines originate from the same upper level, translates into a much larger error when reddening corrections are extrapolated to optical wavelengths. For example, if the intrinsic ratio of [Fe ii] 12567/16435 increases by 30% , then an object which would have had AV=0 using the lower ratio now has AV=2.85.
The spectra in Fig. 2 recorded ten [Fe ii] emission lines between the second-excited term and the first-excited term 4F, and an additional seven [Fe ii] lines from to the ground term . The lowest 13 energy levels of Fe ii, are respectively, , , and , and in what follows we simply refer to these levels as 1 through 13. For example, in this notation the 12567 Å and 16435 Å transitions are 10-1, and 10-6, respectively.
Table 2 compiles the 17 observed transitions into 30 line ratios in four groups, where each group originates from a common upper state. Within each group we adopted the A value for the brightest transition from NS88, whose compilation agrees somewhat better with our data than do the values of Q96. Other A values within the group then follow from the observed emission line ratio and known reddening (AV=1.89, Lamers et al. 1983). Table 2 shows the predicted emission line ratios for AV=0 and AV=1.89 for Q96 and NS88, together with the line ratios predicted from the new list of A-values in Table 3, reddened with AV=1.89. By construction, the new dereddened A coefficients match the observations in Table 2. The last column of Table 2 is the uncertainty in the observed ratio.
The first and third lines of Table 3 are of particular interest to all reddening estimates using near-IR [Fe ii] lines. The new ratio of A values for the [Fe ii] lines at 12567 Å and 16435 Å is 1.13, 10% higher than the value of 1.04 of NS88 and over 40% higher than the Q96 value of 0.79. This corresponds to an intrinsic [Fe ii] 12567/16435 line intensity ratio of 1.49, higher than Q96 (1.04) or NS88 (1.36). As Table 3 shows, when NS88 and Q96 disagree most we typically find A values closer to NS88, but often the new values do not lie between the estimates of NS88 and Q96. Thus, our results indicate that previous studies that adopted the intrinsic 12567/16435 line ratios from Q96 or NS88 have underestimated the true reddening. The 12567/16435 line ratio is often used to estimate reddening in AGN as well; Rodriguez-Ardila et al. (2004) have also argued that the A-values of Q96 and NS88 are incorrect, but they favor an even lower value for the intrinsic line ratio of only 0.98. Our study of P Cygni reveals that this cannot be correct, since even our raw observed value for this ratio is 1.25.
We did not attempt to constrain collision strengths between the various levels or compare A values between different groups because the densities within the P Cygni nebula are not known well, and the flow is clumpy (see §4). However, such a calculation could be done with a better understanding of the electron densities in the shell. A deeper optical search for faint emission lines would help in this regard.
4 GEOMETRY AND KINEMATICS
4.1 Spatial and Kinematic Morphology
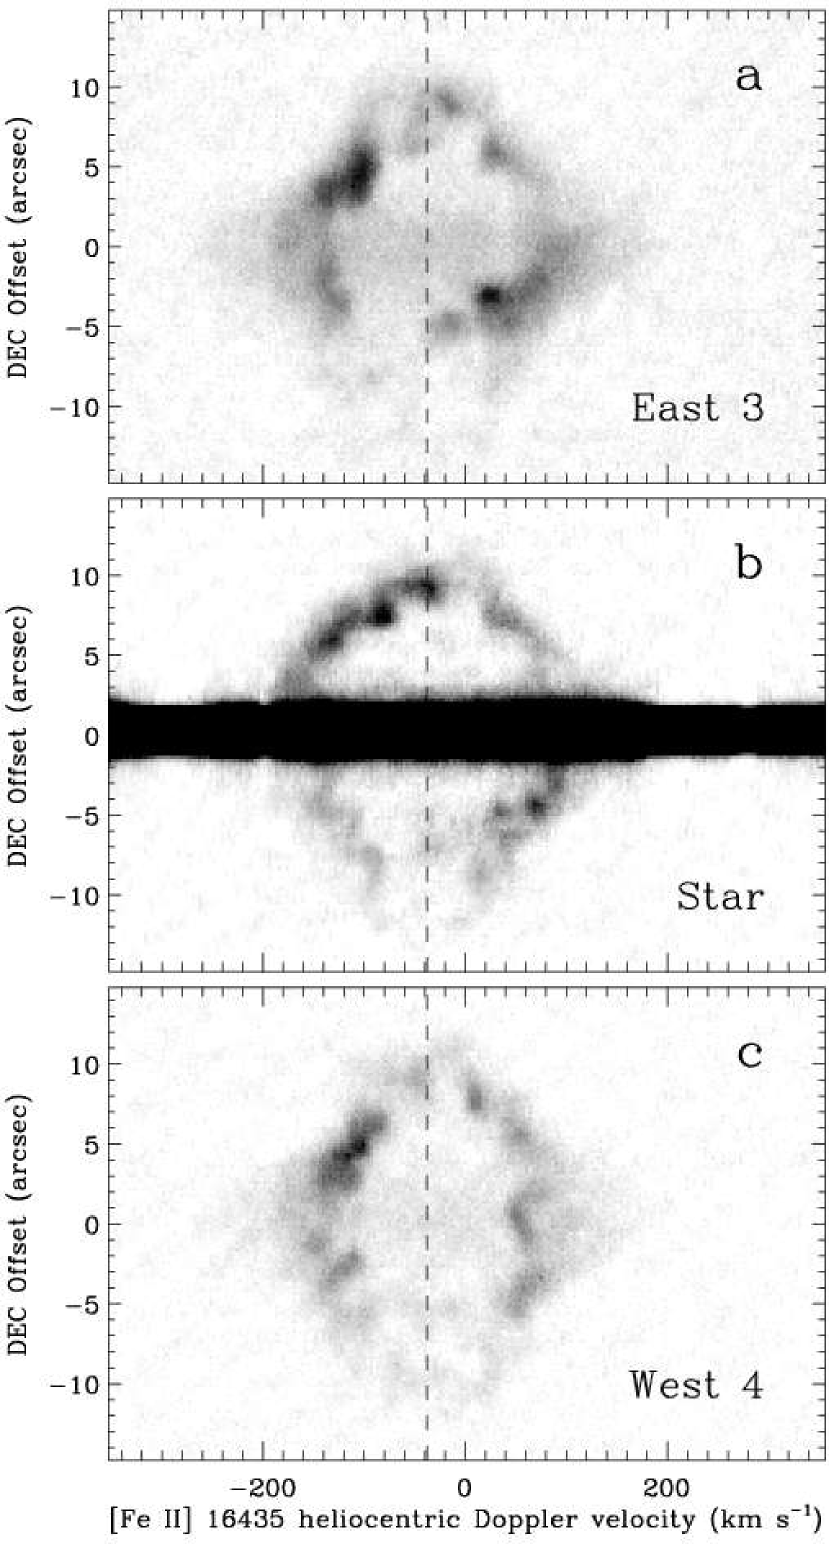
Figure 5 shows high-dispersion spectra of [Fe ii] 16435 at three different positions in the nebula, with the slit oriented in the north/south direction and centered 3″ east of the star, on the star, and 4″ west. The morphology seen in Figure 5 is consistent with three slices through a roughly spherical expanding shell. However, it is obviously not a uniformly smooth sphere, as prominent knots and corrugations exist. The detailed structure of the shell is reminiscent of Vishniac instabilities when a thin shell with dense knots is swept up by a faster low-density wind (e.g., Garcia-Segura et al. 1996). This is indeed the case, as the shell expansion is slower than the terminal velocity of the present-day stellar wind (see §4.2). Aside from these perturbations with typical sizes of 1–2″, the only striking departure from spherical symmetry is a possible blow-out at –80 to 0 km s-1 (heliocentric) at the southern edge of the shell, most apparent in Figure 5.
Although the overall shape of the nebula is basically spherical, it does show some large-scale brightness asymmetry. For example, in all three slit positions in Figure 5, the brightest emission is north of the nebula’s center and on the blueshifted side of the shell. There are corresponding local brightness maxima on the opposite side (to the south and redshifted) of the shell in Figures 5 and . This hints at a sort of reflected symmetry consistent with cross sections through an inclined ring or torus of brighter emission embedded in the shell, with its northern polar axis tilted away from us by 45°.
The [Fe ii]-emitting knots in Figure 5 have resolved linewidths of typically FWHM15–20 km s-1. This is obviously too broad for an iron line to be due to thermal broadening, so it represents dynamic expansion of the gas or perhaps broadening due to shocks as the stellar wind interacts with slower nebular material.
4.2 Physical Parameters of the Shell
The high-resolution spectra in Figure 5 have clearly resolved the spatial and kinematic structure of P Cyg’s nebula, allowing us to quantitatively constrain several of its basic physical parameters. The slit position centered on the star is the most useful as it crosses through the middle diameter of the nebula, sampling the largest spatial extent and the highest velocities.
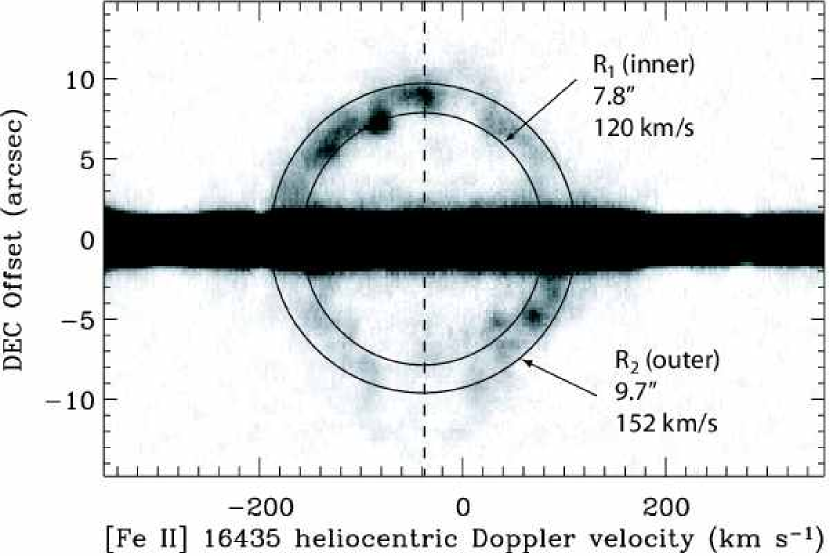
Figure 6 shows the same data as in Figure 5 for the slit passing through the star, but with two ellipses drawn to represent the idealized inner and outer boundaries of a single spherical shell (with radii of and , respectively). Because of the knots and corrugations in the nebula, these ellipses are obviously not perfect boundaries for the shell, but they are useful for guiding our interpretation of the nebular structure and for eventually estimating its mass and kinetic energy in §5 below. Derived parameters for these two surfaces are discussed below and are summarized in Table 4.
Systemic Velocity: The centroid velocity of each of the two ellipses gives the center-of-mass velocity of the nebula. The dashed vertical line in each panel of Figures 5 and 6 shows the approximate centroid velocity of the shell, taken to represent the systemic velocity of P Cygni at =–385 km s-1 (the uncertainty here is dominated by the irregular structure in the shell, rather than statistical measurement uncertainty). Relative to the local standard of rest, this systemic velocity would be about =–205 km s-1, which is in reasonable agreement with –22.61.5 km s-1 estimated by Barlow et al. (1994) from optical lines.
Expansion Velocity: The inner boundary of the shell () has an expansion velocity of 120 km s-1 with respect to the systemic velocity, and the outer edge () expands at 152 km s-1. These are slower than the present-day terminal speed of P Cygni’s wind, which is roughly 185 km s-1 (Najarro et al. 1997; Lamers et al. 1996). Thus, it is reasonable to expect a 65 km s-1 shock at the inside surface of the nebula where the faster stellar wind catches up. However, this shock will not profoundly affect the gas temperature or the relative line intensities in the nebular spectrum, since radiative energy input from the star exceeds that of the kinetic energy from the wind by a factor of 104. The mean expansion speed of 136 km s-1 that we measure from [Fe ii] 16435 is close to the value of 140 km s-1 measured from optical [N ii] lines by Barlow et al. (1994), but significantly higher than the 110 km s-1 expansion they measured from [Ni ii] lines. Barlow et al. explained the discrepancy between the apparent expansion speeds of [N ii] and [Ni ii] by proposing that the [Ni ii] emission arises in slower dense knots that have been overtaken by the stellar wind, producing more extended bow shocks around the knots that emit [N ii] and other nebular lines. Our new results contradict this conjecture, since the [Fe ii] and [Ni ii] transitions both share the same low ionization and high critical densities that motivated the explanation. The densest knots should emit [Fe ii] as well.
Shell Radius and Thickness: The inner and outer radii of the idealized spherical shell in Figure 6 are =78 or 2.01017 cm and =97 or 2.51017 cm. Some emission is seen to extend beyond these boundaries in the form of dense knots (interior) or diffuse emission (exterior). The overall thickness of the shell is =19 or 51016 cm. Aside from a few redshifted knots located 5–6″ south of the star, the shell is hollow (i.e. there is no younger shell expanding inside this one).
Dynamical Age: If the ellipses in Figure 6 trace spherical surfaces of the shell, then at a distance of 1.7 kpc, R/ gives the dynamical age of each feature assuming linear motion. For the dynamical age is 531 yr, and for it is 524 yr; these are in good agreement with one another considering that the uncertainty is of order 5%. Of course, the dynamical age reflects linear motion and does not necessarily signify the true age of the ejecta, since the shell may have been accelerated by the stellar wind or decelerated by slower ambient material. The present-day nebular expansion speed (136 km s-1) is in fact lower than the stellar wind speed (185 km s-1), suggesting that the shell has decelerated to 3/4 of its initial speed. Coincidentally, the dynamical age we measure assuming linear motion is 4/3 of the time since the 1600 outburst. In other words, by assuming linear motion we overestimate the age by precisely the same factor that the shell’s velocity has apparently slowed. This agreement would seem too fortuitous if the bright shell around P Cygni were not ejected in the 1600 A.D. outburst. Given the lack of any comparably bright ejecta closer to the star,222Barlow et al. hinted at the possible existence of a 6″-radius shell, but we do not see evidence for this smaller shell in our data. The envelope close to the star seen by Chesneau et al. (2000) corresponds to the outer parts of the stellar wind, and cannot be the major result of the 1600 A.D. outburst. we conclude that the bright [Fe ii] shell in Figures 5 and 6 was indeed ejected during the 1600 outburst and has been decelerated by interaction with the ambient medium.
Filling Factor: While the overall thickness of the shell derived above is roughly 19, it is clear from Figure 5 that the shell is significantly thinner and corrugated with several knots and loops; i.e. it has complex substructure. The [Fe ii] 16435 emission is dominated by the densest material in clumps and filaments, so for estimating the mass in the next section, a representative density filling factor is necessary. Assigning a value for the filling factor based on the observed structure of the nebula is subjective, but we can nevertheless make an educated guess, since the filling factor of the thick shell drawn in Figure 6 is clearly not 1. A value closer to 0.2 seems more appropriate, but an even lower value might apply if our spatial resolution is inadequate to resolve the sizes of features in the nebula. We provisionally take =0.20.1.
5 MASS AND KINETIC ENERGY
In the previous section, we concluded that the bright [Fe ii] shell seen in our spectra is indeed the major product of the 1600 outburst of P Cygni. Thus, the mass and kinetic energy of this shell trace the total mass ejected and the mechanical luminosity of the outburst. If P Cygni’s nebula can be approximated as a spherical hollow shell, then a rough estimate of the total gas mass of the nebula can be expressed as
| (1) |
where =2.2 is the mean molecular weight for a neutral (see §5.2) He mass fraction of =0.55 (Najarro et al. 1997); fH is the hydrogen ionization fraction, and is the filling factor in the shell. The geometry is constrained (see §4.2) from our high-resolution spectra of [Fe ii] 16435, while the filling factor is only marginally constrained. This leaves the electron density and the H ionization fraction as the unknown quantities that need to be addressed before we can estimate the mass from equation 1.
5.1 Electron Density
Johnson et al. (1992) measured an electron density of =600 cm-3 using the [S ii] 6717,6731 doublet, although their spectra had low sensitivity. From the same [S ii] doublet in higher quality data, Barlow et al. (1994) measured higher densities of 700–2000 cm-3 at various positions in the nebula. In our new optical spectra, with the slit offset 4″ north of the star, the [S ii] ratio indicates a range of electron densities from about 2,500 to 11,000 cm-3. In Figure 7 we show tracings of the spectrum at three positions along the slit with the reflected starlight subtracted.
However, much of the mass may potentially reside in dense clumps or filaments that emit [Fe ii] lines, but where the [S ii] lines are collisionally de-excited. Therefore, when deducing the mass from geometric parameters that apply to [Fe ii] emission regions, it is more appropriate to estimate the average electron density in the [Fe ii] emitting gas itself, which tends to favor the highest densities. The ratio 15335/16435 is a diagnostic of electron density, and the bottom panel in Figure 4 suggests that this ratio has a fairly uniform value of 0.15 across the nebula. Adopting the transition probabilities of Nussbaumer & Storey (1988)333While our spectrum of P Cygni’s nebula suggests some potential problems with the atomic data for [Fe ii], our new transition rates for these two lines do not differ from those of Nussbaumer & Storey by more than 40%., the 15335/16435 ratio of 0.15 would suggest an electron density of roughly 6000–8000 cm-3. This is in agreement with some of the denser material traced by the [S ii] ratio in our spectra. We adopt =6000 cm-3 as representative for the dense [Fe ii]-emitting gas, with the caveat that it could be in error by as much as a factor of 2 in either direction.
5.2 The Ionization Fraction
To estimate the true mass of the nebula, we must first deduce the hydrogen ionization fraction fH = n(H ii)/(n(H i)+n(Hii)). We experimented with the spectral synthesis code CLOUDY (Ferland 1996) to simulate a thick shell with the geometry described above, illuminated by a central star with Teff=1.9104 K and L=6105 L⊙ (Najarro et al. 1997; Lamers et al. 1983, 1996). We found that He was neutral and H was almost fully ionized in such a situation. However, it is not necessarily safe to assume that P Cyg’s nebula is fully ionized, since the dense stellar wind extinguishes much of the star’s Lyman continuum radiation if H recombines along the flow. For example, Najarro et al. (1997) find that in the outermost parts of the stellar wind, the ionization fraction is 0.5. Returning to the CLOUDY simulations, by varying the amount of escaping Lyman continuum radiation that is extinguished by the wind we could produce a wide range of values for the ionization fraction in the nebula (0.05f1)444We note that we could not reproduce the strength of the near-IR lines of [Fe ii] in any of these CLOUDY calculations.. Furthermore, if much of the Lyman continuum is indeed extinguished and the nebula would otherwise be mostly neutral, then we may need to include the effects of shock heating by the stellar wind that overtakes the shell. Barlow et al. (1994) considered shocks to be important in the observed spectrum of P Cygni’s nebula. In other words, we need more information to constrain this problem.
We could, in principle, use the observed ratios of [O i] and [O ii] lines in the nebula to trace the hydrogen ionization fraction. In fact, this was the goal in obtaining our optical spectra. Unfortunately, we did not detect [O i] 6300 or [O ii] 3727 in our spectra of P Cygni’s nebula, perhaps owing to a depleted oxygen abundance or very bright scattered light from the star at blue wavelengths. However, [N ii] 6583 is a bright line in the nebula, and our optical spectra also show weak [N i]5200 at about the 2 level (in this discussion, [N i]5200 refers to the sum of the individual doublet lines at 5199Å and 5201Å). The large flux ratio of the [N ii] to [N i] lines suggests that the gas is mostly ionized.
The relative flux of [N ii]6583 and [N i]5200 is determined by three parameters: the electron temperature, electron density, and the ratio of the densities of [N ii] and [N i]. The average electron density is 6000 cm-3, as mentioned above, and the electron temperature for photoionized gas should be 104K. The case of a radiative shock is somewhat more complicated, as the temperature in the [N ii]-emitting region is higher than that for [N i]. In this case we adopt values typical for the cooling zones of a low ionization shock, where T(N ii)104K and T(N i)6500 K.
To obtain the density ratio n(N ii)/n(N i), we performed a full 5-level atom calculation for N i and N ii using the latest available atomic data for the Einstein-A values and collision strengths (Hudson & Bell 2005; Storey & Zeippen 2000; Bell et al. 1995; McLaughlin & Bell 1993; Baluja & Zeippen 1988; Zeippen 1987; Froese Fischer & Saha 1985; Butler & Zeippen 1984; Berrington & Burke 1981; Le Dourneuf & Nesbet 1976; Pradhan 1976; Dopita et al. 1976). Collisions and radiative decay determine the relative populations of the energy levels and therefore allow us to infer the density ratio of N ii/N i from the observed emission line ratios. Physically, the value of the density ratio n(N ii)/n(N i) is set by collisional ionization, photoionization, and charge exchange between N i, N ii, H i, and H ii.
Using our 3 upper limit for the strength of [N i], we measure a value for the line ratio [N ii] 6583/[N i] 5200 greater than 127 in the shell of P Cygni, with the slit offset 4″ north of the star (if our 2 detection is to be believed, the same line ratio would be 189). Using the 2 result for the constant temperature (photoionization) case, we found nitrogen ionization fractions n(N ii)/(n(N i)+n(N ii)) of 0.90–0.98 for Te of 5000-20000 K; the corresponding 3 limits over this temperature range are 0.86 to 0.98. For the shock-like case, the observed [N ii]/[N i] ratio would imply nitrogen ionization fractions of 0.73 and 0.80 for the 3 and 2 measurements, respectively. So in all cases, we find that nitrogen is mostly ionized. The next question is how to convert the nitrogen ionization fraction into the hydrogen ionization fraction. If, as should occur in the cooling zone of a shock, charge exchange is the dominant process that ties N ii/N i to H ii/H i, then
| (2) |
The exponential factor arises from the different ionization potentials of N (14.53 eV) and H (13.59 eV), while the factor of 4.5 reflects the relative statistical weights of the N ii+H i and N i+H ii outlet channels. At K, n(N ii)/n(N i) = 1.5 n(H ii)/n(H i), so that fH = 2fN/(3-fN), where fH is the ionization fraction of H and fN is the ionization fraction of N. At K, when fN = 0.9, we find fH = 0.86. Hence, whenever charge exchange dominates the ionization states and N is mostly ionized, so is H.
As the ionization parameter (ratio of density of ionizing photons to total H density) increases, photoionization becomes increasingly more important relative to charge exchange in determining the ionization fractions of H and N. In P Cygni’s nebular shell at the adopted density, the ionization parameter is roughly 10-5.3. The value for the hydrogen ionization fraction derived from the observed [N ii]/[N i] ratio (a few percent neutral) agrees with what we would expect a priori from this ionization parameter based on the Lyman continuum flux escaping the thick wind of P Cygni using an upper limit of 1044.4 s-1 from recent modeling work that is in preparation by Najarro & Hillier (Najarro 2005, private comm.; see also Najarro et al. 1997). In any case, the observed [N ii]/[N i] ratio implies that P Cygni’s nebula is mostly ionized. This result removes a potentially large source of uncertainty in estimating the mass of the outburst.
5.3 Mass and Mechanical Energy of the 1600 A.D. Outburst
Following the previous subsections, if we take to be 6000 cm-3 and 0.8f0.95, then equation (1) and the geometric parameters deduced in §4.2 give
| (3) |
for the mass of P Cygni’s inner shell nebula. This is only an order-of magnitude estimate owing to the factor of 2 uncertainties in the geometric filling factor and the electron density.
Is this mass estimate plausible? We can perform a sanity check by guessing what we think the nebular mass should be based on the density contrast of the nebula and the duration of the outburst. For a constant spherical post-eruption wind with =310-5 M⊙ yr-1 (Najarro et al. 1997), the particle density at the radius of the nebula is 100 cm-3. Thus, the nebula has an overdensity factor of roughly 60 compared to the stellar wind at the same radius, presumably marking a huge increase in the mass-loss rate during the 1600 A.D. eruption. Based on this factor of 60 overdensity of the nebula, we might expect the mass-loss rate during eruption to have been 1.810-3 M⊙ yr-1. This seems reasonable, since a mass-loss rate much greater than 10-4 M⊙ yr-1 would be required for a significant pseudo photosphere to form in the wind (Smith et al. 2004), as expected during an LBV outburst (e.g., Appenzeller 1986). Comparably large values of would also be required to form dust in the wind and obscure the star. So, if mass loss occurred at this rate during the 55 yr duration of P Cygni’s 1600 A.D. eruption (Humphreys et al. 1999), then the nebular mass should be about 0.1 M⊙. This is in fortuitously-good agreement with equation (3). This conjecture depends on several assumptions and is not conclusive — it merely shows that the mass we derived is sensible. In particular, this suggests that our assumed filling factor is not seriously wrong.
Given the high mass-loss rate during the 1600 outburst and the dip in the historical lightcurve after the eruption, it is reasonable to assume that significant quantities of dust formed during the event. Dust residing at the radius of the [Fe ii] shell observed in our spectra should have a temperature of 60 ()1/4 K, where depends on the grain size. For large grains like those seen in Car and other LBVs (Smith et al. 2003), we should therefore expect dust temperatures of 60 K in P Cyg’s nebula, emitting primarily at wavelengths longer than 30 . A total dust mass emits a flux of
| (4) |
where is the grain opacity, is the Planck function, and =1.7 kpc. In the 60 IRAS band, for example, 60 K dust with 10-3 M⊙ (assuming a gas:dust mass ratio of 100) and (60 )=87 cm2 g-1 (Draine 2003) would emit a flux of roughly 24 Jy. Waters & Wesselius (1986) reported 60 excess emission (flux in excess of the stellar wind emission, possibly due to cool dust) of roughly 90%, corresponding to an excess of only 1.2 Jy. This would seem to indicate that either 1) in our analysis above we have overestimated the mass by more than an order of magnitude, or 2) that dust grains have been depleted in P Cygni’s nebula by more than an order of magnitude compared to the typical ISM fraction. The extreme strength of infrared [Fe ii] lines that we observe in the nebula suggests that grains are in fact depleted so that Fe is released into the gas phase. We found a similar ionized gas to dust ratio (about 1000) in the nebula of RY Scuti (Smith et al. 2002; Gehrz et al. 2001).
If the shell mass is 0.1 M⊙ and it is expanding at an average speed of 136 km s-1, then the kinetic energy of P Cygni’s shell is about 21046 ergs. This represents the minimum amount of mechanical energy imparted to the ejecta during the 1600 A.D. eruption. The luminous energy radiated during that eruption was roughly 2.51048 ergs (Humphreys et al. 1999). Thus, a small fraction (1%) of the total energy was used to accelerate the ejecta during this event. Of course, we must keep in mind that this fraction may be somewhat higher, since the nebula appears to have decelerated to 3/4 of its initial ejection speed. In any case, the ratio of kinetic to luminous energy associated with P Cygni’s eruption (1%) is still far less than the eruption of Carinae in the 1840’s, when KE/Lt1 (Smith et al. 2003).
While the total kinetic energy associated with P Cygni’s 17th century eruption is about 4000 times less than the 1840’s eruption of Carinae, it comes much closer to the mechanical energy of Car’s second eruption in 1890, which was about 81046 ergs (Smith 2005). The similar amounts of kinetic energy in these two outbursts is underscored by the similar properties in the two nebulae. P Cygni’s shell and the Little Homunculus of Car (produced in that 1890 outburst; Ishibashi et al. 2003; Smith 2005) both have extremely bright [Fe ii] emission (Smith 2002a; 2005), both have little or no detectable thermal-IR emission from dust (Smith et al. 2003; Waters & Wesselius 1986), they have similar amounts of mass, and both have similar expansion velocities slower than the present-day stellar wind that is overtaking them.
5.4 Broader Implications for Mass-loss
The mass and kinetic energy of P Cygni’s nebula are important for understanding the mechanism behind giant eruptions of LBVs and extragalactic Car analogs, as well as their role in mass loss during the late evolution of the most massive stars.
P Cygni and Car are the only two LBVs in our Galaxy for which a giant outburst has been observed directly. Compared to Car (Smith et al. 2003), the mass and kinetic energy of P Cygni’s nebula are much lower, and so these two objects define a range of likely values for the mass and mechanical energy of extragalactic Car eruptions. The low mass and relatively low dust content of the nebula around P Cygni are probably more representative of lower-luminosity events like SN1954J (V12 in NGC 2403; Tamann & Sandage 1968; Smith et al. 2001b; van Dyk et al. 2005), while the massive and dusty Homunculus around Car itself is more akin to the most extreme events like SN1961V in NGC1058 (van Dyk et al. 2002; Filippenko et al. 1995; Goodrich et al. 1989).
This study raises an important question in the evolution of very massive stars: As massive stars shed their outer layers to become WR stars, is most of the mass lost in a steady stellar wind or in brief eruptions? In the case of Car, the huge mass of the Homunculus (10 M⊙) indicates that most post-main-sequence mass loss happens during brief outbursts (Smith et al. 2003). Is this also true for P Cygni? The total mass inside the nebular shell of P Cygni, filled by the stellar wind since the 1600 eruption, is only 0.012 M⊙ (assuming a steady mass loss rate of =310-5 M⊙ yr-1; Najarro et al. 1997). Thus, P Cygni has lost about 10 times more mass during a brief outburst than it has in the time since that eruption — but obviously this depends on the typical time period between such eruptions, which could be longer than the 400 years since P Cygni’s last outburst. Meaburn et al. (1996) have studied an outer shell with a dynamical age of roughly 2100 yr, presumably containing a similar amount of mass to that of the inner shell. The mass lost since that time by the quiescent stellar wind is only about 0.07 M⊙, supporting the idea that most mass loss occurs during major outbursts.
Since giant outbursts like those of P Cygni, Car, and the extragalactic Car analogs may dominate the total mass lost on the way toward the WR phase, it is more than a little embarrassing for the study of stellar evolution that we do not yet know how these eruptions are triggered or what supplies their energy.
6 SUMMARY AND CONCLUSIONS
Our study of the near-IR spectrum of P Cygni’s nebula has led to the main conclusions below:
1. The near-IR spectrum of P Cygni is dominated by collisionally-excited lines of [Fe ii], mainly from the three lowest terms. It closely resembles the near-IR spectrum of the Homunculus nebula around Car, except that P Cygni’s nebula lacks the molecular hydrogen seen there (Smith 2002b).
2. Using 17 near-IR lines of [Fe ii] we have determined empirical values for the transition ratios and Einstein A coefficients for lines between the lowest 3 terms of Fe+ (, , and ). These empirical values are in better agreement with the calculations of NS88 than with those of Q96, but in some cases our values differ substantially from both.
3. The ratio 12567/16435 is of particular importance, as the two bright lines share a common upper level and are often used to deduce the reddening. We find an experimentally-determined value for this intrinsic line ratio of 1.49 (adopting =1.89; Lamers et al. 1983); higher than previous values.
4. From high-resolution spectra of [Fe ii], the geometric parameters of P Cygni’s inner shell are as follows: The shell radius is 1017.3–1017.4 cm, the average expansion velocity is 136 km s-1, the dynamic age is about 530 yr, and the geometric filling factor for [Fe ii]-emitting filaments appears to be roughly 0.2.
5. Based on the present expansion speed compared to the speed of the stellar wind, the dynamic age of the nebula, and the lack of any bright nebulosity inside the main shell, we conclude that the 10″-radius [Fe ii]-emitting shell around P Cygni is the major product of the 1600 A.D. outburst.
6. The electron density in the shell ranges from roughly 2,000–11,000 cm-3, with a representative value of 6,000 cm-3 for the denser [Fe ii]-emitting filaments.
7. Based on models for the observed [N ii] 6583/[N i] 5200 line ratio, we find a likely hydrogen ionization fraction of 0.8–0.95 for a wide range of possible excitation scenarios, while He is mostly neutral.
8. The total mass of the nebula is about 0.1 , subject to errors in the filling factor and the electron density. This, combined with the weak thermal-IR emission from dust, suggests that the gas:dust mass ratio exceeds the canonical value of 100 by an order of magnitude. Destruction of dust grains that released Fe into the gas phase may help explain the very bright [Fe ii] emission in P Cygni’s nebula.
9. From the total mass and average expansion velocity, the kinetic energy imparted to the ejecta during the 1600 A.D. outburst was roughly 1046.3 ergs.
References
- (1)
- (2) Allen, D.A., Jones, T.J., & Hyland, A.R. 1985, ApJ, 291, 280
- (3)
- (4) Appenzeller, I. 1986, in IAU Symp. 116, Luminous Stars and Associations in Galaxies, ed. C.W.H. de Loore, A.J. Willis, & P. Laskarides (Dordrecht: Reidel), 139
- (5)
- (6) Baluja, K., & Zeippen, C. 1988, J. Phys. B. Atom. Mol. Opt. Phys., 21, 1455
- (7)
- (8) Barlow, .J., Drew, J.E., Meaburn, J., & Massey, R.M. 1994, MNRAS, 268, L29
- (9)
- (10) Bautista, M., & Pradhan, A.K. 1998, ApJ, 492, 650
- (11)
- (12) Bell, Hilbert, & Stafford 1995, Phys. Scr., 52, 240
- (13)
- (14) Berrington & Burke 1981, Plan. Sp. Sci., 29, 377
- (15)
- (16) Butler, K., & Zeippen, C. 1984, A&A, 141, 274
- (17)
- (18) Chesneau, O., Roche, M., Boccaletti, A., Abe, L., Moutuo, C., Charbonnier, F., Aime, C., Lanteri, H., & Vakili, F. 2000, A&ASS, 144, 523
- (19)
- (20) de Groot, M. 1988, Irish Astron. J., 18, 163
- (21)
- (22) Dennefeld, M., & Pequignot, D. 1983, A&A, 127, 42
- (23)
- (24) Dopita, M., Mason, & Robb 1976, ApJ, 207, 102
- (25)
- (26) Draine, B.T. 2003, ARAA, 41, 241
- (27)
- (28) Drissen, L., Crowther, P.A., Smith, L.J., Robert, C., Roy, J.R., & Hillier, D.J. 2001, ApJ, 546, 484
- (29)
- (30) Filippenko, A.V. 2005, in ASP Conf. Ser. 332, The Fate of the Most Massive Stars, ed. R.M. Humphreys & K.Z. Stanek (San Francisco: ASP), 33
- (31)
- (32) Filippenko, A.V., Barth, A.J., Bower, G.C., Ho, L.C., Stringfellow, G.S., Goodrich, R.W., & Porter, A.C. 1995, AJ, 110, 2261
- (33)
- (34) Froese Fischer, C., & Saha, H. 1985, Phys. Scr., 32, 181
- (35)
- (36) Garcia-Segura, G., Mac Low, M., & Langer, N. 1996, A&A, 305, 229
- (37)
- (38) Gehrz, R.D., Smith, N., Jones, B., Puetter, R., & Yahil, A. 2001, ApJ, 559, 395
- (39)
- (40) Goodrich, R.W., Stringfellow, G.S., Penrod, G.D., & Filippenko, A.V. 1989, ApJ, 342, 908
- (41)
- (42) Graham, J.R., Wright, G.S., & Longmore, A.J. 1987, ApJ, 313, 852
- (43)
- (44) Greene, T., et al. 1993, SPIE, 1946, 313
- (45)
- (46) Hamann, F., DePoy, D.L., Johansson, S., & Elias, J. 1994, ApJ, 422, 626
- (47)
- (48) Hartigan, P., Edwards, S., & Pierson, R. 2004a, ApJ, 609, 261
- (49)
- (50) Hartigan, P., Raymond, J., & Pierson, R. 2004b, ApJ, 614, L69
- (51)
- (52) Henry, R.C.B., MacAlpine, G.M., & Kirshner, R.P. 1984, ApJ, 278, 619
- (53)
- (54) Hudson, & Bell 2005, A&A, 430, 725
- (55)
- (56) Humphreys, R.M., Davidson, K., & Smith, N. 1999, PASP, 111, 1124
- (57)
- (58) Ishibashi, K., et al. 2003, AJ, 125, 3222
- (59)
- (60) Johnson, D.R.H., Barlow, M.J., Drew, J.E., & Brinks, E. 1992, MNRAS, 255, 261
- (61)
- (62) Lamers, H.J.G.L.M., & de Groot, M. 1992, A&A, 257, 153
- (63)
- (64) Lamers, H.J.G.L.M., de Groot, M., & Cassatella, A. 1983, A&A, 128, 299
- (65)
- (66) Lamers, H.J.G.L.M., et al. 1996, A&A, 315, L229
- (67)
- (68) Le Dourneuf, M., & Nesbet, R. 1976, J. Phys. B. Atom. Mol. Phys., 9, L241
- (69)
- (70) Lucy, L.B. 1995, A&A, 294, 555
- (71)
- (72) McGregor, P.J., Finlayson, K., Hyland, A.R., Joy, M., Harvey, P.M., & Lester, D.F. 1988, ApJ, 329, 874
- (73)
- (74) McKee, C.F., Chernoff, D.F., & Hollenbach, D.J. 1984, in Galactic and Extragalactin Infrared Spectroscopy, eds. M.F. Kessler & J.P. Phillips (Dordrecht: Reidel), 103
- (75)
- (76) McLaughlin, B., & Bell, K. 1993, ApJ, 408, 753
- (77)
- (78) Meaburn, J. 2001, in ASP Conf. Ser. 233, P Cygni 2000: 400 Years of Progress, eds. M. de Groot & C. Sterken (San Francisco: ASP), 253
- (79)
- (80) Meaburn, J., Boumis, P., Redman, .P., Lopez, J.A., & Mavromatakis, F. 2004, A&A, 422, 603
- (81)
- (82) Meaburn, J., Lopez, J.A., Barlow, M.J., & Drew, J.E. 1996, MNRAS, 283, L69
- (83)
- (84) Meaburn, J., Lopez, J.A., & O’Connor, J.A. 1999, ApJ, 516, L29
- (85)
- (86) Morris, P.W., et al. 1999, Nature, 402, 502
- (87)
- (88) Najarro, F., Hillier, D.J., & Stahl, O. 1997, A&A, 326, 1117
- (89)
- (90) Nussbaumer, H., & Storey, P.J. 1988, A&A, 193, 327
- (91)
- (92) O’Connor, J.A., Meaburn, J., & Bryce, M. 1998, MNRAS, 300, 411
- (93)
- (94) Oliva, E., Moorwood, A.F.M., & Danziger, I.J. 1990, A&A, 240, 453
- (95)
- (96) Pradhan, A.K. 1976, MNRAS, 177, 31P
- (97)
- (98) Quinet, P., Le Dourneuf, M., & Zeippen, C.J. 1996, A&ASS, 120, 361
- (99)
- (100) Rayner, J.T., Toomey, D.W., Onaka, P.M., Denault, A.J., Stahlberger, W.E., Vacca, W.D., Cushing, M.C., & Wang, S. 2003, PASP, 115, 362
- (101)
- (102) Rodriguez-Ardila, A., Pastoriza, M.G., Viegas, S., Sigut, T.A.A., & Pradhan, A.K. 2004, A&A, 425, 457
- (103)
- (104) Smith, N. 2001, in ASP Conf. Ser. 233, P Cygni 2000: 400 Years of Progress, eds. M. de Groot & C. Sterken (San Francisco: ASP), 125
- (105)
- (106) Smith, N. 2002a, MNRAS, 336, L22
- (107)
- (108) Smith, N. 2002b, MNRAS, 337, 1252
- (109)
- (110) Smith, N. 2005, MNRAS, 357, 1330
- (111)
- (112) Smith, N., Gehrz, R.D., & Lawrence, G.F. 2001a, in ASP Conf. Ser. 233, P Cygni 2000: 400 Years of Progress, eds. M. de Groot & C. Sterken (San Francisco: ASP), 55
- (113)
- (114) Smith, N., Gehrz, R.D., Stahl, O., Balick, B., & Kaufer, A. 2002, ApJ, 578, 464
- (115)
- (116) Smith, N., Gehrz, R.D., Hinz, P.M., Hoffmann, W.F., Hora, J.L., Mamajek, E.E., & Meyer, M.R. 2003, AJ, 125, 1458
- (117)
- (118) Smith, N., Humphreys, R.M., & Gehrz, R.D. 2001b, PASP, 113, 692
- (119)
- (120) Smith, N., & Morse, J.A. 2004, ApJ, 605, 854
- (121)
- (122) Smith, N., Vink, J., & de Koter, A. 2004, ApJ, 615, 475
- (123)
- (124) Storey, P.J., & Zeippen, C. 2000, MNRAS, 312, 813
- (125)
- (126) Tammann, G.A., & Sandage, A. 1968, ApJ, 151, 825
- (127)
- (128) van Dyk, S.D., Filippenko, A.V., Chornock, R., Weidong, L., & Challis, P.M. 2005, PASP, 117, 553
- (129)
- (130) van Dyk, S.D., Filippenko, A.V., & Weidong, L. 2002, PASP, 114, 700
- (131)
- (132) van Dyk, S.D., et al. 2000, PASP, 112, 1532
- (133)
- (134) Wagner, R.M., et al. 2004, PASP, 116, 326
- (135)
- (136) Waters, L.B.F.M., & Wesselius, P.R. 1986, A&A, 155, 104
- (137)
- (138) Zeippen, C. 1987, A&A, 173, 410
- (139)
| (Obs.) | ID | Intensity | Error |
|---|---|---|---|
| () | (erg s-1 cm-2) | ( erg s-1 cm-2) | |
| 1.03199 | He i | 3.410-21 | 1.010-21 |
| 1.03931 | [N i] | 4.910-21 | 1.510-21 |
| 1.04612 | [Ni ii] | 4.410-21 | 2.010-21 |
| 1.05428 | N i | 7.410-21 | 1.910-21 |
| 1.07112 | [Ni ii] | 4.210-21 | 1.410-21 |
| 1.08277 | He i | 2.1710-20 | 1.310-21 |
| 1.09123 | He i+[Ni ii] | 5.710-21 | 1.310-21 |
| 1.09392 | Pa | 1.5410-20 | 2.010-21 |
| 1.10603 | ? | 6.410-21 | 1.710-21 |
| 1.11644 | ? | 4.910-21 | 1.510-21 |
| 1.12262 | ? | 4.710-21 | 1.510-21 |
| 1.12890 | O i | 5.910-21 | 1.710-21 |
| 1.13477 | [Fe ii] | 1.3810-20 | 2.010-21 |
| 1.23249 | N i | 2.910-21 | 0.510-21 |
| 1.24819 | [Fe ii] | 4.710-21 | 0.810-21 |
| 1.25642 | [Fe ii] () | 1.90410-19 | 0.810-21 |
| 1.27005 | [Fe ii] () | 5.410-21 | 0.510-21 |
| 1.27855 | [Fe ii] () | 1.1210-20 | 0.910-21 |
| 1.28177 | Pa | 2.5810-20 | 1.010-21 |
| 1.28521 | Fe ii | 2.110-21 | 0.410-21 |
| 1.29396 | [Fe ii] () | 2.6410-20 | 0.610-21 |
| 1.29749 | [Fe ii] () | 4.210-21 | 0.710-21 |
| 1.30014 | [Fe ii] | 1.410-21 | 0.410-21 |
| 1.31615 | O i | 1.5110-20 | 1.010-21 |
| 1.32028 | [Fe ii] () | 5.2710-20 | 1.410-21 |
| 1.32746 | [Fe ii] () | 1.7810-20 | 1.010-21 |
| 1.53309 | [Fe ii] () | 2.2310-20 | 0.210-21 |
| 1.59905 | [Fe ii] () | 8.610-21 | 0.310-21 |
| 1.63735 | He i | 1.310-21 | 0.310-21 |
| 1.64319 | [Fe ii] () | 1.51910-19 | 0.910-21 |
| 1.65759 | He i | 2.610-21 | 0.510-21 |
| 1.66369 | [Fe ii] () | 4.510-21 | 0.510-21 |
| 1.67664 | [Fe ii] () | 2.0010-20 | 0.610-21 |
| 1.68121 | Br11 | 2.710-21 | 0.510-21 |
| 1.68713 | Fe ii | 5.910-21 | 0.510-21 |
| 1.69731 | He i | 2.210-21 | 0.310-21 |
| 1.70099 | He i | 4.010-21 | 0.510-21 |
| 1.71101 | [Fe ii] () | 2.710-21 | 0.310-21 |
| 1.73674 | Br10 | 4.210-21 | 0.510-21 |
| 1.74497 | [Fe ii] () | 3.910-21 | 0.610-21 |
| 1.79736 | [Fe ii] () | 3.910-21 | 0.910-21 |
| 1.80033 | [Fe ii] () | 9.610-21 | 0.810-21 |
| 1.80963 | [Fe ii] () | 3.6210-20 | 1.210-21 |
| 2.05835 | He i | 7.310-21 | 1.010-21 |
| 2.14273 | Mg ii (?) | 3.610-21 | 0.710-21 |
| 2.16547 | Br | 8.210-21 | 1.110-21 |
| 2.22333 | [Fe ii] | 1.810-21 | 0.610-21 |
| 2.30786 | [Ni ii] () | 2.710-21 | 0.710-21 |
| 2.36907 | [Ni ii] () | 2.310-21 | 0.710-21 |
| 2.40651 | ? | 4.110-21 | 1.210-21 |
| =0 | =0 | =1.89 | =1.89 | =1.89 | |||
|---|---|---|---|---|---|---|---|
| Transition Ratio | Q | NS | Q | NS | New | Obs. | Err. |
| 10-1/10-2 1.25668/1.32055 | 3.80 | 3.82 | 3.66 | 3.68 | 3.62 | 3.61 | 0.10 |
| 10-1/10-6 1.25668/1.64355 | 1.04 | 1.36 | 0.87 | 1.15 | 1.25 | 1.25 | 0.01 |
| 10-1/10-7 1.25668/1.80939 | 5.17 | 6.75 | 4.17 | 5.44 | 5.24 | 5.25 | 0.18 |
| 10-2/10-6 1.32055/1.64355 | 0.27 | 0.36 | 0.24 | 0.31 | 0.35 | 0.35 | 0.01 |
| 10-2/10-7 1.32055/1.80939 | 1.36 | 1.77 | 1.14 | 1.48 | 1.45 | 1.46 | 0.06 |
| 10-6/10-7 1.64355/1.80939 | 4.99 | 4.97 | 4.77 | 4.75 | 4.19 | 4.20 | 0.14 |
| 11-2/11-3 1.24819/1.29427 | 0.35 | 0.35 | 0.06 | ||||
| 11-3/11-4 1.29427/1.32778 | 1.74 | 1.64 | 1.70 | 1.61 | 1.48 | 1.48 | 0.09 |
| 11-3/11-6 1.29427/1.53347 | 0.75 | 0.94 | 0.67 | 0.84 | 1.18 | 1.18 | 0.03 |
| 11-3/11-7 1.29427/1.67688 | 1.03 | 1.30 | 0.88 | 1.11 | 1.32 | 1.32 | 0.05 |
| 11-3/11-8 1.29427/1.80002 | 1.51 | 1.89 | 1.25 | 1.56 | 2.75 | 2.75 | 0.24 |
| 11-4/11-6 1.32778/1.53347 | 0.43 | 0.57 | 0.39 | 0.52 | 0.80 | 0.80 | 0.05 |
| 11-4/11-7 1.32778/1.67688 | 0.59 | 0.79 | 0.52 | 0.69 | 0.89 | 0.89 | 0.06 |
| 11-4/11-8 1.32778/1.80002 | 0.87 | 1.15 | 0.73 | 0.97 | 1.86 | 1.85 | 0.19 |
| 11-6/11-7 1.53347/1.67688 | 1.37 | 1.38 | 1.31 | 1.31 | 1.11 | 1.12 | 0.03 |
| 11-6/11-8 1.53347/1.80002 | 2.01 | 2.00 | 1.86 | 1.85 | 2.33 | 2.32 | 0.19 |
| 11-7/11-8 1.67688/1.80002 | 1.47 | 1.46 | 1.42 | 1.41 | 2.09 | 2.08 | 0.18 |
| 12-4/12-5 1.27878/1.29777 | 2.30 | 2.28 | 2.28 | 2.26 | 2.67 | 2.67 | 0.49 |
| 12-4/12-7 1.27878/1.59947 | 0.73 | 0.86 | 0.64 | 0.74 | 1.31 | 1.30 | 0.11 |
| 12-4/12-8 1.27878/1.71113 | 2.78 | 3.27 | 2.33 | 2.74 | 4.14 | 4.15 | 0.57 |
| 12-4/12-9 1.27878/1.79710 | 1.62 | 1.89 | 1.33 | 1.55 | 2.89 | 2.87 | 0.70 |
| 12-5/12-7 1.29777/1.59947 | 0.32 | 0.38 | 0.28 | 0.33 | 0.49 | 0.49 | 0.08 |
| 12-5/12-8 1.29777/1.71113 | 1.21 | 1.43 | 1.02 | 1.21 | 1.55 | 1.56 | 0.31 |
| 12-5/12-9 1.29777/1.79710 | 0.71 | 0.83 | 0.58 | 0.69 | 1.08 | 1.08 | 0.31 |
| 12-7/12-8 1.59947/1.71113 | 3.79 | 3.81 | 3.66 | 3.69 | 3.16 | 3.19 | 0.37 |
| 12-7/12-9 1.59947/1.79710 | 2.22 | 2.21 | 2.09 | 2.09 | 2.20 | 2.21 | 0.51 |
| 12-8/12-9 1.71113/1.79710 | 0.58 | 0.58 | 0.57 | 0.57 | 0.70 | 0.69 | 0.18 |
| 13-5/13-8 1.27035/1.66377 | 0.92 | 1.02 | 0.77 | 0.86 | 1.20 | 1.20 | 0.17 |
| 13-5/13-9 1.27035/1.74493 | 1.85 | 2.05 | 1.52 | 1.69 | 1.38 | 1.38 | 0.25 |
| 13-8/13-9 1.66377/1.74493 | 2.02 | 2.01 | 1.97 | 1.96 | 1.15 | 1.15 | 0.22 |
Note. — “Q” refers to Quinet et al. (1996), “NS” refers to Nussbaumer & Storey (1988), and “New” refers to empirical values determined in this work. Wavelengths in air are taken from Quinet et al. (1996).
| Transition | |||
|---|---|---|---|
| 10-1 12566.80 | 4.7410-3 | 4.8310-3 | 4.8310-3 |
| 10-2 13205.54 | 1.3110-3 | 1.3310-3 | 1.3510-3 |
| 10-6 16435.50 | 5.9810-3 | 4.6510-3 | 4.2610-3 |
| 10-7 18093.95 | 1.3210-3 | 1.0310-3 | 1.0710-3 |
| 11-2 12481.9 | 0.3510-3 | ||
| 11-3 12942.68 | 1.9810-3 | 1.9410-3 | 1.9410-3 |
| 11-4 13277.76 | 1.1710-3 | 1.2110-3 | 1.3210-3 |
| 11-6 15334.71 | 3.1210-3 | 2.4410-3 | 1.7410-3 |
| 11-7 16768.76 | 2.4910-3 | 1.9410-3 | 1.6310-3 |
| 11-8 18000.16 | 1.8210-3 | 1.4310-3 | 0.8110-3 |
| 12-4 12787.76 | 2.4510-3 | 2.2510-3 | 2.6610-3 |
| 12-5 12977.73 | 1.0810-3 | 1.0010-3 | 1.0010-3 |
| 12-7 15994.73 | 4.1810-3 | 3.2810-3 | 2.2010-3 |
| 12-8 17111.29 | 1.1810-3 | 0.9210-3 | 0.7210-3 |
| 12-9 17971.04 | 2.1210-3 | 1.6710-3 | 1.0610-3 |
| 13-5 12703.46 | 3.3210-3 | 2.9110-3 | 2.9110-3 |
| 13-8 16637.66 | 4.7510-3 | 3.7310-3 | 2.6810-3 |
| 13-9 17449.34 | 2.4710-3 | 1.9510-3 | 2.3910-3 |
Note. — “Q” refers to Quinet et al. (1996), “NS” refers to Nussbaumer & Storey (1988), and “New” refers to empirical values determined in this work. Wavelengths in air are taken from Quinet et al. (1996).
| Parameter | Units | Inner | Outer | Total |
|---|---|---|---|---|
| vsys (heliocentric) | km s-1 | –38 | ||
| Radial expansion velocity | km s-1 | 120 | 152 | 136 |
| Radius ( and ) | arcseconds | 7.8 | 9.7 | 8.8 |
| Radius ( and ) | log10 cm | 17.3 | 17.4 | 17.35 |
| Dynamic age (R/V) | years | 531 | 524 | 527 |
| Filling factor | 0.2 | |||
| Avg. electron density | cm-3 | 6000 | ||
| H ionization fraction | 0.8-0.95 | |||
| Mass | M⊙ | 0.1 | ||
| Kinetic energy | log10 ergs | 46.3 | ||
| KE/Lt | 0.01 |