THE REVERSE SHOCK OF SNR1987A AT 18 YEARS AFTER OUTBURST11affiliation: Based on observations made at the Clay Telescope of the Magellan Observatory, a joint facility of the Carnegie Observatories, Harvard University, the Massachusetts Institute of Technology, the University of Arizona, and the University of Michigan.
Abstract
We use low-dispersion spectra obtained at the Magellan Observatory to study the broad H emission from the reverse shock of the infant supernova remnant SNR1987A. These spectra demonstrate that the spatio-kinematic structure of the reverse shock can be distinguished from that of the circumstellar ring and hotspots, even at ground-based spatial resolution. We measure a total dereddened H flux of 1.99(0.22)10-13 ergs s-1 cm-2 at an epoch 18.00 years after outburst. At 50 kpc, the total reverse shock luminosity in H is roughly 15 , which implies a total flux of neutral hydrogen atoms across the reverse shock of 8.91046 s-1, or roughly 2.310-3 yr-1. This represents an increase by a factor since 1997. Lyman continuum radiation from gas shocked by the forward blast wave can ionize neutral hydrogen atoms in the supernova debris before they reach the reverse shock. If the inward flux of ionizing photons exceeds the flux of hydrogen atoms approaching the reverse shock, this pre-ionization will shut off the broad Ly and H emission. The observed X-ray emission of SNR1987A implies that the ratio of ionizing flux to hydrogen atom flux across the reverse shock is presently at least 0.04. The X-ray emission is increasing much faster than the flux of atoms, and if these trends continue, we estimate that the broad Ly and H emission will vanish in 7 years.
Subject headings:
circumstellar matter — shock waves — supernovae: individual (SN1987A) — supernova remnants1. INTRODUCTION
The collision between the ejecta of SN1987A and its circumstellar ring is now in full bloom, signaling the birth of the supernova remnant SNR1987A. This interaction was predicted (Luo & McCray 1991; Luo et al. 1994; Chevalier & Dwarkadas 1995; Borkowski et al. 1997) shortly after the discovery of the circumstellar ring. It began about a decade after the outburst with the discovery of the first of many “hot spots” (Sonneborn et al. 1998; Michael et al. 2000; Pun et al. 2002). These hot spots are thought to result when the forward blast wave encounters and transmits radiative shocks into dense protrusions or “fingers” pointing to the interior of the ring. Since then, hot spots have encircled the entire ring (Sugerman et al. 2002).
Behind the blast wave, the expanding supernova debris are decelerated by a reverse shock (e.g., Chevalier 1982). This non-radiative shock is seen as very broad, high-velocity Ly and H emission features in Space Telescope Imaging Spectrograph (STIS) data (Michael et al. 2003, 1998; Sonneborn et al. 1998). This emission, which was predicted by Borkowski et al. (1997), results from the collisional excitation of neutral H atoms from the supernova debris crossing the shock front. Using a series of long-slit STIS spectra, Michael et al. (1998) mapped the geometry of the reverse shock, finding it to reside within roughly 30° of the equator. New ground-based observations reported here, supplemented by additional observations with STIS (Sonneborn et al. 1998; Heng et al., in preparation), show that the broad Ly and H reverse shock emission has increased by a factor 4 since 1997. Meanwhile, the X-ray emission from SNR1987A has brightened at a rapidly accelerating rate (Park et al. 2005). The blast wave interaction with the hot spots now dominates the X-ray emission (Zhekov et al. 2005).
In this Letter we present new spectra from the Magellan Observatory, which demonstrate that we can continue to study the emission from this reverse shock with ground-based telescopes, despite the recent demise of STIS. We also discuss the possibility that the shocked gas will produce sufficient ionizing luminosity to photoionize hydrogen atoms in the supernova debris before they reach the reverse shock, and thereby suppress the broad Ly and H emission.
2. MAGELLAN OBSERVATIONS
We observed SN1987A during the commissioning run of the Low Dispersion Survey Spectrograph-3 (LDSS3) mounted on the Clay Telescope of the Magellan Observatory on the evening of 2005 Feb 24 (Feb 25 UT), almost exactly 18 years after the supernova was first discovered. LDSS3 has an STA0500A 40644064 CCD detector. At red wavelengths it has a pixel scale of 01891.124 Å and an effective spectral resolution of 5 Å (R=1300) with a 08 (4.5 pixel) slit width. During the observations the weather was clear and the seeing was 08. The slit aperture was centered on the supernova and oriented at P.A.=–10, aligned with the minor axis of the equatorial ring. Wavelengths and velocities are measured with respect to the rest wavelengths of the narrow nebular emission along the slit. Airglow lines and emission from the surrounding H ii region were subtracted by fitting the emission from the background sky along the slit.
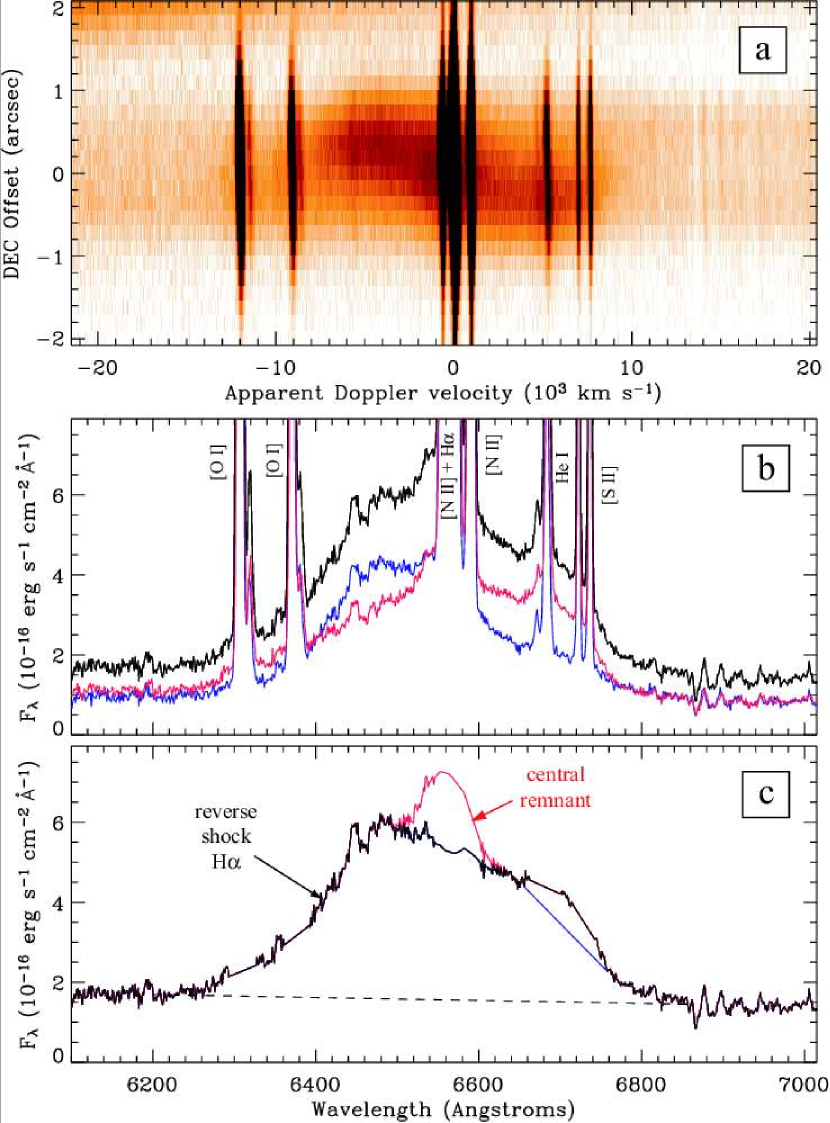
The region of the long-slit spectrum around H resulting from a total exposure time of 900s is shown in Figure 1. In order to flux-calibrate the LDSS3 spectrum in February 2005, we interpolated between the flux measured in 2004 December and 2005 May in HST/ACS images. We used images in the F658N filter, which includes narrow H and [N ii] emission from the circumstellar ring and hot spots. We extracted the flux over the same spatial region centered on the northern half of the ring in both the images and the LDSS spectrum, and summed the flux over the F658N filter bandpass (50 Å) in the spectrum. Tracings of the resulting flux-calibrated spectrum are shown in Figure 1, where we display the total flux within 1″, as well as separate extractions for the northern (blueshifted) and southern (redshifted) sides of the nebula.
In order to isolate the very broad emission from the reverse shock, we interpolated across the narrow nebular emission lines from the ring and hot spots (Figure 1). We also removed the emission hump due to rapidly fading H emission from the central remnant by subtracting a Gaussian profile (had we included this emission, the total flux would have been 6.5% higher). Interpolating across He i 6680 and the red [S ii] doublet was somewhat subjective; we relied on what appeared to be reverse shock emission at 6700 Å between the two sets of lines. This resulted in a red bump in the reverse shock line profile. This is probably the best representation of the true reverse shock emission, and is used for the estimate below. A very conservative estimate made by interpolating linearly from 6660 to 6760 Å (the dotted or blue line in Figure 1) would have resulted in a total flux about 6% less than the value we quote below.
We measure a total H flux for the broad reverse shock component of 1.37(0.15)10-13 ergs s-1 cm-2 on 2005 February 25. This corresponds to the black tracing in Figure 1, integrated from 6200 to 6860 Å, and is continuum-subtracted using the continuum level shown by the straight dashed line in Figure 1. This estimate includes an adjustment of +15% for those parts of the reverse shock on the east and west edges of the ring that are excluded from the aperture. Finally, adopting =0.16 (Fitzpatrick & Walborn 1990) and =3.1, we multiply the observed reverse shock flux by a correction factor of 1.453, to estimate a dereddened broad H flux of 1.99(0.22)10-13 ergs s-1 cm-2.
3. MASS FLUX ACROSS THE REVERSE SHOCK
The total dereddened flux we measure at Earth corresponds to a total luminosity in the broad H line of about 5.631034 ergs s-1 at a distance of 50 kpc, or roughly 15 . From this we can infer the flux of neutral hydrogen atoms across the reverse shock. For each neutral H atom crossing the reverse shock, roughly 1 Ly and 0.21 H photons will be emitted (Michael et al. 2003). Thus, dividing the intrinsic H luminosity by the energy per H photon and multiplying by a factor of 5 gives a total luminosity of hydrogen atoms across the reverse shock of 1046 s-1, or a total hydrogen mass flux of roughly 2.310-3 yr-1. Michael et al. (2003) found that the main emitting surface area of the reverse shock was within 30° of the equator, just inside the nebular ring. To first order, the density of neutral H atoms in the debris prior to crossing the reverse shock is then
where =8.91046 s-1 is the number of hydrogen atoms crossing the reverse shock, is the present radius of the reverse shock, and 18 yr is the time since outburst. Here we have assumed that the supernova debris are in free expansion, so that . Taking the observed velocity km s-1, we find 0.16 pc. This is roughly 80% of the radius of the forward shock, taken to be the radius of the ring. This ratio is close to the theoretically-expected value for self-similar expansion (Chevalier 1982). The H flux we measure implies 60–70 cm-3.
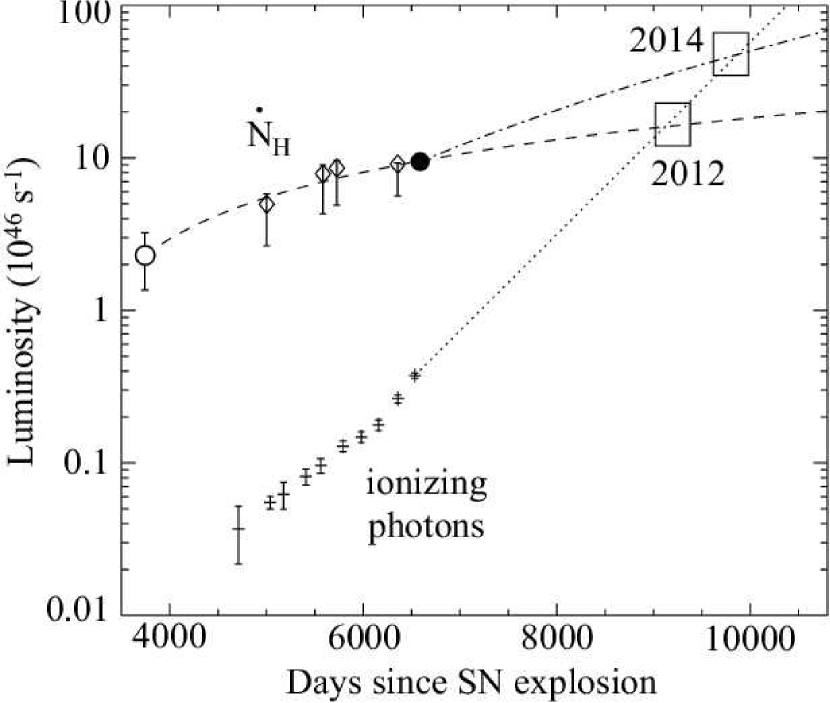
Figure 2 shows the history of as inferred from STIS observations of broad H and Ly since 1997 (Sonneborn et al. 1998; Michael et al. 1998; Heng et al., in prep.) and the present observation. The estimated error bars of the values derived from the STIS observations are large mainly because the corrections for narrow emission lines were substantially greater in the lower dispersion STIS spectra. From Figure 2, we see that has increased by a factor 4 since the first observation of broad Ly from the reverse shock in 1997 (Sonneborn et al. 1998).
4. WILL PREIONIZATION SHUT OFF THE REVERSE SHOCK EMISSION?
The hot shocked gas lying immediately outside the reverse shock surface is a luminous source of ionizing photons, roughly half of which will propagate inward to photoionize hydrogen atoms in the supernova debris before they reach the reverse shock. If the luminosity of these ionizing photons exceeds that of the hydrogen atoms, the broad Ly and H emission will vanish. Will this event take place, and if so, when?
We can estimate the luminosity of ionizing photons from the forward shock of SNR1987A from Chandra X-ray observations. Spectral analysis of the LETG observations (Zhekov et al. 2005, also Zhekov et al. in preparation) shows that a two-shock model with temperatures of 0.51 and 2.7 keV, respectively, gives an excellent fit to the X-ray spectrum at years. For such a model, most of the ionizing photons are EUV photons having energies well below the 0.4 – 10 keV Chandra band. From the two-shock model spectrum, we estimate an inward luminosity of ionizing ( eV) photons of s-1, where we have included a factor of 1.4 to account for the brightening of X-rays that took place between and years, and a factor 0.5 to account for the fact that only half of the ionizing photons will propagate inward. It follows, then, that the ratio of ionizing photon luminosity to hydrogen atom luminosity at years is .
We regard this estimate as conservative because we know that the complex system of shocks in SNR 1987A must have velocities ranging from km s-1 (as observed in the line profiles of the optical hot spots; Pun et al. 2002) to km s-1 (as observed in the X-ray line profiles; Zhekov et al. 2005). We estimated based on the best model fit to the observed X-ray spectrum which requires shocks of and km s-1, respectively. This may be a significant underestimate, because shocks having velocities in the range km s-1 might contribute substantially to but relatively little to the Chandra band.
At present, the X-ray luminosity of SNR1987A is increasing by a factor of 1.7 every year (Park et al. 2005), more rapidly than the luminosity of hydrogen atoms across the shock. If present trends continue, as indicated in Figure 2, should overtake by about 2012 to 2014. This event could occur 1–2 years later if the expanding SN ejecta have a high He abundance, because absorption by He atoms could reduce the effective value of . We regard the prediction in Figure 2 as very conservative, however. As we have suggested, we may have underestimated the value of at 18 years. Moreover, Luo et al. (1994) predicted that, once the blast wave envelops the circumstellar ring, the ionizing luminosity should rise very rapidly to a value s-1. This rapid rise, and the consequent vanishing of the reverse shock emission, could happen anytime during the next several years.
Additional uncertainty arises from the extrapolation of . There are two hydrodynamic scenarios that might bracket its evolution. The first is the self-similar solution describing the expansion of a supernova envelope with density law into a uniform circumstellar medium (Chevalier 1982). In this scenario, the radii of the blast wave and the reverse shock both increase as , and the mass luminosity increases as . We regard this behavior as a probable lower limit to the rate of increase of . But must begin to increase more rapidly in the near future. The blast wave is now overtaking the dense hotspots on the circumstellar ring, and each such encounter will send a reflected shock inward toward the reverse shock. The reflected shocks will eventually merge with the reverse shock and bring it nearly to a halt. Thereafter, , or for a typical value (Eastman & Kirshner 1989). We regard this as a probable upper limit to the future evolution of . These two limiting behaviors of are shown as the dashed curves in Figure 2.
5. DISCUSSION
When the suppression of the broad H emission is seen, it will provide vital insights into the radiation hydrodynamics of the developing SNR. For example, if the suppression occurs early, as we might expect for reasons noted above, it would provide evidence for substantial ionizing radiation from shocks too slow to contribute substantially to the observed X-ray spectrum. Also, we don’t expect the suppression to take place uniformly around the reverse shock. X-ray images (Park et al. 2005) certainly show a substantial amount of structure. Even if the supernova debris have cylindrical symmetry, we would expect the broad H and Ly emission to vanish first near the brighter sources of ionizing radiation (i.e. the bright X-ray knots). With ground-based telescopes, such variation should be evident in the evolution of the line profiles.
Yogi Berra said, “It’s tough to make predictions, especially about the future.” That statement certainly applies to the future evolution of SNR 1987A. Even so, we think that the reverse shock emission is likely to vanish soon enough that it merits continued vigilance with both ground- and space-based telescopes. Yogi Berra also said, “You can observe a lot just by watching.”
References
- (1)
- (2) Borkowski, K., Blondin, J., & McCray, R. 1997, ApJ, 476, L31
- (3)
- (4) Chevalier, R.A. 1982, ApJ, 258, 790
- (5)
- (6) Chevalier, R.A., & Dwarkadas, V.V. 1995, ApJ, 452, L45
- (7)
- (8) Eastman, R.G. & Kirshner, R.P., 1989, ApJ, 347, 771
- (9)
- (10) Fitzpatrick, E.L., & Walborn, N.R. 1990, AJ, 99, 1483
- (11)
- (12) Luo, D., & McCray, R. 1991, ApJ, 379, 659
- (13)
- (14) Luo, D., McCray, R., & Slavin, J. 1994, ApJ, 430, 264
- (15)
- (16) Michael, E., McCray, R., Borkowski, K., Pun, C.S.J., & Sonneborn, G. 1998, ApJ, 492, L143
- (17)
- (18) Michael, E., et al. 2000, ApJ, 542, L53
- (19)
- (20) Michael, E., et al. 2003, ApJ, 593, 809
- (21)
- (22) Park, S. et al. 2005, ApJL, in press (astro-ph/0510442)
- (23)
- (24) Pun, C.S.J., et al. 2002, ApJ, 572, 906
- (25)
- (26) Sonneborn, G., et al. 1998, ApJ, 492, L139
- (27)
- (28) Sugerman, B.E.K., Lawrence, S.S., Crotts, A.P.S., Bouchet, P., & Heathcote, S.R. 2002, ApJ, 572, 209
- (29)
- (30) Zhekov S.A., McCray, R., Borkowski, K.J., Burrows, D.N., & Park, S. 2005, ApJ, 628, L127
- (31)