New Views into High Redshift Star-formation from GOODS
The GOODS-North field centered around the historical Hubble Deep Field-North provides one of the richest multiwavelength datasets compiled, spanning radio to X-ray frequencies, for studying the formation and evolution of galaxies at high redshift. In particular, the unprecedented sensitivity of the Spitzer/GOODS 24m observations allows an unbiased measure of dust-enshrouded star-formation and AGN activity in typical L∗ galaxies rather than the extreme, hyperluminous galaxies which far-infrared surveys detect. We consider a spectroscopically selected sample of 226 galaxies at z1.5 of which 135 are in the redshift range 1.5. Less than 1/4 of galaxies considered here are detected at 24m. They primarily have red UV slopes but consitute about only 20% of the red galaxies in this sample indicating that the red UV colors of the majority of objects is due to an evolved stellar population. Although 24m sources are sparse in number, their combined energy output in the 1.5 range exceeds the combined UV luminosity of the sample by a factor of 30. We also find that AGN, identified by their X-ray to infrared luminosity ratios, account for 10% of the sources considered and contribute less than 30% of the total budget in this redshift range. The infrared luminous galaxies which are increasingly being found at high-z appear to dominate the global energetics of the Universe out to z3 as has previously been predicted.
1 Scientific Motivation
The redshift range 13, corresponding to a cosmic time of 26 Gyr after the Big Bang, encompasses various interesting observational characteristics of galaxy evolution. This includes the peak in the comoving number density of quasars, the dramatic growth in the stellar mass of galaxies and the (1+z)4 evolution in the comoving number density of infrared luminous galaxies as detected by ISOCAM at 15m and SCUBA at 850m. The ultraviolet and infrared pictures of galaxy evolution have not been entirely consistent views over this redshift range with discrepancies arising from the uncertain correction for dust extinction at short wavelengths to the inability of mid- and far-infrared surveys to detect galaxies at the faint end of the luminosity function. After estimates of these corrections have been made, the agreement in the comoving bolometric luminosity density is around a factor of . This obfuscates the fact that estimates of star-formation, AGN activity and stellar mass in individual galaxies do not agree to within an order of magnitude making it difficult to pinpoint the physical trigger for starburst or quasar activity in individual galaxies, the duration of such activity, the relative growth of supermassive black hole mass and stellar mass, and the relative contribution of nucleosynthesis and accretion to the cosmic energy budget over cosmic time.
The Great Observatories Origins Deep Survey (GOODS) has targetted an area of 165 arcmin2 each around the Hubble Deep Field-North and the Hubble Ultra Deep Field in the South with the Hubble/ACS in the BV passbands (Giavalisco et al. 2004) and with Spitzer using the IRAC and MIPS instruments in the 3.624m range (Dickinson et al. 2005; in preparation). Together with the deep Chandra X-ray data (Alexander et al. 2003), radio observations with the VLA and ground-based imaging and spectroscopy from ESO, NOAO, Keck and Subaru, the two GOODS-fields yield one of the deepest, most homogeneous, publicly available data sets compiled to study the different facets of galaxy evolution over a wide redshift range.
I present results from a multiwavelength study of the properties of 226 galaxies in the GOODS-N field with spectroscopic redshifts greater than 1.5. The spectroscopic selection is the primary selection effect introduced into these results since specific objects were targetted for their pre-Spitzer characteristics. For example, the sample includes Chandra X-ray sources (Barger et al. 2002), SCUBA 850m sources (Chapman et al. 2005) and objects detected in the deep VLA 1.4 GHz survey (Richards 2000 and Morrison et al. 2005). In addition, the vast majority of redshifts were obtained from the Treasury Keck Redshift Survey (TKRS; Wirth et al. 2004) which targetted a magnitude limited sample with R mag. Broadly speaking, this biases the results presented here towards AGN and strong emission line objects which can be alleviated in the future as spectroscopic redshifts for the entire GOODS sample becomes available.
2 Properties of the Sample and AGN fraction
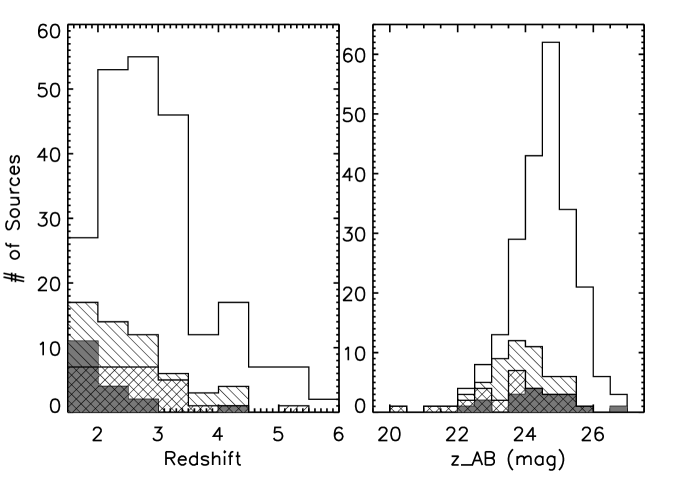
The galaxies selected here have spectroscopic redshifts of . Their apparent magnitudes span the mag range. The 24m detected sources have a median of 23.8 mag, about 0.8 mags brighter than the median of the entire sample. X-ray sources account for 12.8% (29/286) of the sample. The surface density of X-ray sources averaged over the entire GOODS-N field is about 1:16 relative to MIPS 24m sources and 1:110 relative to 3.6m selected sources at GOODS depths. The relatively high X-ray fraction here is mostly attributable to the spectroscopic bias and partly to the greater X-ray sensitivity and thereby higher X-ray source density in the central region of the GOODS field.
To determine the contribution of AGN to the luminosity of the sources considered here, we calculated the ratio of infrared (8-1000m) luminosity to X-ray luminosity, LIR/LX and compared this with the X-ray photon index (). The infrared luminosity is derived from the 24m flux and redshift using two approaches. One is to use the library of Chary&Elbaz (2001) and Dale&Helou (2002) template SEDs of star-forming galaxies and identify the template which provides the closest match to the 24m flux at the redshift of the source. The other is to use a typical obscured AGN SED i.e. Mrk231 and scale it to fit the 24m flux of the source. Typically, since the SED is flatter in Fν for an AGN the bolometric correction from the Mrk231 SED is smaller than that for the starburst SEDs resulting in LIR values which differ by a factor of 7. A significant source of uncertainty in the redshift range under discussion is the presence of silicate absorption at rest-frame 9.7m which would suppress the observed 24m flux when the source is in the redshift range . Since the template SEDs do not have any strong intrinsic silicate absorption built in, they will underestimate the bolometric luminosity of those sources if silicate absorption is present.
For AGN which might be X-ray undetected because of Compton-thick column densities, we assess the presence of an AGN from the IRAC colors of the sources (e.g. Lacy et al. 2004). We do not expect to find such sources in this sample because of the spectroscopic selection effects. We find that application of the IRAC color-color cut defined in Lacy et al. (2004) or Stern et al. (2005) results in the selection of 31 non X-ray detected sources and 13 X-ray detected sources. 57% of the non X-ray sources are detected in the 24m while if they were mostly Compton-thick AGN, they should all have been 24m detected. All but 9/31 have derived LIR/LX limits that are 100. The spectroscopic redshifts of these source are in the range . In this redshift range, for typical AGN luminosities, the X-ray column densities should be cm-2 for the sources to be undetected in the Chandra data and even the most optimistic models for the hard X-ray background indicate that such sources contribute at most 20% of the background. Thus, we conclude that the IRAC color-color AGN diagnostics derived from shallow surveys, when applied to deeper IRAC datasets, have a high rate of contamination from distant starburst galaxies as the 1.6m peak of the stellar SED moves through the IRAC passbands.
As a result, to derive the AGN fraction in our sample, we consider AGN to be sources which are hard X-ray detected and with LIR/LX values . We find that of the 29 X-ray detected sources, only about 12 (5.3%) of these are AGN dominated with X-ray luminosities in the range 1043-45 ergs/s. Objects which have 100LIR/L1000 are assumed to be transition objects (5.8%) with increasing contribution from star-formation while all the remaining objects (89%) are assumed to be starburst dominated.
We find the total contribution to the UV light from AGN and transition objects in this sample is 31012 L⊙. After applying a correction based on the UV-slope, this value is enhanced to 1.61014 L⊙ while the derived LIR for the 24m detected objects is 81013 L⊙. The contribution from AGN is 45% while transition objects account for 55%. The dust correction factor to the UV luminosity for the AGN in this sample is therefore about 30 and in reasonable agreement between the 24m and UV-slope estimates.
3 High-redshift Starbursts
3.1 Star-formation Rates
We measure the star-formation rates of the majority of objects which are starburst dominated using the ultraviolet continuum (LUV) and the derived infrared luminosity (LIR) from the 24m flux. In the 8 cases where the source also has an 850m detection, the LIR was calculated by simultaneously fitting the 24m and 850m flux with the template SEDs. We derive an extinction correction from the ultraviolet slope using the prescription of Meurer et al. (1999) for comparison with the observed infrared emission. We find that 24m sources are preferentially redder in their E(B-V) colors but that not all red sources are detected at 24m. The median E(B-V) colors derived from the UV slope for galaxies at 1.5 is 0.18 mag while those of the 24m detected starburst population is 0.32 mag. Of the galaxies which are redder than the median, only about 20% of the objects are detected at 24m. This seems to suggest that on an individual galaxy basis, the UV-slope technique seems to overpredict the dust correction, most likely a result of the age-extinction degeneracy whereby the steep UV-slope of an evolved stellar population is attributed to reddening.
To assess if the UV-slope accurately measures the dust correction in the reddened objects, we plot the corrected star-formation rate derived from the UV and the infrared (Figure 2). We find that for typical infrared luminous galaxies with L L⊙, the agreement between the UV-slope corrected SFR and the 24m derived SFR is very good. However, as we move towards more luminous systems which probably are powered by optically thick starbursts, there is a systematic divergence in the sense that the UV-slope underestimates the bolometric luminosity and thereby the star-formation rate.
In terms of global averages, the total UV luminosity of these objects is 3.61012 L⊙, while the integrated IR luminosity of the 24m detected sources, which constitute 20% of the starbursts, is 7.61013 L⊙. This implies that the dust correction factor for this sample is about 20 while the correction from the UV-slope is more than an order of magnitude larger. Including the transition objects classified from the previous section as star-forming objects boost the luminosity from the 24m detected sources to 1.21014 L⊙. It should be emphasized that the large correction factors stated here are not a correction to the co-moving UV-luminosity density in this redshift regime, which can be no larger than a factor of 3 (Chary&Elbaz 2001), but rather an illustration of the difficulties associated with deriving global SFR from UV-slope corrected densities in this sample of objects.
3.2 Physical Properties
We used the multiband photometry afforded by GOODS to measure the physical properties of the galaxies as a function of their star-formation rate. We fit Bruzual-Charlot SEDs to the photometry, using a salpeter IMF, and solar metallicity template while varying the age of the starburst, mass and internal extinction. We find that there is no apparent correlation between the AV derived from the template fits and the detection of 24m flux from the objects. However, we find that infrared luminous starbursts appear to have higher specific star-formation rates than normal galaxies (Figure 3). This is possibly an evolutionary effect in that galaxies having higher stellar masses preferentially occur in massive dark matter halos where the distribution of gas is more strongly concentrated towards the nucleus. This results in a a larger frequency of optically thick star-forming regions which reprocess the bulk of the UV flux into the far-infrared. As a result, there is practically no change in the observed UV slope (which arises from optically thin regions) with increasing far-infrared flux.
4 Conclusions
Using the luminosity calculated here, we can estimate the contribution from AGN and starbursts to the total energy budget at . We find for our sample, the AGN contribution to the total luminosity density is about 20-30%, depending on the fraction of transition objects that are classified as starbursts or AGN. This is likely to be an upper limit due to the bias in this spectroscopic sample. For the starbursts, we find that the slope of the UV-continuum provides a reasonable indicator as to which galaxies are dusty. However, only about 20% of red galaxies in this sample are detected at 24m implying that a red UV-slope does not necessitate the presence of dust. Star-formation rates derived from the UV continuum, are almost always underestimates but corrections derived from the UV-slope are inaccurate at ULIG luminosities. Furthermore, because of the age-extinction degeneracy, the UV-slope tends to overcorrect the SFR for individual galaxies. Only about 25% of galaxies in this sample show thermal dust emission but their combined luminosity exceeds that of all UV-selected field galaxies implying that dust plays a dominant role in high-z star-formation.
Acknowledgements
This paper would not be possible without key contributions from various members of the GOODS team who are gratefully acknowledged. Support for this work, part of the Spitzer Space Telescope Legacy Science Program, was provided by NASA through an award issued to the Jet Propulsion Laboratory, California Institute of Technology under NASA contract 1407.


References
References
- [1] Alexander, D., et al., 2003, AJ, 126, 539
- [2] Barger, A., et al. 2002, AJ, 124, 1839
- [3] Chary, R., & Elbaz, D., 2001, ApJ, 556, 562
- [4] Chapman, S. C., et al. 2005, ApJ, 622, 772
- [5] Dale, D. & Helou, G., 2002, ApJ, 576, 159
- [6] Giavalisco, M., et al., 2004, ApJ, 600, L93
- [7] Lacy, M., et al., 2004, ApJS, 154, 166
- [8] Meurer, G., et al. 1999, ApJ, 521, 64
- [9] Morrison, G., et al., 2005, ApJ, in preparation
- [10] Richards, E., 2000, ApJ, 533, 611
- [11] Stern, D., et al., 2005, ApJ, astro-ph/0410523
- [12] Swinbank, A. M., et al., 2004, ApJ, 617, 64
- [13] Wirth, G. D., et al., 2004, AJ, 127, 3121