Spitzer Constraints on the Galaxy Lensed by Abell 370
Abstract
We report on Spitzer IRAC observations of the spectroscopically confirmed lensed Ly emitting source HCM 6A which was found behind the cluster Abell 370. Detection of the source at 3.6 and 4.5 m, corresponding to rest-frame optical emission, allows us to study the stellar population of this primeval galaxy. The broadband flux density at 4.5 m is enhanced compared to the continuum at other wavelengths, likely due to the presence of strong H in emission. The derived H line flux corresponds to a star-formation rate of M☉ yr-1, more than an order of magnitude larger than estimates from the ultraviolet continuum and Ly emission line. The dust extinction required to explain the discrepancy is mag. The inference of dust at such high redshifts is surprising and implies that the first epoch of star-formation in this galaxy occurred at .
1 Introduction
The end of the “Dark Ages”, sometime between redshifts of 650, is signalled by the formation of the first galactic and proto-galactic structures. The detection and characterization of these early objects is essential for identifying the sources of re-ionization and revealing if galaxies in the early Universe build their stellar mass primarily through monolithic collapse or hierarchical merging. Potential sources responsible for re-ionization include supermassive black holes in bright QSOs, violently star-forming galaxies and exotic but hypothetical Population III stars thought to be of mass M☉. However, QSOs have been effectively ruled out based on their luminosity function at determined from the Sloan Digitized Sky Survey (Fan et al., 2002) and deeper, narrower field of view quasar surveys (Willott et al., 2005; Mahabal et al., 2005). Star-forming galaxies are likely to dominate the re-ionization only if the faint end slope of the UV luminosity function at is steeper than the slope at (Yan & Windhorst, 2004). However, of all the candidates identified in various survey fields (e.g., Bouwens et al., 2004; Dickinson et al., 2004; Stanway et al., 2005), the only spectroscopically confirmed sources are the emission line galaxies (e.g., Rhoads et al., 2004; Stern et al., 2005; Taniguchi et al., 2005). The first spectroscopically confirmed galaxy at was HCM 6A (), discovered by Hu et al. (2002) in a narrowband imaging survey of lensing galaxy cluster fields and confirmed through the detection of redshifted Ly. The source is magnified by the foreground cluster Abell 370 by a factor of 4.5 and appears to be fragmented into two components separated by in the North-East/South-West direction. The Ly line and UV continuum luminosity correspond to a star-formation rate (SFR) of M☉ yr-1. This does not include any corrections for dust, since the existence of dust and absorption are quite uncertain from the purely rest-frame ultraviolet data previously obtained for HCM 6A.
In this Letter we report on the Spitzer detection of HCM 6A using the Infrared Array Camera (IRAC; Fazio et al., 2004). IRAC, due to its exquisite sensitivity, has been successful in detecting the rest-frame optical emission from candidate and confirmed sources in the GOODS fields (e.g., Eyles et al., 2005; Mobasher et al., 2005; Yan et al., 2005) and in fields which are lensed by massive clusters (Egami et al., 2005). These measurements provide a better constraint on the physical properties of high redshift galaxies such as the stellar mass, age of the stellar population and internal dust extinction.
2 Observations and Reductions
The Spitzer/IRAC observations were undertaken as part of guaranteed time observations. Data at 3.6 m and 5.8 m were taken with 12 dithered 200 sec exposures, for a total on-source integration time of 2400 sec. At 4.5 m and 8.0 m, 18 dithered 200 sec exposures were used for a total on-source integration time of 3600 s.
We made minor modifications to the pipeline-processed data. Beginning with the basic calibrated data from the IRAC pipeline (version S11.0.2), we corrected the “pulldown” and “muxbleed” associated with well-exposed pixels in IRAC channels 1 (3.6 m) and 2 (4.5 m). The muxbleed corrections were empirically derived from a large set of IRAC data taken with the same exposure time. We then reran the MOPEX mosaicing software with modified cosmic-ray rejection parameters and an output pixel scale reduced by 50% to improve the resolution of the final images. The spatial resolution in the combined mosaics is FWHM. The sensitivity of our final mosaics was measured by calculating the standard deviation between the flux values in 18 radius beams placed along random blank points in the mosaic. The resultant 1 point source detection limits, corrected for beam size, were 0.4, 0.3, 0.9 and 1.0 Jy at 3.6, 4.5, 5.8 and 8.0 m, respectively. The expected background-limited point source sensitivity values are 0.14, 0.23, 1.85 and 1.93 Jy for medium background. The difference between the two sets of values, especially at the shortest wavelengths, is mostly attributable to confusion noise and partly due to the correlated noise between pixels.
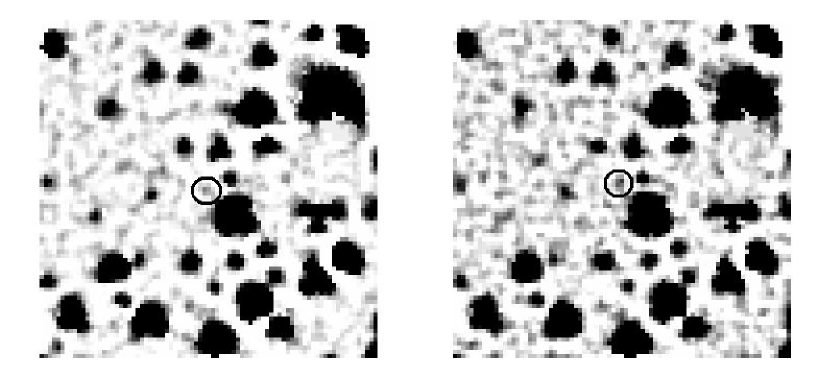
The source (HCM 6A) is detected in the 3.6 and 4.5 m mosaics (Figure 1). At the spatial resolution of IRAC, the neighboring, bright galaxy 6″ to the southwest () could be contaminating the photometry of the high-redshift source. We first attempted to perform the photometry on HCM 6A using a priors-based deblending technique whereby we use the position of sources in high resolution Hubble Space Telescope WFPC2 images of the field, convolve them with the Spitzer point spread function (PSF) and subtract them out. However, because of the extended morphology of the foreground galaxy, likely morphological -corrections, and the position dependence of the IRAC PSF, the residuals from this technique were found to be rather large and unsuitable. Prior-based deblending is most effective when sources are unresolved.
We then adopted an alternate approach. After measuring aperture-corrected fluxes of Jy and Jy at 3.6 and 4.5 m, respectively, for HCM 6A, we attempted to estimate the contribution of the foreground galaxy to these values. We derived surface brightness profiles of the bright galaxy in expanding annuli, fit those with an analytical function and extrapolated the function to assess the surface brightness of the galaxy at the location of HCM 6A. We find that the the maximal contribution from the galaxy to the flux of HCM 6A is Jy at 3.6 m and 4.5 m and 1.7 Jy at 8.0 m, depending on the functional form of the surface brightness profile. We subtract an average value of Jy and Jy at 3.6 and 4.5 m, respectively, for the galaxy contribution and adopt flux values of Jy and Jy at 3.6 and 4.5 m, respectively, for HCM 6A.
At 5.8 m we provide a upper limit of 0.9 Jy while at 8.0 m there is a hint of a positive flux, Jy. Given the noise properties of the mosaic and blending from the foreground, bright galaxy, we classify the 5.8 m and 8.0 m values as 1 upper limits, the 3.6 m value as a detection, and the 4.5 m value as a detection. The faintness of the source and detectability at the limits of the IRAC instrument, despite a lensing amplification factor of 4.5, illustrate the difficulty associated with a detailed study of the galaxy population.
To assess the reliability of the source and the photometry, we selected a random 2/3 of the 4.5m frames and re-generated the mosaic, repeating the process 3 times. The photometry was performed on each of these mosaics, with the difference between the values yielding a systematic uncertainty which is factored into the aforementioned flux density estimates. We also investigated the effect of modifying the mosaicing parameters, which included making the outlier rejection threshold more stringent. We find the photometry to be insensitive to these parameters.
Finally, we briefly note that the peak of the 4.5 m emission is offset mostly to the north from the peak of the 3.6 m emission by . This is less than the FWHM of the PSF at these wavelengths, but is much greater than the 02 relative astrometric accuracy between the IRAC images in the various channels, as measured from the scatter in the centroid of bright sources. Furthermore, the peak of the 3.6 m emission is well aligned with the continuum source detected by Hu et al. (2002). This offset is most likely attributable to the extended nature of the Ly- source. It is possible that one of the two optical components of HCM 6A is dominating the H emission, affecting the 4.5 m morphology and centroiding. Regardless, since the separation of the two components is less than the IRAC PSF, we only consider emission from the entire ensemble.
3 Interpretation
Figure 2 shows the spectral energy distribution (SED) of HCM 6A at all detected wavelengths including the ground-based photometry from Hu et al. (2002). Since the Balmer break for a galaxy at falls shortward of the IRAC 3.6 m filter and the source is known to have a strong Ly emission line, we interpret the upturn in the SED at 4.5 m flux to be due to the presence of H which, at a redshifted wavelength of 4.96 m, falls within the IRAC 4.5 m passband. The presence of Ly suggests that the object is a young star-forming galaxy. We tentatively assume that the continuum follows a simple spectrum and fit it to the flux density at wavelengths which are not contaminated by line emission, i.e. , , and 3.6 m. Extrapolating this continuum to 4.5 m yields a continuum level of Jy. The continuum is slightly decreased to Jy if the -band photometric point is included but can be as high as Jy if the continuum slope is red due to dust or an evolved stellar population. These estimates are about a factor of 23 below the measured flux of Jy at 4.5 m. We attribute the difference to the presence of H+[N II] emission. The resultant combined line luminosity is in the range erg s-1 which factors in the uncertainty in the continuum level as well as the photometry. When corrected for the lensing magnification factor of 4.5 and a canonical [N II]/H ratio of 0.3 (Tresse et al., 1999), this implies a H line luminosity of erg s-1 and a resultant star-formation rate of 14090 M☉ yr-1 using the Kennicutt (1983) SFR relation. The implied rest-frame H equivalent width of 0.2 m is not unreasonable for young stellar populations (c.f., Leitherer & Heckman, 1995). Typical systematic uncertainties are about a factor of 4, arising from the uncertainty in the lensing magnification factor (2) and the [N II]/H ratio which can span the 0.1-1 range. The derived SFR is about an order of magnitude higher than that derived from the UV continuum (Hu et al., 2002). Assuming this is a result of dust, the implied extinction is 1.0 mag. If this interpretation is correct, the presence of dust is remarkable, requiring a significantly evolved stellar population to already be in place by redshift . Apparently, even at the highest redshifts currently probed, we are still not identifying primordial stellar populations. This is consistent with spectroscopic studies of the most distant galaxies. He II 1640 Å, predicted to be a major coolant in very low metallicity systems and thus a good tracer of Population III stars, remains undetected in stacked spectra of multiple, high-redshift galaxies (Dawson et al., 2004) or in ultradeep spectra of individual galaxies (Nagao et al., 2005). The likely implication of this dust detection and the He II non-detections is that significant star formation occurs at redshifts .
We next attempted to fit the photometric measurements of the galaxy with a Bruzual & Charlot (2003) template SED to constrain its mass. Templates with metallicity values of 0.02 solar and with a Salpeter IMF were adopted. The IMF at these redshifts is a significant source of uncertainty since a top-heavy IMF could produce the same emission line flux with a considerably lower SFR. The lensing factor of 4.5 was removed from the flux estimates. The uncertainty in the lensing magnification factor does not dominate the uncertainties in the SED fitting which are driven by the large photometric errors. The 4.5 m photometry was replaced by the continuum level after the H+[N II] lines were subtracted. We find that the best fit template corresponds to a stellar mass of M☉, an instantaneous starburst age of 5 Myr, and mag. The low resultant age is consistent with the strong emission lines in this galaxy although the mass estimate is uncertain to 10.
An alternate interpretation is that the flux in all passbands is dominated by the continuum emission rather than the line emission. Repeating the Bruzual-Charlot fits results in a galaxy with mass in stars of M☉, a starburst age of 30 Myr and mag. Template fits with extinction forced to zero, ages of 700 Myr and masses of M☉ also provide reasonable fits to the photometry (Figure 2). However, the formal, reduced estimate for these fits is about 23 times higher than fits with the H contribution subtracted.
The remarkable agreement between the extinction values independently derived from the ratio of H to Ly emission lines and the fit to the broadband photometry, therefore leads us to conclude that our first hypothesis, that the 4.5 m flux is dominated by H in emission and that the galaxy has an intrinsic extinction of mag, is more amenable to the data.
4 Discussion
We assess the possibility that the unusual photometry of this narrow-line Ly emitter (LAE) could be due to the presence of an AGN. A 100ks Chandra X-ray observation of this field does not reveal the presence of an X-ray counterpart for HCM 6A. Based on the data presented in Barger et al. (2001) and Bautz et al. (2000), the lensing uncorrected limiting flux is 10-15 erg cm-2 s-1 between 2-7 keV and 310-16 erg cm-2 s-1 between 0.5-2 keV. This translates to FX/F which is small but still more than a factor of 5 larger than the range of flux ratios seen for the Sloan quasars at these redshifts (Brandt et al., 2002). The Ly to X-ray flux ratio limit for HCM6A is . This limit is within the range of high redshift Type II QSOs. However, deep X-ray observations of the narrow-line Ly emitter population at yield similar detection limits for individual objects. X-ray stacking of these 101 LAEs yields a non-detection which is times higher than the ratio for Type II QSOs implying that less than 5% of these objects could have AGN (Wang et al., 2004). Since HCM6A is very similar in properties to the LAEs, we infer that it too does not host an AGN.
In Figure 3, we compare the photometric properties of HCM 6A discussed in this paper with other candidates from Egami et al. (2005) and Mobasher et al. (2005). HCM 6A is the only one of these sources with detected Ly and with a spectroscopically confirmed redshift. The derived ages of the stellar population for the other sources are much larger, spanning Myr, while HCM 6A spans Myr, albeit with large uncertainties due to the lower flux density and correspondingly lower signal to noise. The mass derived for the Egami et al. (2005) galaxy is very similar to HCM 6A while the estimate of the mass for the Mobasher et al. (2005) galaxy is three orders of magnitude larger. The range of masses and ages spanned at suggests that the growth of galaxies occurs along different evolutionary channels, whereby some galaxies undergo monolithic collapse, forming the bulk of their stars in a single burst at very high redshift, while others, like HCM 6A, build their stellar mass in the hierarchical merging scenario.
If HCM 6A is typical of the emission line galaxy population as seems to be the case, reddening could explain the sharp decrease in the cosmic star-formation rate seen at by Stanway et al. (2004), Bouwens et al. (2004) and Taniguchi et al. (2005) relative to the extinction corrected values of Giavalisco et al. (2004). HCM 6A has a derived dust extinction of mag, corresponding to of 2.6 mag. This would boost the star-formation rate of M☉ yr-1 Mpc-3 derived by Taniguchi et al. (2005) by an order of magnitude. Dust is predominantly formed in the shells of red giant stars which would barely have sufficient time to evolve when the age of the Universe is 850 Myr. The implication is that the first epoch of star-formation in HCM 6A, occured at . Furthermore, if dust reddening were an unexpectedly significant factor at , the re-ionization of the IGM could be accounted for by the luminous end of the star-forming galaxy population without resorting to a steep faint end slope. Measures of dust extinction in a larger sample of emission-line galaxies can test this hypothesis and is currently under investigation.
References
- Barger et al. (2001) Barger, A., Cowie, L. L., Bautz, M. W., Brandt, W. N., et al. 2001, AJ, 122, 2177
- Bautz et al. (2000) Bautz, M. W. et al. 2000, ApJ, 543, 119
- Bouwens et al. (2004) Bouwens, R. J. et al. 2004, ApJ, 606, L25
- Brandt et al. (2002) Brandt, W. N. et al. 2002, ApJ, 569, L5
- Bruzual & Charlot (2003) Bruzual, G. & Charlot, S. 2003, MNRAS, 344, 1000
- Dawson et al. (2004) Dawson, S. et al. 2004, ApJ, 617, 707
- Dickinson et al. (2004) Dickinson, M. et al. 2004, ApJ, 600, 99
- Egami et al. (2005) Egami, E. et al. 2005, ApJ, 618, L5
- Eyles et al. (2005) Eyles, L., Bunker, A., Stanway, E., Lacy, M., Ellis, R., & Doherty, M. 2005, MNRAS, in press (astro-ph/0502385)
- Fan et al. (2002) Fan, X. et al. 2002, AJ, 123, 1247
- Fazio et al. (2004) Fazio, G. G. et al. 2004, ApJS, 154, 10
- Giavalisco et al. (2004) Giavalisco, M. et al. 2004, ApJ, 600, L103
- Hu et al. (2002) Hu, E. M., Cowie, L. L., McMahon, R. G., Capak, P., Iwamuro, F., Kneib, J.-P., Maihara, T., & Motohara, K. 2002, ApJ, 568, L75
- Kennicutt (1983) Kennicutt, R. 1983, ApJ, 282, 54
- Leitherer & Heckman (1995) Leitherer, C. & Heckman, T. M. 1995, ApJS, 96, 9
- Mahabal et al. (2005) Mahabal, A., Stern, D., Bogosavljević, M., Djorgovski, S. G., & Thompson, D. 2005, ApJ, submitted
- Mobasher et al. (2005) Mobasher, B. et al. 2005, ApJ, in press
- Nagao et al. (2005) Nagao, T., Motohara, K., Maiolino, R., Marconi, A., Taniguchi, Y., Aoki, K., & Shioya, Y. 2005, ApJ, in press (astro-ph/0508443)
- Rhoads et al. (2004) Rhoads, J. E., Xu, C., Dawson, S., Dey, A., Malhotra, S., Wang, J. X., Jannuzi, B. T., Spinrad, H., & Stern, D. 2004, ApJ, 611, 59
- Stanway et al. (2004) Stanway, E. R., Bunker, A. J., McMahon, R. G., Ellis, R. S., Treu, T., & McCarthy, P. J. 2004, ApJ, 607, 704
- Stanway et al. (2005) Stanway, E. R., McMahon, R. G., & Bunker, A. J. 2005, MNRAS, 359, 1184
- Stern et al. (2005) Stern, D., Yost, S., Eckart, M., Harrison, F., Helfand, D., Djorgovski, S. G., Malhotra, S., & Rhoads, J. E. 2005, ApJ, 619, 12
- Taniguchi et al. (2005) Taniguchi, Y. et al. 2005, PASJ, 57, 165
- Tresse et al. (1999) Tresse, L., Maddox, S., Loveday, J., & Singleton, C. 1999, MNRAS, 310, 262
- Wang et al. (2004) Wang, J. X., Rhoads, J. E., Malhotra, S., Dawson, S., Stern, D., Dey, A., Heckman, T. M., Jannuzi, B. T., Norman, C. A., & Spinrad, H. 2004, ApJ, 608, 21
- Willott et al. (2005) Willott, C. J., Delfosse, X., Forveille, T., Delorme, P., & Gwyn, S. D. J. 2005, ApJ, in press (astro-ph/0507183)
- Yan & Windhorst (2004) Yan, H. & Windhorst, R. A. 2004, ApJ, 600, L1
- Yan et al. (2005) Yan, H. et al. 2005, ApJ, in press (astro-ph/0507673)