SF2A 2005
DETECTING CHAOTIC AND ORDERED MOTION IN BARRED GALAXIES
Abstract
A very important issue in the area of galactic dynamics is the detection of chaotic and ordered motion inside galaxies. In order to achieve this target, we use the Smaller ALignment Index (SALI) method, which is a very suitable tool for this kind of problems. Here, we apply this index to 3D barred galaxy potentials and we present some results on the chaotic behavior of the model when its main parameters vary.
1 Introduction
The Smaller ALignment Index (SALI) (Skokos 2001; Skokos et al. 2004) or, as elsewhere called, Alignment Index (AI) (Voglis et al. 2002), can distinguish between chaotic and ordered motion in dynamical systems. In order to compute the SALI for a given orbit, one has to follow the time evolution of the orbit itself and of two deviation vectors and , which initially point in two different directions. At every time step the two deviation vectors are normalized and the SALI is then computed as:
| (1) |
The SALI for a chaotic trajectory tends to zero, while for a regular one it fluctuates around a positive number.
2 Discussion of the applications and the results in 3 dof Ferrers
We apply the method to a 3D Ferrers potential which consists of the superposition of a Miyamoto sphere, a Plummer disc and a Ferrers bar.


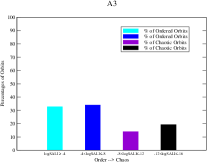
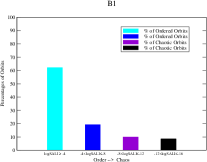
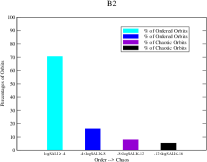
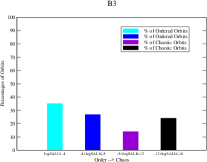
In figure 1 we present percentages of chaotic, intermediate and
regular trajectories, where we vary the mass of the bar component
(panels A3-B3) and the length of the short -axis (panels A2-B2)
of the initial models A1 and B1. The two rows differ in the way we
give the 27000 initial conditions. For the A1, we give initial
conditions in the plane with
and for the B1, in the plane with
. By comparing the results, we see that the
increase of the bar mass causes more chaotic behavior in both cases
(panels A3, B3). This confirms the results by Athanassoula et al.
(1983) in 2 dof. On the other hand, it is obvious that when the bar
is thicker, i.e. the length of the -axis larger, the system gets
more regular. We also, investigated how the pattern speed of the bar
affects the system and found that the percentage of the regular
orbits is greater in slow bars.
Acknowledgements. Thanos Manos was partially supported by Karatheodory graduate student fellowship No B395 of the University of Patras and by Marie - Curie fellowship No HPMT-CT-2001-00338.
References
- [1] Athanassoula, E., et al., 1983, Astr. Astroph. 127, 349
- [2] Skokos, Ch., 2001, J. Phys. A: Math. Gen., 34, 10029
- [3] Skokos, Ch., et al, 2004, J. Phys. A, 37, 6269
- [4] Voglis, N., et al., 2002, Mon. Not. R. Astr. Soc. 337, 619