Low Mass X-ray Binaries in 6 Elliptical Galaxies:
Connection to Globular Clusters
Abstract
We present a systematic study of the low mass X-ray binary (LMXB) populations of 6 elliptical galaxies, aimed at investigating the detected LMXB globular cluster (GC) connection. We utilize Chandra archival data to identify 665 X-ray point sources and HST archival data supplemented by ground observations to identify 6173 GCs. Applying rigorous X-ray and optical photometry and conservative matching criteria, we associate 209 LMXBs with red GC (RGC) and 76 LMXBs with blue GCs (BGC), while we find no optical GC counterpart for 258 LMXBs. This is the largest GCLMXB sample studied so far.
We confirm previous reports suggesting that the fraction of GCs associated with LMXBs is times larger in RGCs than in BGCs, indicating that metallicity is a primary factor in the GCLMXB formation. While as already known, the brighter (and bigger) GCs have a higher probability to host LMXBs, we find that this optical luminosity (or mass) dependency is stronger in RGCs than in BGCs. We also find that GCs located near the galaxy center have a higher probability to harbor LMXBs compared to those in the outskirts. The radial distributions of GCLMXBs (for both RGC and BGC) are steeper than those of the whole optical GC sample, but consistent with those of the optical halo light, suggesting that there must be another parameter (in addition to metallicity) governing LMXB formation in GCs. This second parameter must depend on the galacto-centric distance. One possibility is a galacto-centric distance dependent encounter rate.
We find no statistically significant difference in the X-ray properties (shape of X-ray luminosity function, distribution, X-ray spectra) among RGCLMXBs, BGCLMXBs and fieldLMXBs. The similarity of the X-ray spectra of BGCLMXBs and RGCLMXBs is inconsistent with the irradiation-induced stellar wind model prediction of more absorbed X-ray spectra in BGCLMXBs than in RGCLMXBs. The similarity of the X-ray luminosity functions (XLFs) of GCLMXBs and fieldLMXBs indicates that there is no significant difference in the fraction of BH binaries present in these two populations, in contrast to Galactic LMXBs where BH binaries are not found in GCs. The similar X-ray properties as well as the similar radial distributions of GCLMXBs and fieldLMXBs cannot constrain the hypothesis that all LMXBs were formed in GCs.
1 Introduction
Chandra observations of nearby early-type galaxies have shown that a large fraction (20-70%) of LMXBs are associated with GCs (e.g., Sarazin, Irwin, & Bregman 2001; Angelini, Loewenstein, & Mushotzky 2001; Kundu, Maccarone, & Zepf 2002; Minniti et al. 2004; and Jordan et al. 2004; see also an archival study by Sarazin et al. 2003 and a recent review by Verbunt & Lewin 2005). Moreover, a study of LMXBs near the center of NGC 4472 showed that the metal-rich red GCs (RGCs) are more likely by a factor of to harbor LMXBs than blue GCs (BGCs) (Kundu, Maccarone, & Zepf 2002). This preferred association of LMXBs with metal-rich GCs (but with some variations among galaxies) was later confirmed by Sarazin et al. (2003) and Jordan et al (2004), indicating that metal abundance plays a key role in LMXB formation; a similar trend was also known in the Milky Way (Grindlay 1993; Bellazzini et al. 1995). Several binary formation/evolution scenarios have been discussed to explain these results (e.g., Grindlay 1993; Bellazzini et al. 1995; Maccarone, Kundu, & Zepf 2004; Ivanova 2005); however, it is still unclear why metallicity plays such an important role in LMXB formation and what causes the observed galaxy to galaxy variations in the fraction of LMXBs associated with RGCs and BGCs.
The LMXB GC association is particularly intriguing, because the high stellar density near the center of GCs may trigger the formation of binaries effectively by either three-body process or tidal capture. These binaries would then evolve into LMXBs, as first suggested by Grindlay & Hertz (1985) for the Milky Way. Given the larger density of GCs in elliptical galaxies (Harris, 1991), this mechanism has been recently reproposed (Sarazin, Irwin, & Bregman, 2001; White, Sarazin, & Kulkarni, 2002). The observational evidence is, however, ambiguous. The majority of LMXBs are not directly connected to GCs. The fieldLMXBs might have evolved from field binary stars or might have been formed in GCs and then dispersed in the field; either SN kick or dynamical interaction within GCs have been considered as ways to extract LMXBs from their parent GC (White, Sarazin, & Kulkarni, 2002). Recently, Juett (2005) and Irwin (2005) analyzed the relation between the fraction of GCLMXBs (or their co-added X-ray luminosity of LMXBs) and the GC specific frequency () and concluded that exclusive GC formation for LMXBs may not be supported by the data. However, all these observational studies are based on relatively small GCLMXB samples, resulting from the small field of view of the HST observations used to identify GCs.
Here, we utilize both HST and ground-based observations in our study of 6 elliptical galaxies observed with Chandra. Lee & Kim (2000) showed that the HST/WFPC2 data supplemented by wide-field ground based data are very effective to investigate GC systems of elliptical galaxies, since the crowding problem in ground-based observations is not severe for the outer region of the galaxy. Combination of the HST and ground-based observations enables us not only to expand the available sample, but also to extend the study of LMXBs to the outer part of the galaxy, which has not been studied so far. It is also important to compare LMXBs and GCs in the same galaxy scale and extract their properties (e.g., (LMXB), (GC-LMXB) and ) from the same region.
This paper is structured as follows: In §2 we describe the sample galaxies and the data analysis method for the extraction of both LMXB and GC samples. We also explain in detail how GC candidates are selected and discuss the degree of contamination in the optical GC sample. The match between X-ray and optical source lists and the accuracy of astrometry are described in §3. We report our main results in §4. We discuss the comparisons between different LMXB populations and their implications in §5 and summarize our main results in the last section.
2 Sample Selection and Basic Data Reduction Techniques
2.1 The Sample
We selected relatively nearby (d ) elliptical galaxies with archival Chandra ACIS data centered on the chip (Weisskopf et al., 2000) to study the characteristics of X-ray point sources. Moreover, since our goal is to investigate not only the X-ray properties of the LMXBs but also the LMXB GC connection, we required that the sample galaxies had been observed both in optical and X-ray wavelengths. In addition, to optimize the optical coverage of our sample, we only considered galaxies where both ground-based wide-field observations and central HST/WFPC2 pointings are available. Our final sample contains six galaxies: NGC 1399, NGC 4374, NGC 4472, NGC 4486, NGC 4636 and NGC 4649. Five of these six galaxies are in the Virgo cluster. We list the target names along with the positions and the basic photometric properties in Table 1.
In all cases, the ACISS3 CCD was primarily used to take advantage of the higher sensitivity at the low energies (kT 4 keV) of the back-illuminated S3 chip (CXC, 2004). To have homogeneous X-ray data, we restricted the analysis to only data from the chip even though there are still some point sources detected in the other CCDs. The obs-id and the exposure times of the Chandra observations used are listed in Table 2. The effective exposure times range from ksec(NGC 4649) to ksec(NGC 4486).
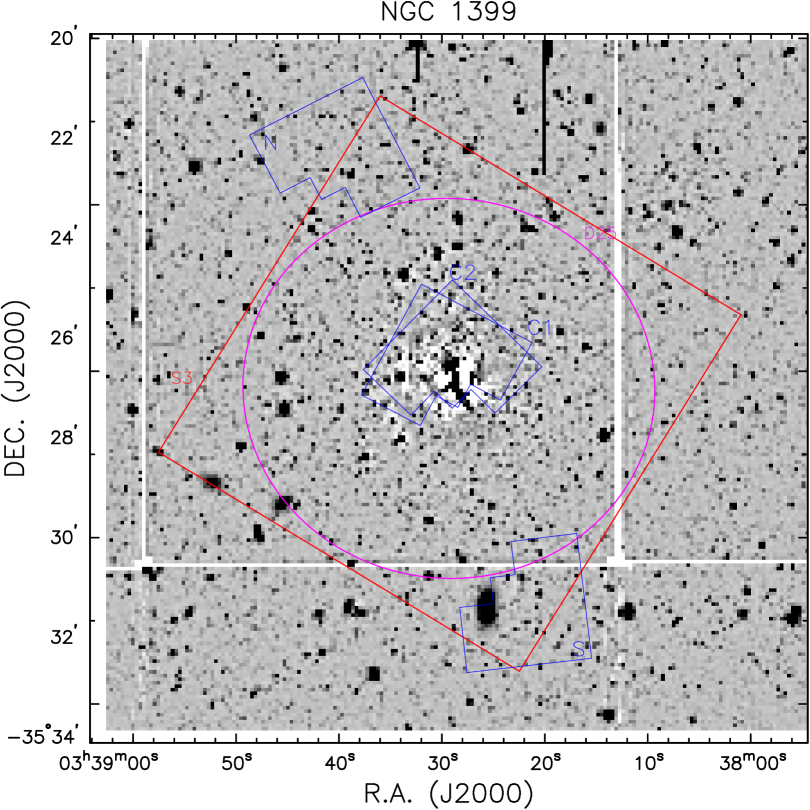
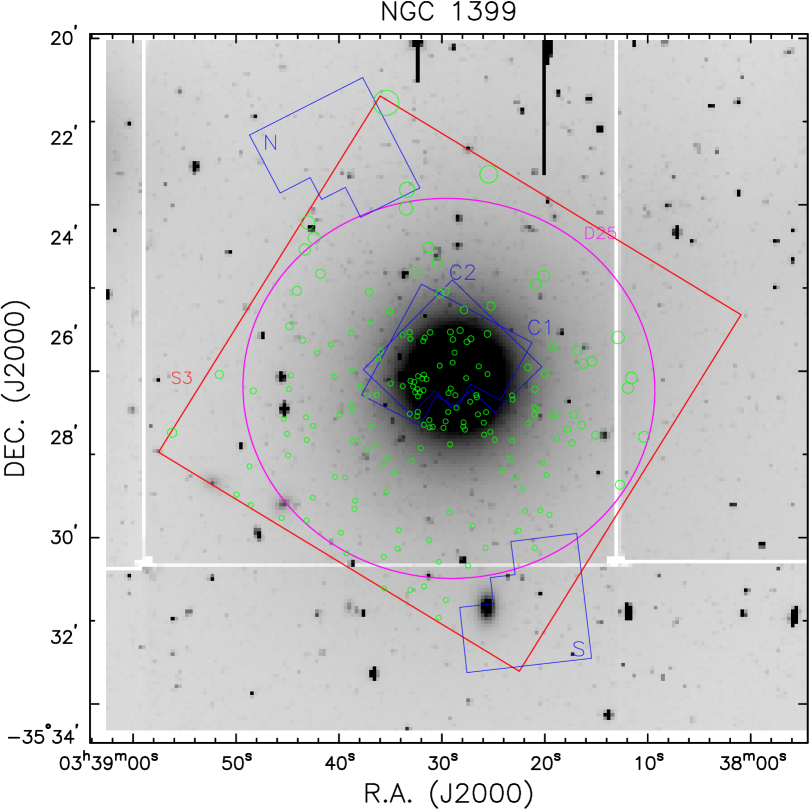
Fig. 1 shows the ground based optical images of the 6 galaxies. The big rectangles represent the boundary of the Chandra chip; the bat-shaped regions give the field of view of the HST/WFPC2 observations, and the ellipses show the optical extent of the galaxy based on the standard diameter () and ellipticity () from the RC3 catalog (de Vaucouleurs et al., 1991). The point sources detected in the chip are marked with small circles, where the size of the circle is proportional to the size of the Chandra point spread function ( of the encircled energy fraction).
Ground-based optical observations for the 6 elliptical galaxies were carried out with the 4 telescopes at Kitt Peak National Observatory (KPNO) and Cerro Tololo InterAmerican Observatory (CTIO). We used the Washington and standard Johnson filters. The Washington filter system (e.g., & filters) is known to be effective in discriminating the GCs from other contaminating sources, such as faint background galaxies and foreground stars (Geisler, Lee, & Kim, 1996). We note that the magnitude is similar to the magnitude (Kim, Lee, & Geisler, 2000; Dirsch et al., 2003), while the filter has times the sensitivity of the filter (Geisler, 1996). We list the journal of the optical ground-based observations of the target galaxies in Table 3.
While deep ground-based optical observations provide a large enough field of view to cover the whole chip, they suffer from saturation and crowding especially in the central part of a galaxy. For these central regions, we use archival HST/WFPC2 data. We use and band images, since these bands have been well calibrated to identify GC candidates in external galaxies (e.g., KisslerPatig, 2000). We take the , and filters for the band and the filter for the band. The list of archival HST/WFPC2 observations for the 6 galaxies is given in Table 4 with exposure times and the field observed shown in Fig. 1. The filter name for band is specified when either or are used instead of . We only list the total exposure times of multiple exposures. The mean exposure times for and bands of HST/WFPC2 observation are sec and sec, respectively.
2.2 X-ray and Optical Photometry
Following the X-ray data reduction procedure in the Chandra Multiwavelength Project (ChaMP) (Kim et al., 2004), we clean background flare events during the exposure, then detect point sources with the CIAO task wavdetect. The X-ray photometric properties (count rate, hardness ratio, etc.) of point sources detected in the band are computed by adding events in a circular aperture corresponding to of the encircled energy of the Chandra point spread function111http://cxc.harvard.edu/cal/Hrma/psf.
We follow several approaches to obtain optical photometry from the ground-based observations. For NGC 4472, we use the photometry of Geisler, Lee, & Kim (1996) and Lee, Kim, & Geisler (1998). Since the magnitude is very close to the magnitude (Geisler, 1996), we simply consider the magnitude for point sources in NGC 4472 as their magnitude. For NGC 1399, we use the wide field photometry of Dirsch et al. (2003). For the remaining four galaxies, we use the photometric data of Lee et al. (2005). To decrease the effect of highly varying galaxy halo light on the detection and brightness of point sources, the halo light is modelled with IRAF/STSDAS median smoothing at the outer radii and ellipse fitting tasks in the inner regions of the galaxies. Except for the very central region where saturation truncated source detection in all ground-based observations, this modelling is very successful in reducing the effect of the galaxy light. As an example, Fig. 2 shows the residual image of NGC 1399 after subtracting the model diffuse emission.
We use the Lee & Kim (2000) HST/WFPC2 photometry of NGC 4472; these authors used simple circular aperture along with appropriate aperture correction to obtain the photometry of point sources. For the remaining five galaxies, we perform our own HST/WFPC2 photometry in this study. Images obtained with the same filter are combined if there are multiple images, to remove cosmic ray hits. Rejection of cosmic rays is important, especially for the HST/WFPC2 observation. Because the HST point spread function is comparable to the size of cosmic ray hits, a cosmic ray is more likely misidentified as a valid point source in the HST observations than in ground-based observations. To remove the galaxy diffuse emission, we apply the same modeling technique as used for the ground-based observations. For the final photometry, we utilize the digital photometry software HSTPHOT (Dolphin, 2000; Kim et al., 2002).
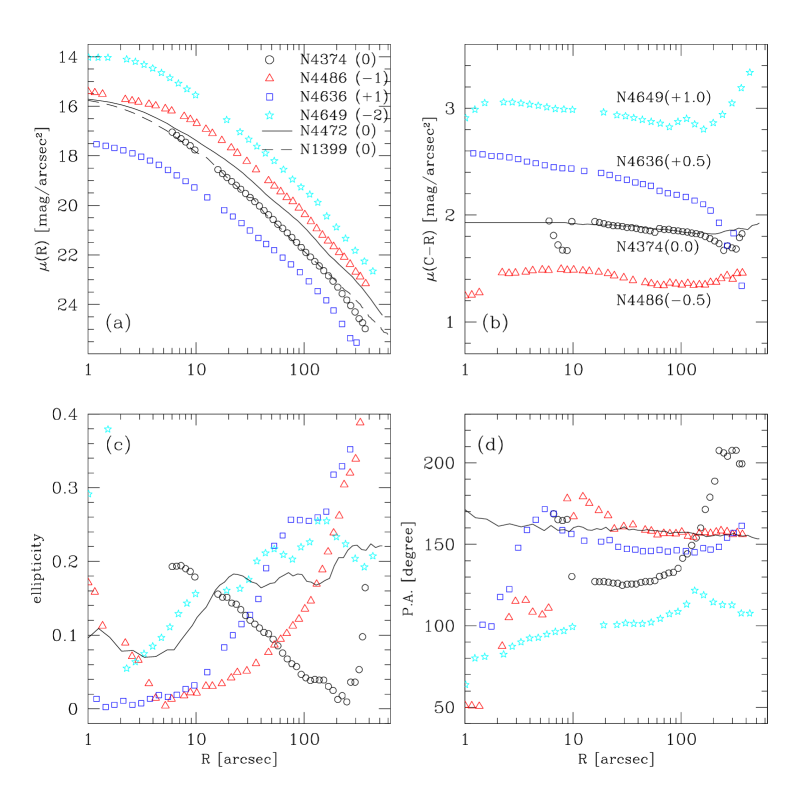
For the four galaxies NGC 4374, NGC 4486, NGC 4636 and NGC 4649, we obtain surface photometry of images from ground-based observations using the ellipse task of IRAF/STSDAS. Iteratively fitting an ellipse to isodensity contours (Jedrzejewski, 1987), ellipse provides radial profiles of brightness, color, ellipticity and position angle. The ellipse fitting results are shown in Fig. 3. For comparison, we also plot the NGC 4472 (solid lines; Kim, Lee, & Geisler 2000) and NGC 1399 (dashed lines; Dirsch et al. 2003). Based on the band surface photometry, we list in Table 5 the basic structure parameters, including effective radius () and standard radius (), a circular radius of an ellipse where the surface brightness in band is . Also listed are ellipticities, position angles, and colors at these two radii. We measure the mean color and magnitude and color gradient in the region of (the last three rows in Table 5). We note that the mean optical properties are similar in different galaxies, with the possible exception of NGC 4636 which has a slightly bluer color in the outer radii.
2.3 Optical Globular Cluster Candidates
Multi-color observations are frequently used for selecting GC candidates, since GCs show a typical distribution in a color magnitude diagram(CMD), especially in the and domains (Geisler, Lee, & Kim, 1996; Lee & Kim, 2000). Fig. 4 shows the distribution of optical point sources in the CMD for HST/WFPC2 observations and in the CMD for the ground-based observations of the six elliptical galaxies. The boxes represent the selection criteria of GC candidates adopted in the present study. Since most of the sample galaxies are in Virgo, we used the same magnitude boundaries defined by Geisler, Lee, & Kim (1996) for ground-based observations () and by Lee & Kim (2000) for the HST/WFPC2 observations(). We determined the () and () color boundaries by inspecting the color distribution of point sources at different magnitude limits and listed them in Table 6. Since point sources detected in HST/WFPC2 observation are more reliable than those from ground-based observations, we preferentially use HST/WFPC2 data whenever possible. photometries are transformed to photometries by using point sources detected in both HST/WFPC2 and ground-based observations. The total number of GC candidates in the six galaxies is 6173 in a radial region of . M87 (NGC 4486) is found to have the most populous GC system () while NGC 4374 has only 523 GCs. In Table 7, we summarize the number of GCs found in ground and HST observations.
Even with the above selection criteria, a significant fraction of interlopers remain in the selected GC candidates, since there are some background galaxies which have magnitudes and colors located in the selection boxes of the CMDs of Fig. 4. The sources detected in both HST/WFPC2 and ground-based observations enable us to estimate the number of these contaminants. We assume that (1) there are no contaminants in the sample of point sources detected in the HST/WFPC2 observation and (2) that all the GCs detected in ground-based observation are also detected in the HST/WFPC2 observation. The first assumption is quite plausible, since the high spatial resolution of HST enables us to reliably distinguish a point source from a background galaxy. The second assumption requires some scrutiny, since it depends not only on the observational status (e.g. exposure time, filter system), but also on the distribution of sources within the galaxy. Based on artificial source experiments, Lee & Kim (2000) showed that in the inner region of NGC 4472, the incompleteness due to the highly varying galaxy light and source crowding is negligible only when bright ( mag) sources outside the crowded center ( arcsec) are used. Because our sample covers a wide range of exposure times, we apply conservative criteria to validate the second assumption: arcsec and mag.
We show the number ratio of the detected point sources located in a given CMD-region in Fig. 5. This ratio is defined as , where is the number of point sources detected only in ground-based observations, and the number of point sources detected in both ground and HST observations. Although the degree of contamination varies slightly from one galaxy to another, the global amount of contaminants for the sample of GC candidates in ground-based observations is for CMD regions BGC & RGC. The contamination increases dramatically when we consider the fainter samples (CMD regions FB & FR in Fig. 5) or sources with extreme colors (CMD regions VB & VR in Fig. 5).
Applying this contamination fraction to the GC candidates selected from ground observations alone, we estimate the number of contaminants in BGC and RGC candidates of ground-based observation at different galacto-centric radii and list the numbers in the last two columns of Table 7. The total number of background galaxies which might be included in the current optical globular cluster sample () is 9%. The contamination increases with galacto-centric radii due to the lack of HST/WFPC2 observations in the outer part of a galaxy. The fraction of contaminants for the inner regions (outside the central ) is less than , while this value increase to for the region outside the ellipse.
As an independent test to address the contamination in the sample of ground based observations, we utilize the source catalogs from Hubble Deep Fields north and south (Williams et al., 1996; Casertano et al., 2000). Since the typical seeing size of ground based observations is , we only consider extended sources with a size smaller than , which might be misclassified as a point source in ground based observations. Counting the number of HDF sources located in the same CMD region with our optical GCs, we find that the misclassified extended galaxies could be of our ground-based optical GC sample, corresponding to of our GC sample. We conclude that the effect of contamination in our GC sample is small ().
3 Matching X-ray and Optical Positions
3.1 Astrometric Uncertainty
To accurately determine the X-ray source position, we first corrected for the aspect offset introduced by the earlier inaccurate calibration data (see CIAO science thread222 http://asc.harvard.edu/ciao/threads/arcsec_correction/). After running wavdetect, we also applied a position refinement algorithm (Kim et al., 2004), which was later incorporated into CIAO v3.0 wavdetect333http://cxc.harvard.edu/ciao. The X-ray source positional error is then calculated by the prescription given by Kim et al. (2005), who provide a set of empirical equations as a function of source count and off-axis angle, based on extensive simulations. The positional uncertainty of a typical X-ray source with 30 net counts at off-axis angle arcmin is arcsec at the confidence level.
The optical source position in pixel coordinates is determined by daophot (Stetson, 1987) for ground-based observations and HSTPHOT (Dolphin, 2000) for HST/WFPC2 observations, respectively. The pixel coordinate is then transformed to the world coordinate by cross-correlating the USNOB1 catalog (Monet et al., 2003). A typical error of this transformation is arcsec. However, we cannot use the USNOB1 catalog for the HST/WFPC2 data because there are only a small number of USNOB1 sources inside the HST/WFPC2 field of view, particularly when it is aiming at the center of a galaxy which is often saturated and also highly non-uniform. Instead, we use the transformed ground-based data as a template to obtain the world coordinate for HST/WFPC2 sources. The transformation error between the ground-based data and HST/WFPC2 data is dominated by the former error () due to the negligible positional error of the HST/WFPC2 data.
3.2 Match and Random Match
Using the X-ray positional errors at the 95% confidence level (Kim et al., 2005), we first select optical sources inside the Chandra error radius. To minimize false matches, we further limit the search radius to and visually inspect the optical image for validation. Most () X-ray sources have error radii smaller than . When there are multiple optical sources inside the search radius, we select the nearest optical source. Since this happens only 11 times (or for a few % of the sources), the expected number of false matches is negligible. For of the matches, the positional offset between X-ray and optical sources () is less than the typical positional error of X-ray sources (). The median positional offset is .
To identify field LMXBs (i.e., X-ray sources without an optical counterpart), we first select the X-ray sources without optical counterpart inside . We then visually inspect the optical images at the position of X-ray sources to look for optical counterparts just outside the error circle and undetected sources due to chip defects and/or saturation effect of nearby bright sources. In our sample of 665 X-ray point sources inside the ellipse (but excluding the central 20 arcsec region), we identify 285 () GCLMXB and 258 () fieldLMXB. We list the match statistics for each galaxy in Table 8. Since our match criteria are rather conservative, we are left with 122 X-ray sources for which we cannot establish whether they match with GCs or not. Some of them match with non-GC optical sources. We do not use these X-ray sources in the following analysis to minimize the uncertainty of X-ray source characteristics.
To assess the probability of false matches, we applied two independent methods. First, to determine the probability of finding an optical source by chance, we shifted the X-ray source position by , corresponding to times the typical 95% position error, and then we tried to match them with optical sources as explained above. Based on 100 simulations for the whole field of view, we find matches, which is considerably smaller than the 43% match occurrence obtained for the observed X-ray source positions. Secondly, we redistributed the optical sources randomly, but following the observed GC radial profile, and kept the number of sources the same as that of the observed sources. The number of random matches with optical GCs is (or ), and decreases (by ) when X-ray sources in arcsec are excluded. Adopting the radial profile of the halo light instead of the GC profile affects very little the number of random matches (). Therefore, we conclude that the chance probability of a false match is small compared to the number of GCLMXB associations.
We summarize the match statistics for the point sources in this radial range in Table 9. The mean probability for a GC to harbor an LMXB, defined by = N(GCLMXB) / N(GC), is 5.2% in our sample of 6 galaxies. This is slightly larger than that of Kundu, Maccarone, & Zepf (2002) for the central region of NGC 4472, mainly due to the high fraction (9.8%) in NGC 1399. The mean probability excluding NGC 1399 is . While the fraction of BGCs with an LMXB () is relatively constant ( 2%) with the exception of NGC 1399 (5.8%), that of RGCs () widely varies from one galaxy to another (2.7% – 13%), resulting in varying from 1.4 to 4.6. The average is 2.7, indicating that RGCs on average have a higher probability to harbor an LMXB by a factor of 2.7 than BGCs. Although the mean value is consistent with those previously reported (e.g., Kundu, Maccarone, & Zepf, 2002; Sarazin et al., 2003), we note that galaxy to galaxy variations are not negligible.
The total number ratio of N(GCLMXB) to N(fieldLMXB) is close to . We show the run of this ratio as a function of individual galaxy in Fig. 6. The most extreme ratios are found in NGC 4374 and NGC 1399. The low ratio of NGC 4374 () appears to be mainly due to the small number of the RGCLMXB population, while the higher ratio for NGC 1399 () is due to the small number of fieldLMXBs in this galaxy. Again we note that galaxy to galaxy variations are not negligible (see also §5).
4 Comparison between BGCLMXB, RGCLMXB and FieldLMXB
4.1 GC Luminosity Distribution
We show the optical luminosity () distributions of GCs (the whole sample and red/blue GCs separately) in Fig. 7. We also plot the luminosity distribution of GCs with LMXBs, for which we use only the LMXBs with net count to minimize the effect of incompleteness, i.e., missing faint X-ray sources. In this plot, we use sources outside of central radius.
The amplitude of the observed optical luminosity function of GCs increases as the luminosity decreases and peaks at . Beyond the observed luminosity function drops quickly due to incomplete detection. But note that the true peak of the luminosity function is at (Richtler, 2003). The luminosity function of GCs with LMXBs is different from that of the whole GC sample: the observed peak luminosity is significantly brighter than that of the whole GC sample by mag (or times brighter), indicating that brighter (bigger) GCs preferentially harbor LMXBs. This is consistent with previous results (e.g., Sarazin et al., 2003). Applying the Kolmogorov-Smirnov (KS) test for the sub-samples used in Fig. 7, we find that the probability that GCs with LMXBs are drawn from the same parent population as the whole GC sample is negligible ().
The ratio of the luminosity distribution of GCs (both total, blue and red) with LMXBs and the whole GC samples is shown in Fig. 7 (b). Again, there is a clear indication that brighter (bigger) GCs preferentially harbor LMXBs. Interestingly, this trend of the optical luminosity dependency is much stronger in RGCs than in BGCs. For example, the fraction of RGCs with LMXB at is times higher than that at , while the fraction of BGCs with LMXBs only changes by a factor of (see §5 for more discussion). The KS-test weakly rejects (at the confidence level) the hypothesis that BGCs and RGCs which harbor LMXBs belong to the same population.
4.2 Radial Distributions of GCs
Our large sample of sources and the larger optical field of view of the ground-based data allow, for the first time, the studies of the radial variations of GC/LMXB properties, including the optical luminosity of GCs hosting LMXBs, and X-ray luminosities and colors of GCLMXBs. Previous work, because of the small HST field of view, could not extend the study of GC LMXB associations farther than , where is the galacto-centric radius.
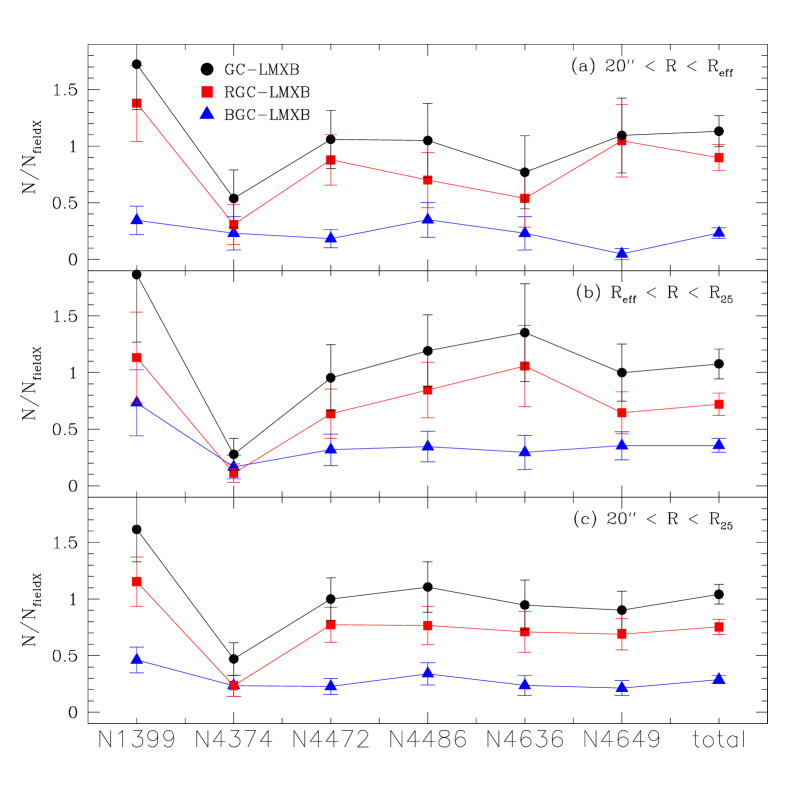
Fig. 8 shows the number ratio of GCLMXBs/GCs for different radial regions: (a) , (b) and (c) , where and are from Table 5. We consider only LMXBs with net counts . The fact (§3.2) that RGCs more preferentially harbor LMXBs than BGCs remains valid in all three radial bins. Also valid is the fact (discussed in §4.1) that the brighter GCs more preferentially harbor LMXBs. However, it is interesting to note that both RGCs and BGCs located near the galaxy centers have a higher probability to harbor LMXBs compared to the GCs at outskirts. The enhanced probability is most significant for the bright () RGCs, reaching at the peak in the innermost radial bin. In the outer regions, this probability goes down to . For faint GCs, the radial difference is less clear since the number of GCs with LMXBs is small. This radial dependency, which is reported here for the first time, seems to suggest an important mechanism for LMXB formation (see also §4.4 and 5).
4.3 X-ray Properties of GC and FieldLMXB
The X-ray luminosity distributions (normalized to the total number of sources) of LMXBs in different radial regions are shown in Fig. 9. We only consider the X-ray point sources with net counts to minimize the incompleteness. The X-ray luminosity distributions of different LMXB populations are statistically indistinguishable. The KS tests for any combination of two samples in the same radial bin suggest that the hypothesis that they are drawn from different populations is excluded at the confidence limit. The only possible exception is the BGCLMXB sample of the central region which appears to peak at higher . However this difference may be due to a small number (11) of BGCLMXBs.
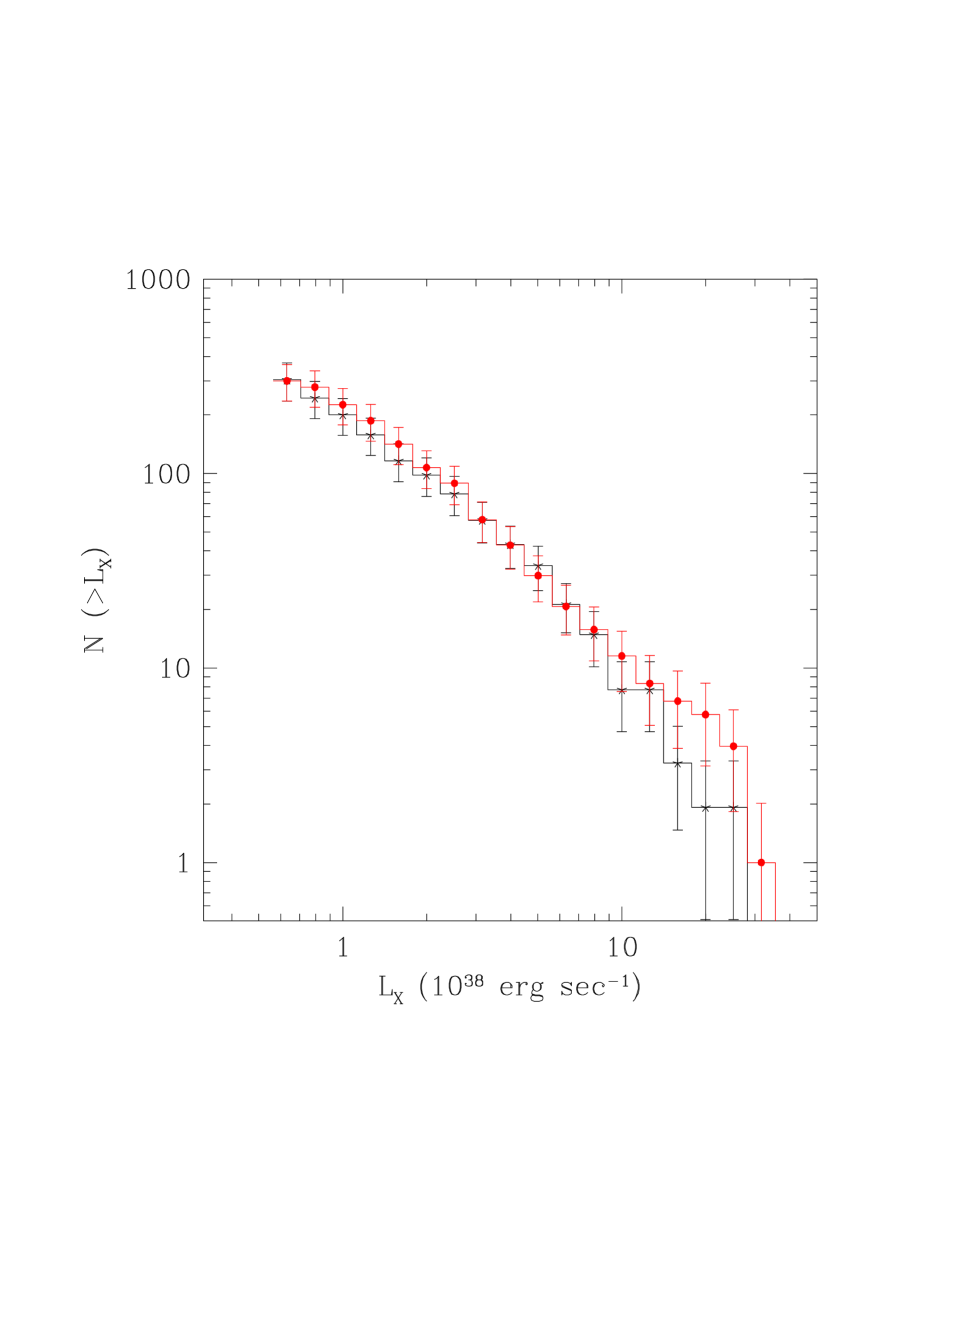
Fig. 10 shows completeness-corrected X-ray luminosity functions (XLFs) of GCLMXBs and fieldLMXBs, derived by applying the simulation technique as described in Kim & Fabbiano (2004). They are statistically indistinguishable in their shape. Their normalizations are also identical within the error, but this result is not astrophysically meaningful, because of galaxy to galaxy variations as noted in §3.2 (see also §5). The only possible difference is observed at the most luminous end ( erg s-1) of the XLFs, where there are more GCLMXBs than fieldLMXBs, but with a limited significance ( 1 ) due to the small number of very bright LMXBs. We will discuss the implications of this result for the presence of BH X-ray binaries in GCs in §5. The individual XLFs of BGCLMXBs and RGCLMXB are also consistent with each other, except that the XLF of BGCLMXBs is slightly (but within a error) flatter. We fit the observed XLFs with both single power-law and broken power-law models and find that our results are consistent with those of 14 early type galaxies studied by Kim & Fabbiano (2004). The best-fit slope for a single power-law is for both GC and fieldLMXBs with close to . Since the fit with a single power law is already good and a more complex model is not required, the parameters of the broken power law are not well constrained, but our results ( erg s-1; slope = and below and above the break) are consistent with Kim & Fabbiano (2004).
The luminosity ratios for LMXBs found in GCs are displayed in Fig. 11. Again, there is no statistically significant difference in between any combination of two sub-samples. Again the BGCLMXB sample of the central region peaks at the higher , but this effect is not conclusive because of the large errors. Note that a typical LMXB X-ray luminosity is roughly of the optical luminosity in band of an entire GC, and a few LMXBs are more luminous than their host GCs ().
To investigate the X-ray spectral properties of different sub-samples, we use the X-ray hardness ratio, defined as HR = (HS) / (HS), where S and H are net counts in keV and keV, respectively. We also use X-ray colors as defined in Kim et al. (2004), C21 = log (C1/C2) and C32 = log (C2/C3), where C1, C2 and C3 are net counts in keV, keV, and keV, respectively. By definition, as the X-ray spectra become harder, HR increases and X-ray colors decrease. For faint sources with a small number of counts, HR and colors often result in unrealistic values with unreliable errors because of negative net counts in one band and a non-symmetric Poisson distribution. We apply a Bayesian approach developed by van Dyk et al. (2004), which models the detected counts as a non-homogeneous Poisson process. Taking into account the ACIS QE degradation which could change the soft band counts by (Kim et al., 2004), we also convert the counts to what would be obtained at the mid-point within the observation period of our sample. The mean and standard deviations of each group are listed in Table 10. We find no statistically significant differences in the X-ray HRs and colors of fieldLMXBs and GCLMXBs and also between RGCLMXBs and BGCLMXBs.
4.4 Radial Profiles
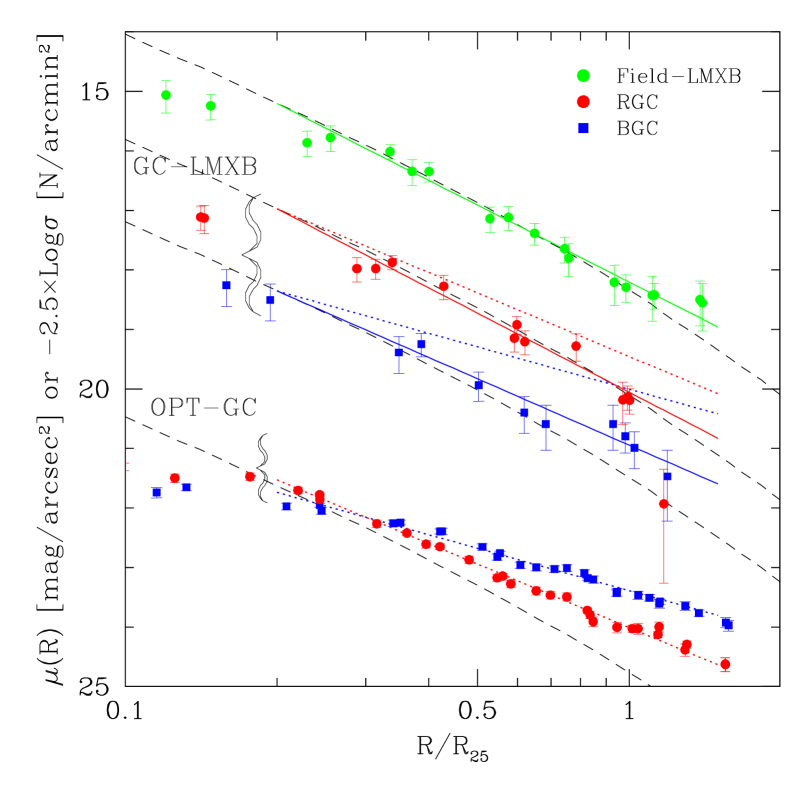
We explored spatial differences by comparing the radial profiles of the surface number density of LMXBs and GCs. Because the radial distribution of optical GCs is known to be flatter than that of the optical halo light (e.g., Lee & Kim, 2000), it is particularly interesting to test whether the radial profiles of GCLMXBs and fieldLMXBs follow that of the optical GCs or that of the optical halo light.
We show the combined radial profiles of the surface density of LMXBs, optical GCs and galaxy halo light (Fig. 12). The linear least square fit for the radial range of and the slopes of the fit are summarized in Table 11. The minimum radius is chosen to minimize missing sources due to highly varying background in both optical and X-ray images.
As seen in the bottom part of Fig. 12, the radial profile of GCs is considerably flatter than that of the optical halo light. This trend is more pronounced in BGCs than in RGCs. This result is consistent with previous optical studies (e.g., Lee & Kim, 2000). However, surprisingly, we find that the radial profile of GCs with LMXBs is significantly steeper than that of the optical GC population, but close to that of the halo light (see the top part of Fig. 12). The difference of the radial profile slope between the whole GCs and GCs with LMXBs is 1.45, which corresponds to a statistical significance of (see Table 11). This result is consistent with our result (§4.2) of GCs having a higher chance to harbor LMXBs in the central region and suggests an important clue for the LMXB formation mechanism (see §5). This trend is also valid for RGCs and BGCs separately. While the radial profile of RGCs (either the entire GC sample or GCs with LMXBs) is steeper than that of BGCs, the radial profile of GCs with LMXBs is still steeper than the optical GCs in both BGCs and RGCs samples. It is also interesting to note that the radial profile slope of the fieldLMXBs is very similar to that of RGCLMXBs, while steeper than, but still consistent with that of BGCLMXBs.
To make sure that these differences in radial distributions are not a statistical fluke, we performed 1000 simulations by randomly selecting the same number of GCs as observed from the whole GC sample, then fitting the radial profile by the same method which used in Fig. 12. We find that the probability that the random sample has a steeper slope than the observed is ( and for BGC and RGC separately). To further check for possible contamination by foreground stars and background galaxies, we compared the radial profiles produced by the HST data and the ground optical observations separately (Fig. 13). As demonstrated in §2, the contamination in our sample of optical GCs is small based on comparison between the HST and ground-based data, the GC radial profiles produced by ground-based and HST data are consistent with each other within a error for all sub populations of GCs.
5 Discussion
Using Chandra and Hubble archival data of 6 elliptical galaxies, supplemented by deep optical ground-based imaging observations, we identify 6173 GCs and 665 LMXBs within the ellipse of these galaxies (§2). Applying conservative matching criteria, we find 285 LMXBs coincident with GCs (209 in RGC and 76 in BGC) and 259 LMXBs in the field (§3). This is the largest GC LMXB sample studied so far.
5.1 Metallicity and LMXB formation in GCs
We find that the probability to find LMXBs is on average 3 times higher for RGCs than BGCs, but with a non-negligible variation from one galaxy to another (§3.2), consistent with previous reports of early type galaxies (e.g., Kundu, Maccarone, & Zepf, 2002; Sarazin et al., 2003; Jordan et al., 2004), , and in the Milky Way and M31 (e.g., Grindlay, 1993). This result indicates that metal abundance plays a key role in forming LMXBs in the globular clusters, as suggested by the above authors.
The physical mechanism linking the metallicity and the formation and evolution of LMXBs is not well understood. Bellazzini et al. (1995) suggested that the larger stellar size of a metal rich star can increase the tidal capture rate, making it easier to fill the Roche-lobe, and therefore may be responsible for the preferential association of LMXBs with metal rich RGCs. Instead, Maccarone, Kundu, & Zepf (2004) showed that the effect of the larger stellar size is not enough to explain the observed difference, and proposed an irradiation induced stellar wind model, where a metal-poor star (in BGC) with a stronger stellar wind evolves more rapidly than a metal-rich star in RGC. This model predicts harder X-ray spectra in BGCLMXBs than RGCLMXBs, because of the extra absorption by accreting materials in BGCLMXBs (their estimated column density cm-2).
However, when we compare the X-ray spectral hardness/absorption of RGC and BGC sources (§4.3), we find no statistically significant differences. Although we cannot rule out a small amount of intrinsic absorption given the statistical uncertainty, we estimate that cannot exceed cm-2 in both RGCs and BGCs. Therefore, our result does not support the prediction of the stellar wind model. Recently, Ivanova (2005) suggests that the absence of an outer convective zone in the metal poor main sequence star may explain the observed trend. Because magnetic breaking, necessary for the orbital decay to form a compact X-ray binary, does not turn on without the outer convective zone, the efficiency to form LMXBs is considerably lower in BGCs than in RGCs. If this scenario is correct, there is no specific reason for different X-ray obscuration and the X-ray spectral properties of LMXBs in RGCs and BGCs would be similar, as indicated in our results. However, no theoretical model, so far, can explain why the fraction of LMXBs in RGCs and BGCs considerably varies from one galaxy to another (from 1.4 to 4.6; §3.2).
5.2 Dynamical Effect in GC-LMXB formation
We have found that the GCs located near the center of galaxies have a higher probability to harbor LMXBs compared to those in the outskirts. This trend is confirmed with a high significance both by the luminosity dependent GCLMXB fractions in different regions (§4.2) and by the radial profiles of LMXBs and GCs (§4.4). Although a negative radial gradient of the average GC metallicity is known in some elliptical galaxies (e.g., Lee, Kim, & Geisler, 1998) , it can be mostly attributed to the steeper radial profile of metal-rich RGCs, compared to that of metal-poor BGCs (Geisler, Lee, & Kim, 1996, as seen in Fig. 12) Therefore, the metallicity gradient for the RGC and BGC individually is not significant (Lee, Kim, & Geisler, 1998) and cannot explain the observed higher probability to harbor an LMXB near the galactic center than in the outskirts. A secondary mechanism, dependent on the galacto-centric distance, must play an important role in the GCLMXB formation, with the metallicity being the primary mechanism as discussed above. One possible explanation is that GCs near the galactic center may have a compact core and a higher central density than GCs in the outer regions, as a result of selective GC disruption by the galactic tidal force. This conclusion is also consistent with the recent HST study of M31 where the central density of GCs increases toward the center of M31 (Barmby, Holland, & Huchra 2002; see also Bellazzini et al. 1995). Therefore, the chance to form LMXBs is expected to increase in GCs near the galaxy center because of a higher rate of either tidal capture or exchange interaction resulting from the higher central stellar density.
Based on the structural parameters of individual GCs determined with the HST/ACS data of M87, Jordan et al. (2004) showed that the encounter rate () of GCs with LMXBs is considerably higher than the mean . They formulated a probability of a GC hosting an LMXB as a function of and Z. This formulation is consistent with similar results on Galactic GCs by Pooley et al. (2003) and Heinke et al. (2003), and with the higher central density of M31 GCs with LMXBs (Bellazzini et al. 1995). Our results further support that the probability of harboring an LMXB requires a secondary parameter in addition to metallicity.
Based on the correlation between and luminosity, Jordan et al. (2004) also suggested that the luminosity dependency on the fraction of GCs with LMXBs may be a consequence of a more fundamental relation between and luminosity. As reported previously (e.g., Sarazin et al. 2003), we confirm that the more luminous GCs have a higher probability to host LMXBs (§4.1). This trend is valid for each RGC and BGC subsample. However, we find that the linearity holds only in RGCs, but not in BGCs. The RGCLMXB fraction increases by a factor of 5.5 as increases from –8 mag to –9.8 mag (i.e., brighter by a factor of 5.2). This is consistent with the expected linear increase of the LMXB fraction with increasing luminosity. On the other hand, the BGCLMXB fraction increases only by a factor of 2 with the same optical magnitude range. This may indicate a complex relation in metal poor GCs between the cluster luminosity (or mass) and the LMXB fraction, as might be suggested by Ivanova (2005).
5.3 Can BH X-ray binaries form in GCs?
It is well known that no BH X-ray binary has been found in Galactic GCs (e.g., Grindlay et al., 2001); however, the total number of GCLMXBs in the Milky Way is relatively small. Kalogera, King, & Rasio (2004) showed that the duty cycle for a BH binary formed in the center of a dense cluster by an exchange interaction is extremely low. For early type galaxies, mixed results have been reported. Sarazin et al. (2003) reported a weak tendency for bright LMXBs to avoid GCs and Minniti et al. (2004) reported that no bright GCLMXB (ie., BH candidates) is identified in NGC 5128. On the other hand, a number of luminous GC LMXBs are found in N1399 (Angelini, Loewenstein, & Mushotzky, 2001) and M87 (Jordan et al., 2004). Angelini, Loewenstein, & Mushotzky (2001) have even claimed that GCLMXBs are on the average more luminous than the field LMXBs. We found with high statistical confidence (§4.3) that the XLFs of GCLMXBs and fieldLMXBs are statistically consistent, indicating that luminous LMXBs are equally found in GCs and in the field. More specifically, there are 26 GCLMXBs and 27 field LMXBs with erg sec-1. We note that erg sec-1 corresponds to the break luminosity of the LMXB XLF where NS and BH X-ray binaries are likely separated, as identified by Kim & Fabbiano (2004). More conservatively, if we consider erg sec-1, there are still 8 GCLMXBs and 3 fieldLMXBs. Therefore, our results do not support the hypothesis that a GC cannot harbor a BH X-ray binary.
5.4 Are field LMXBs formed in the field or in GCs?
We find on average an equal number of LMXBs in GCs and in the field, although with a non-negligible galaxy to galaxy variation. One of the key questions to understand LMXB formation is whether GCs are the only birth place for all LMXBs. In this scenario, fieldLMXBs were originally formed in GCs and they were then ejected from the parent GC or left alone in the field as the GC was disrupted. Utilizing the fact that the radial profile of GCs is flatter than that of the galactic halo light (e.g., Lee, Kim, & Geisler, 1998), we tested this hypothesis by determining whether the radial profile of fieldLMXBs follows that of GCs or that of the halo light. We found (§4.4) that regardless of their association with GCs, LMXBs are distributed like the optical halo light, not the GCs. The close agreement between the radial distributions of the optical light and LMXBs has also been reported in NGC 1316 (Kim & Fabbiano, 2003), NGC 1332 (Humphrey & Buote, 2004) and NGC 4486 (Jordan et al., 2004). This seems to suggest a rather complex connection, depending on various factors operating in the LMXB formation in GCs and its subsequent evolution (see §5.2). Because of the similar radial distribution between GCLMXBs and fieldLMXBs, we can neither prove nor reject the hypothesis whether fieldLMXBs were originally formed in the GC.
If fieldLMXBs were ejected from GCs, they may still be in the neighbourhood of the parent cluster. We therefore searched for a nearby GC, which could have been the previous host of the current fieldLMXB, and compared the results with the expectation from the mean space density of GCs. Firstly, we find that the mean angular distance of the nearest GC from the field LMXBs is arcsec. This is compatible with the expected mean random separation, based on the space density of GCs ( 8 arcsec), indicating that there is no preference to find a potential host GC near a field-LMXB. Secondly, we measure the GC surface density near the field-LMXBs. Again, the estimated density is comparable with that expected from the GC space density ( GCs/arcmin2).
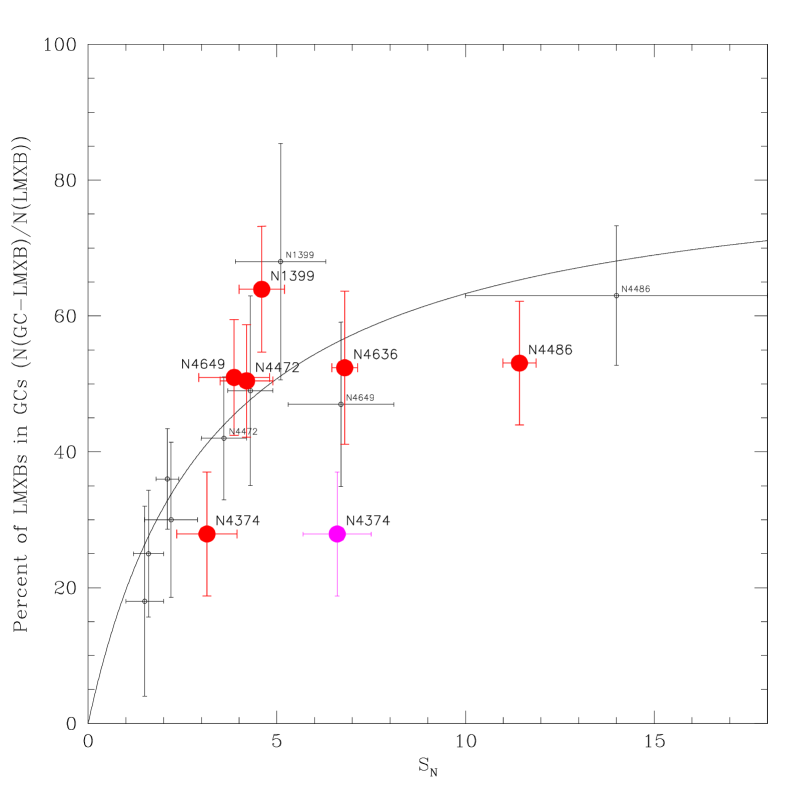
Based on simple relations of (GCLMXB) and (LMXB) against the GC specific frequency (), Juett (2005) and Irwin (2005) suggested that a considerable fraction of fieldLMXBs were indeed formed in the field. Although this suggestion is intriguing, reality may be more complex. Their relations may test the hypothesis of fieldLMXBs ejected from the parent GCs, but cannot work if the parent GCs were disrupted, because the current would not include GCs disrupted in the past. Furthermore, because is usually determined in a large scale (e.g., compared to the HST field of view), it is important to determine LMXB properties at a comparable scale to compare with . However, the previous studies are mostly limited to the HST field of view. If we plot our data of Table 10 in the same figure of Juett (2005), the relation appears to be less convincing (Fig. 14). Most galaxies (4 out of 6) have almost constant (GCLMXB) (50 5%), but with a wide range of (from Dirsch, Schuberth, & Richtler, 2005; KisslerPatig, 1997; Rhode & Zepf, 2001; Forbes et al., 2004). The remaining two galaxies are also outliers. NGC 4374 has the smallest GCLMXB fraction (30%) in our sample, but with a rather modest (3.2, taken from Gómez & Richtler 2004; Harris 1991 or 6.6 from Kissler-Patig 1997). NGC 1399 has the highest GCLMXB fraction (65%) in our sample, but is only 4.6 (Dirsch et al., 2003). Therefore, the proposed relationship with does not appear to be straightforward. The situation could be even more complex, for example, because of different merger histories (e.g., Schweitzer 2003) and different degrees of environment-dependent GC stripping (Bekki et al. 2003) which would add significant galaxy to galaxy variations. In particular, we note that three galaxies with the lowest GCLMXB fraction (NGC 1553, NGC 3115, NGC 1332) are all S0 galaxies.
6 Conclusions
1. In our sample of six elliptical galaxies, we find 285 LMXBs matched with GCs (209 in RGC and 76 in BGC) and 259 LMXBs in the field. This is the largest sample studied so far. We estimate that the systematic error in LMXB GC associations due to the source contamination and false matches is .
2. We confirm that on average the fraction of RGCs with LMXBs is three times higher that that of BGCs with large variations from one galaxy to another, indicating that metallicity is an important factor in GCLMXB formation ((kmz02; Sarazin et al., 2003; Jordan et al., 2004). We find that the average X-ray spectra of RGCLMXBs and BGCLMXB are statistically identical, in disagreement with the prediction of the stellar wind model (Maccarone, Kundu, & Zepf, 2004), but consistent with the explanation of the lack of outer convective zone in BGCs (Ivanova 2005). We also find that while the brighter (and bigger) GCs have a higher probability to host LMXBs as suggested by Sarazin et al. (2003), this linear dependency on the optical luminosity only holds in RGCs, possibly implying a complex formation scenario in BGCs (e.g., Ivanova 2005).
3. Both RGCs and BGCs located near the galaxy center have a higher probability to harbor LMXBs compared to GCs at the outer radii. The same trend is also confirmed by the steeper radial profile of GCLMXBs (for both RGC and BGC), when compared to that of the whole GC sample. This suggests there must be another parameter (in addition to metallicity) for LMXB formation in GCs, which critically depends on the galacto-centric distance. One possibility is a variable encounter rate, depending on the galacto-centric distance, as suggested by Jordan et al. (2004).
4. We find no statistically significant difference in the X-ray properties (shape of X-ray luminosity function, distribution, X-ray spectra) among RGCLMXBs, BGCLMXBs and fieldLMXBs. In particular, there is no observational preference to host or avoid BH X-ray binaries in GCs.
5. We find on average an equal number of LMXBs in GCs and in the field. We have tested the hypothesis that fieldLMXBs were once formed in GCs, by comparing radial profiles of GCLMXBs and fieldLMXBs and by searching for possible parent GCs near fieldLMXBs. We find that LMXBs, regardless of their association with GCs, do not follow the radial distribution of GCs, but more closely follow that of the optical halo light. The average distance and density of GCs near the fieldLMXBs are consistent with the expectation from the mean GC space density. Therefore, we could not prove or reject this hypothesis.
References
- Angelini, Loewenstein, & Mushotzky (2001) Angelini, L., Loewenstein, M., & Mushotzky, R. F. 2001, ApJ, 557, L35
- Barmby, Holland, & Huchra (2002) Barmby, P., Holland, S., & Huchra, J. P., 2002, AJ, 123, 1937
- Bekki et al. (2003) Bekki, F., Forbes, D. A., Beasley, M. A., & Couch, W. J., 2003, MNRAS, 344, 1334
- Bellazzini et al. (1995) Bellazzini, M., et al. 1995, ApJ, 439, 687
- Casertano et al. (2000) Casertano S. et al., 2000, AJ, 120, 2747
- CXC (2004) Chandra X-ray Center 2004, Chandra Proposer’s Observatory Guide version 7.0 (Cambridge: CXC)
- Dirsch, Schuberth, & Richtler (2005) Dirsch, B., Schuberth, Y. & Richtler, T. 2005, A&A, 433, 43
- Dirsch et al. (2003) Dirsch, B., Richtler, T., Geisler, D., Forte, J. C., Bassino, L. P., & Gieren, W., P. 2003, AJ, 125, 1908
- Dolphin (2000) Dolphin, A., E. 2000, PASP, 112, 1383
- van Dyk et al. (2004) van Dyk, D. A., Park, T., Kashyap, V. L. & Zezas, A. 2004, AAS HEAD, 8, 1627
- Forbes et al. (2004) Forbes, D. A., Faifer, F. R., Forte, C. J., Bridges, T., Beasley, M. A. Gebhardt, K., Hanes, D. A., Sharples, R. & Zepf, S. 2004, MNRAS, 355, 608 Dolphin, A., E. 2000, PASP, 112, 1383
- Forte, Faifer, & Geisler (2005) Forte, J. C., Faifer, F., & Geisler, D., 2005, MNRAS, 357, 56
- Geisler (1996) Geisler, D. 1996, AJ, 111, 480
- Geisler, Lee, & Kim (1996) Geisler, D., Lee, M., G., & Kim, E. 1996, AJ, 111, 1529
- Gómez & Richtler (2004) Gómez, M. & Richtler, T. 2004, A&A, 2004, 415, 499
- Grindlay et al. (2001) Grindlay, J., Heinke, C. O., Edmonds, P. D., Murray, S. S., & Cool, A. M. 2001, ApJ, 563, 53
- Grindlay (1993) Grindlay, J. 1993, ASP conf. 48. ed. G. H. Smith & J. P. Brodie p156
- Grindlay & Hertz (1985) Grindlay, J., & Hertz, P. 1985, in D. Lamb and J. Patterson (eds.), cataclysmic Variables and Low Mass X-ray Binaries, pp 79-91, Reidel, Dordrecht
- Harris (1991) Harris, W. E. 1991, ARA&A, 29, 543
- Heinke et al. (2003) Heinke, C. O., Grindlay, J. E., Edmonds, P. D., Lyoyd, D. A., Murray, S. S., Cohn, H. N., & Lugger, P. M., 2003, ApJ, 598, 516
- Humphrey & Buote (2004) Humphrey, P., J. & Buote, D., A., 2004, ApJ, 612, 848
- Irwin (2005) Irwin, J. 2005, astro-ph/0506215
- Ivanova (2005) Ivanova, N. 2005, ApJ, submitted
- Jedrzejewski (1987) Jedrzejewski, R., I. 1987, MNRAS, 226, 747
- Jordan et al. (2004) Jordan, A. et al. 2004, ApJ, 613, 279
- Juett (2005) Juett, A., M. 2005, astro-ph/0501476
- Kalogera, King, & Rasio (2004) Kalogera, V., King, A. R., & Rasio, F. A., 2004, ApJ, 601, 171
- Kim & Fabbiano (2004) Kim, D.-W., & Fabbiano, G., 2004, ApJ, 613, 933
- Kim et al. (2004) Kim, D.-W. et al. 2004, ApJ, 600, 59
- Kim & Fabbiano (2003) Kim, D.-W., & Fabbiano, G., 2003, ApJ, 586, 826
- Kim, Lee, & Geisler (2000) Kim, E., Lee, M., G., & Geisler, D. 2000, MNRAS, 314, 307
- Kim et al. (2005) Kim, M. et al. 2005, in preparation
- Kim et al. (2002) Kim, M., Kim, E., Lee, M. G., Sarajedini, A., & Geisler, D. 2002, AJ, 123, 244
- KisslerPatig (2000) Kissler-Patig, M. 2000, RvMA, 13, 13
- KisslerPatig (1997) Kissler-Patig, M. 1997, A&A, 319, 83
- Kundu, Maccarone, & Zepf (2002) Kundu, A., Maccarone, T. J., & Zepf, S. E. 2002, ApJ, 574, L5
- Lee et al. (2005) Lee, M., G. et al. 2005, in preparation
- Lee & Kim (2000) Lee, M., G., & Kim, E. 2000, AJ, 120, 260
- Lee, Kim, & Geisler (1998) Lee, M., G., Kim, E., & Geisler, D. 1998, AJ, 115, 947
- Maccarone, Kundu, & Zepf (2004) Maccarone, T. J., Kundu, A., & Zepf, S. E. 2004, ApJ, 606, 430
- Minniti et al. (2004) Minniti, D., Rejkuba, M., Funes, S. J., Josi G., & Akiyama, S., 2004, ApJ, 600, 716
- Monet et al. (2003) Monet, D., et al. 2003, USNO-B1.0, A Catalog of Astrometric Standards (Flagstaff: Naval Obs.)
- Pooley et al. (2003) Pooley, D. et al., 2003, ApJ, 591, L131
- Rhode & Zepf (2001) Rhode, K. & Zepf, S. 2001, AJ, 121, 210
- Richtler (2003) Richtler, T. 2003, astro-ph/0304318
- Sarazin et al. (2003) Sarazin, C. L. et al. 2003, ApJ, 595, 743
- Sarazin, Irwin, & Bregman (2001) Sarazin, C. L., Irwin, J. A., & Bregman, J. N. 2001, ApJ, 556, 533
- Schweitzer (2003) Schweitzer, F. 2003, ASP conf. Series vol. 296 ed. Piotto, G. et al. 467p
- Stetson (1987) Stetson, P. B. 1987, PASP, 99, 191
- de Vaucouleurs et al. (1991) de Vaucouleurs, G., de Vaucouleurs, A., Corwin, H., G., Jr., Buta, R., J., Paturel, G., & Fouque, P. 1991, Third Reference Catalogue of Bright Galaxies. Springer-Verlag, New York
- Verbunt & Lewin (2005) Verbunt, F., & Lewin, W. 2005, in W. Lewin and M. van der Klis (eds.), Compact stellar X-ray sources, p. in press, Cambridge University Press
- Weisskopf et al. (2000) Weisskopf, M. C., Tananbaum, H. D., Van Speybroeck, L. P. & O’Dell, S. L. 2000, SPIE, 4012
- White, Sarazin, & Kulkarni (2002) White, R. E. III., Sarazin, C. L., & Kulkarni, S. R., 2002, ApJ, 571, L23
- Williams et al. (1996) Williams R. E. et al., 1996, AJ, 112, 1335
| Name | R.A. | Dec | P.A.[o]1 | |||
|---|---|---|---|---|---|---|
| NGC 1399 | 03 38 29.32 | 35 27 00.7 | 10.55 | 31.4 | 0.07 | 0 |
| NGC 4374 | 12 25 03.74 | 12 53 13.1 | 10.09 | 31.2 | 0.13 | 135 |
| NGC 4472 | 12 29:46.76 | 07 59:59.9 | 9.37 | 31.2 | 0.18 | 155 |
| NGC 4486 | 12 30 49.42 | 12 23 28.0 | 9.59 | 31.2 | 0.21 | 0 |
| NGC 4636 | 12 42 50.00 | 02 41 16.5 | 10.43 | 31.2 | 0.22 | 150 |
| NGC 4649 | 12 43 40.19 | 11 33 08.9 | 9.81 | 31.2 | 0.19 | 105 |
1 Data from the RC3 catalog (de Vaucouleurs et al., 1991)
| Name | Obsid | Observation Date | Exposure1 |
|---|---|---|---|
| NGC 1399 | 319 | 2000-01-18 | 56 |
| NGC 4374 | 803 | 2000-03-19 | 27 |
| NGC 4472 | 321 | 2000-06-12 | 34 |
| NGC 4486 | 2707 | 2002-07-06 | 100 |
| NGC 4636 | 323 | 2000-01-26 | 42 |
| NGC 4649 | 785 | 2000-04-20 | 22 |
1 effective exposure times in unit of ksec
| Name | Observation Date | Telescope | Filters | references |
|---|---|---|---|---|
| NGC 1399 | 1999-12-07 | CTIO | 1 | |
| NGC 4374 | 1997-04-08 | KPNO | 2 | |
| NGC 4472 | 1993-02-26 | KPNO | 3,4 | |
| NGC 4486 | 1997-04-09 | KPNO | 2 | |
| NGC 4636 | 1997-04-10 | KPNO | 2 | |
| NGC 4649 | 1997-04-09 | KPNO | 2 |
| Name | Field | Texp [sec] | Program ID | |
|---|---|---|---|---|
| NGC 1399 | C1 | 5990 | ||
| C2 | 8214 | |||
| N | 9244 | |||
| S | 6352 | |||
| NGC 4374 | C | 6094 | ||
| NGC 4472 | C1 | 5236 | ||
| C2 | 5236 | |||
| N | 5920 | |||
| S | 5920 | |||
| NGC 4486 | C | 5477 | ||
| N1 | 6844 | |||
| N2 | 7274 | |||
| S | 6844 | |||
| NGC 4636 | C | 8686 | ||
| S | 8686 | |||
| NGC 4649 | C | 6286 | ||
| N | 7388 | |||
1 if not mentioned
2
| Parameter | NGC 4374 | NGC 4486 | NGC 4636 | NGC 4649 | NGC 44722 | NGC 13993 |
|---|---|---|---|---|---|---|
| 1.20 | 1.53 | 1.49 | 1.50 | 2.00 | 2.50 | |
| 0.065 | 0.125 | 0.256 | 0.216 | 0.175 | 0.099 | |
| PA | 67 | 159 | 148 | 112 | 155 | |
| 1.87 | 1.86 | 1.69 | 1.88 | 1.83 | ||
| 3.63 | 4.36 | 3.60 | 4.03 | 5.22 | 3.93 | |
| 0.016 | 0.320 | 0.326 | 0.224 | 0.200 | 0.17 | |
| PA | 67 | 159 | 148 | 112 | 155 | |
| 1.74 | 1.93 | 1.45 | 1.92 | 1.88 | ||
| 1.81 | 1.88 | 1.57 | 1.85 | |||
| logR=11 | 4.64 | 4.60 | 5.20 | 5.13 | ||
| logR=11 | 0.232 | 0.219 | 0.612 | 0.036 | 0.08 |
1 values computed between effective radius and standard radius
2 Kim, Lee, & Geisler (2000)
3 Dirsch et al. (2003)
| Name | |||||
|---|---|---|---|---|---|
| BGC | RGC | BGC | RGC | ||
| NGC 1399 | 1.00 .. 1.65 | 1.65 .. 2.20 | 0.65 .. 1.00 | 1.00 .. 1.45 | |
| NGC 4374 | 1.00 .. 1.55 | 1.55 .. 2.20 | 0.70 .. 1.08 | 1.08 .. 1.40 | |
| NGC 4472 | 1.00 .. 1.65 | 1.65 .. 2.20 | 0.75 .. 1.08 | 1.08 .. 1.45 | |
| NGC 4486 | 0.90 .. 1.65 | 1.65 .. 2.20 | 0.80 .. 1.13 | 1.13 .. 1.45 | |
| NGC 4636 | 0.90 .. 1.50 | 1.50 .. 2.10 | 0.75 .. 1.15 | 1.15 .. 1.50 | |
| NGC 4649 | 1.00 .. 1.65 | 1.65 .. 2.20 | 0.80 .. 1.15 | 1.15 .. 1.50 | |
| Region | Name | BGC | RGC | Contamination | |||||
|---|---|---|---|---|---|---|---|---|---|
| G1 | H2 | G1 | H2 | BGC | RGC | ||||
| NGC 1399 | 134 | 72 | 153 | 148 | 25 | 38 | |||
| NGC 4374 | 20 | 48 | 21 | 42 | 3 | 2 | |||
| NGC 4472 | 33 | 178 | 32 | 244 | 3 | 2 | |||
| NGC 4486 | 87 | 245 | 72 | 278 | 13 | 10 | |||
| NGC 4636 | 46 | 123 | 65 | 95 | 7 | 10 | |||
| NGC 4649 | 38 | 102 | 43 | 121 | 3 | 4 | |||
| total | 358 | 768 | 386 | 928 | 54 | 66 | |||
| NGC 1399 | 154 | 5 | 129 | 4 | 28 | 32 | |||
| NGC 4374 | 207 | 23 | 142 | 20 | 28 | 14 | |||
| NGC 4472 | 341 | 58 | 194 | 53 | 27 | 12 | |||
| NGC 4486 | 680 | 154 | 287 | 103 | 103 | 40 | |||
| NGC 4636 | 265 | 19 | 299 | 13 | 42 | 45 | |||
| NGC 4649 | 331 | 39 | 203 | 10 | 26 | 17 | |||
| total | 1978 | 298 | 1254 | 203 | 254 | 160 | |||
| NGC 1399 | 75 | 19 | 45 | 21 | 14 | 11 | |||
| NGC 4374 | 173 | 0 | 106 | 0 | 23 | 10 | |||
| NGC 4472 | 73 | 0 | 40 | 0 | 6 | 2 | |||
| NGC 4486 | 113 | 42 | 17 | 14 | 17 | 2 | |||
| NGC 4636 | 171 | 15 | 148 | 13 | 27 | 22 | |||
| NGC 4649 | 147 | 6 | 72 | 6 | 12 | 6 | |||
| total | 752 | 82 | 428 | 54 | 99 | 53 | |||
1 number of sources in optical ground observation only regions
2 number of sources in HST observation regions
| Region | Name | LMXBtot | BGCLMXB | RGCLMXB | FieldLMXB | |||
|---|---|---|---|---|---|---|---|---|
| G1 | H2 | G1 | H2 | |||||
| NGC 1399 | 107 | 5 | 5 | 28 | 12 | 29 | ||
| NGC 4374 | 24 | 0 | 3 | 2 | 2 | 13 | ||
| NGC 4472 | 76 | 1 | 5 | 5 | 24 | 33 | ||
| NGC 4486 | 46 | 3 | 4 | 5 | 9 | 20 | ||
| NGC 4636 | 23 | 1 | 2 | 2 | 5 | 13 | ||
| NGC 4649 | 48 | 0 | 1 | 7 | 15 | 21 | ||
| total | 324 | 10 | 20 | 49 | 67 | 129 | ||
| NGC 1399 | 52 | 10 | 1 | 17 | 0 | 15 | ||
| NGC 4374 | 33 | 3 | 0 | 2 | 0 | 18 | ||
| NGC 4472 | 50 | 6 | 1 | 13 | 1 | 22 | ||
| NGC 4486 | 65 | 9 | 0 | 16 | 6 | 26 | ||
| NGC 4636 | 62 | 5 | 0 | 18 | 0 | 17 | ||
| NGC 4649 | 79 | 10 | 1 | 18 | 2 | 31 | ||
| total | 341 | 43 | 3 | 84 | 9 | 129 | ||
| NGC 1399 | 18 | 3 | 0 | 3 | 0 | 8 | ||
| NGC 4374 | 15 | 2 | 0 | 2 | 0 | 3 | ||
| NGC 4472 | 4 | 0 | 0 | 1 | 0 | 2 | ||
| NGC 4486 | 1 | 0 | 0 | 0 | 0 | 0 | ||
| NGC 4636 | 12 | 1 | 0 | 2 | 0 | 8 | ||
| NGC 4649 | 12 | 1 | 0 | 0 | 0 | 9 | ||
| total | 62 | 7 | 0 | 8 | 0 | 30 | ||
1 number of sources in optical ground observation only regions
2 number of sources in HST observation regions
| Name | N(LMXB) | N(OPT) | ||||||||
|---|---|---|---|---|---|---|---|---|---|---|
| BGC | RGC | Field | BGC | RGC | ||||||
| NGC 1399 | 21 | 57 | 44 | 365 | 434 | |||||
| NGC 4374 | 6 | 6 | 31 | 298 | 225 | |||||
| NGC 4472 | 13 | 43 | 55 | 610 | 523 | |||||
| NGC 4486 | 16 | 36 | 46 | 773 | 740 | |||||
| NGC 4636 | 8 | 25 | 30 | 453 | 472 | |||||
| NGC 4649 | 12 | 42 | 52 | 510 | 377 | |||||
| total | 76 | 209 | 258 | 2736 | 2771 | |||||
1 point sources for .
2 efficiency to harbor LMXB in % for blue-GCs, defined by N(LMXBBGC)/N(OPTBGC)
3 same as 2 but for red GCs
4 same as 2 but for all GCs
| Sample | Parameter | |||
|---|---|---|---|---|
| C21 | ||||
| BGCLMXB | C32 | |||
| HR | ||||
| C21 | ||||
| RGCLMXB | C32 | |||
| HR | ||||
| C21 | ||||
| GCLMXB | C32 | |||
| HR | ||||
| C21 | ||||
| fieldLMXB | C32 | |||
| HR |
| Sample | Slope | Sample | Slope | ||
|---|---|---|---|---|---|
| BGC | BGCLMXB | ||||
| () | () | () | () | ||
| RGC | RGCLMXB | ||||
| () | () | () | () | ||
| GC | GCLMXB | ||||
| () | () | () | () | ||
| Halo | fieldLMXB | ||||
| ALLLMXB |
1 Numbers in parenthesis are fitting result for the background-corrected GC sample based on Fig. 5.
![[Uncaptioned image]](/html/astro-ph/0510817/assets/x2.png)
Fig. 1 continued: Observation field of view for NGC 4374.
![[Uncaptioned image]](/html/astro-ph/0510817/assets/x3.png)
Fig. 1 continued: Observation field of view for NGC 4472.
![[Uncaptioned image]](/html/astro-ph/0510817/assets/x4.png)
Fig. 1 continued: Observation field of view for NGC 4486
![[Uncaptioned image]](/html/astro-ph/0510817/assets/x5.png)
Fig. 1 continued: Observation field of view for NGC 4636.
![[Uncaptioned image]](/html/astro-ph/0510817/assets/x6.png)
Fig. 1 continued: Observation field of view for NGC 4649.