Radio polarization and sub-mm observations of the Sombrero galaxy (NGC 4594)††thanks: Based on observations with the 100-m telescope of the MPIfR (Max-Planck-Institut für Radioastronomie) at Effelsberg
We observed the nearby early-type spiral galaxy NGC 4594 (M 104, Sombrero galaxy) with the Very Large Array at 4.86 GHz, with the Effelsberg 100-m telescope at 8.35 GHz as well as with the Heinrich Hertz Telescope at 345 GHz in radio continuum. The 4.86 and 8.35 GHz data contain polarization information and hence information about the magnetic fields: we detected a large-scale magnetic field which is to our knowledge the first detection of a large-scale magnetic field in an Sa galaxy in the radio range. The magnetic field orientation in M 104 is predominantly parallel to the disk but has also vertical components at larger z-distances from the disk. This field configuration is typical for normal edge-on spiral galaxies. The 345 GHz data pertain to the cold dust content of the galaxy. Despite the optical appearance of the object with the huge dust lane, its dust content is smaller than that of more late-type spirals.
Key Words.:
Galaxies: individuals: NGC 4594 (M 104) – peculiar – spiral – structure – ISM – radio continuum: galaxies – polarization – magnetic fields1 Introduction
The early-type spiral galaxy NGC 4594 has a spectacular appearance in the optical range with a huge bulge and a prominent dust lane. It is classified as Sa galaxy at a distance of (i.e. are 0.43 kpc) (Ford et al. 1996). A conspicuous dust lane is obvious in all colour photographs. The dust is distributed in a ring (possibly in two rings) with a radius (7.3 kpc) (e.g. Dettmar 1986; Wainscoat et al. 1990).
The rotation curve of the galaxy shows a very steep rise in the central part, with a first maximum at a radius of (430 pc), then again rising to an unusually high rotation velocity of about 350 km/s up to kpc (Rubin et al. 1985; Wagner et al. 1989). H i line observations of Bajaja et al. (1984) showed two ring/spiral arm structures at (6 kpc) and from the nucleus. Emission from molecular CO gas was detected only in the inner ring, at a distance of from the nucleus (Bajaja et al. 1991).
However, there are numerous observations that suggest that NGC 4594 is a ‘normal’ spiral galaxy: the stellar disk resembles a typical spiral galaxy (Burkhead 1986) which was modelled by a two-armed spiral pattern (van der Burg & Shane 1986). Recently, the thin spiral disk has been directly revealed by the HST (Hubble Heritage Project, Christian et al. 2003).
Optical studies and a spatial photometric model by Emsellem (1995) suggested that not only extinction but also light scattering by dust is important in NGC 4594. They concluded that the galaxy would even appear ”dust free” if it had been viewed face-on. They further estimated the dust content and concluded that significant cold dust should be present in NGC 4594 which should be detectable in the mm/sub-mm wavelength range.
Radio continuum observations of NGC 4594 have at first shown only the strong (and variable) central source (e.g. de Bruyn et al. 1976). With improved dynamic range the disk emission of NGC 4594 was detected (Bajaja et al. 1988). The optical polarization observations of Scarrott et al. (1977) suggested the existence of large-scale magnetic fields, but these were so far not detected in the radio frequency range.
In view of the contradictory publications about the nature of NGC 4594 we decided to make new observations. In this paper we present VLA observations at 4.86 GHz and observations with the Effelsberg 100-m telescope at 8.35 GHz, both in total intensity and in linear polarization. As a result we can trace the large-scale magnetic field in NGC 4594.
We also observed NGC 4594 in the submm range with the HHT at 345 GHz in order get information about the cold dust component and compare this with the model of Emsellem (1995).
The observations and data reduction are described in Sect. 2 and the observational results are presented in Sect. 3. In Sect. 4 we discuss the disk thickness, the magnetic field, the cold dust and the star formation rates and efficiencies. A summary is given in Sect. 5.
For our analysis we have adopted the commonly assumed values for the inclination of the disk as and the position angle of the major axis as . All values taken from the literature are scaled to the ’new’ distance of for NGC 4594.
2 Observations and data reduction
2.1 Observations with the VLA
NGC 4594 has been observed in total power and linear polarization at cm with the Very Large Array (VLA)111The VLA is a facility of the National Radio Astronomy Observatory. The NRAO is operated by Associated Universities, Inc., under contract with the National Science Foundation. of the National Radio Astronomy Observatory in its D-configuration. Relevant observational parameters are summarized in Table 1. We used 3C 286 and 3C 138 as flux calibrators for the total intensity and for the calibration of the polarization angle. 1243072 was used as phase calibrator.
The calibration and data reduction were performed with the standard AIPS package at the MPIfR. The data were collected in 2 different periods of 8 hours each in April 1995 with 27 days between the two periods. The calibration and the correction for the antenna polarizations had to be done separately for both observing periods. The UV data were self-calibrated separately in phase and amplitude for both observing periods before they were combined. These combined data were again self-calibrated in phase and amplitude resulting in maps with the natural weighting function. The resulting maps have synthesized beams with HPBW. The rms noise levels for this angular resolution and also for maps smoothed to and HPBW are given in Table 1.
| Field centre | |||
|---|---|---|---|
| B1950 | |||
| J2000 | |||
| Observing period | April 03, 1995 8 hours | ||
| April 30, 1995 8 hours | |||
| Frequency | 4.8351 GHz | 4.8851 GHz | |
| Bandwidth | MHz | ||
| Shortest spacing | 73 m | ||
| Longest spacing | 3.4 km | ||
| Synthesized beam | 23″ | 30″ | 84″ |
| rms noise (I) [Jy/b.a.] | 10 | 10 | 25 |
| rms noise (PI) [Jy/b.a.] | 7 | 7 | 17 |
2.2 Observations with the Effelsberg 100-m telescope
The Effelsberg cm (8.35 GHz) observations were made with a receiver in the secondary focus of the 100-m telescope. The single-beam receiver has two channels (RHC, LHC) with total-power amplifiers and an IF polarimeter. The bandwidth is 1.1 GHz, the system noise temperature about 25 K and the resolution is 836.
We obtained 30 coverages in total of NGC 4594 in February and July 2003. Each coverage has a map size of and was scanned along (resp. perpendicular) to the major axis of the galaxy with a scanning velocity of and a grid size of . For pointing and focussing we observed regularly the source 3C 286. After the observations the pointing was checked again on the strong central radio source of NGC 4594 and corrected if necessary. The flux calibration was also done with 3C 286 according to the flux values of Baars et al. (1977). All coverages were combined (Emerson & Graeve 1988). The total power map was cleaned for the side lobes of the dirty beam of the strong central source. This was not necessary for linear polarization. The central source itself is not polarized. Map features smaller than the telescope beam appearing in the final maps were filtered out using a Fourier filter technique. The final maps were slightly smoothed to an angular resolution of HPBW leading to an rms noise level of the final maps of Jy/beam in total power and Jy/beam in linear polarization.
2.3 Observations with the HHT
We observed NGC 4594 at m with the Heinrich-Hertz-Telescope (HHT)222The HHT was at that time operated by the Submillimeter Telescope Observatory on behalf of Steward Observatory and the MPI für Radioastronomie (Baars et al. 1999) on Mt. Graham, Arizona with the 19-channel bolometer array developed by E. Kreysa of the MPIfR. The HPBW of the telescope is at this frequency. The central frequency of the bolometer is about 345 GHz with the highest sensitivity at about 340 GHz. The instrument is sensitive between 310 and 380 GHz.
The observations were made in March 2000 under varying weather conditions. To calculate the atmospheric opacity we made sky dips regularly. For flux calibration purposes we used the planet Saturn, observed regularly during our observing sessions.
All maps were observed in the Azimuth–Elevation system, by scanning in azimuth and performing data acquisition every 0.5 s. During the observations, the subreflector was wobbled at 2 Hz in azimuth with a beam throw between and . In total we observed 22 coverages of NGC 4594, centered on two different positions located east and west of the nucleus, respectively. The field size of each individual coverage was .
The data reduction of these observations was performed with the NIC program of the GILDAS software package. Additional information about HHT observations and the reduction can be found in Dumke et al. (2004). After baseline subtraction and the elimination of spikes in each single bolometer channel, the atmospheric noise, which is correlated between the 19 channels, was subtracted. The maps were gridded, restored, converted into the RA–Dec system and finally combined with an appropriate weighting. The zero-level of the resulting map was checked and carefully adjusted. Map features smaller than the telescope beam appearing in the final maps were again filtered out using a Fourier filter technique and the map was slightly smoothed to HPBW. The rms noise level of the final map is about 45 mJy/beam.
3 Results
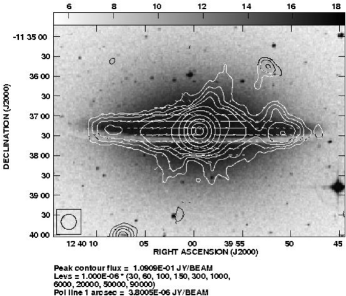
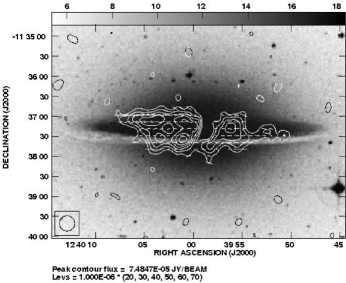
The total intensity map at cm in the full resolution (HPBW ) including the central source is shown in Fig. 1. The map is superimposed on an optical photograph (DSS) of the galaxy. We see clearly several spur-like features in addition to the nuclear source and the extended disk emission. The agreement with the cm map of Bajaja et al. (1988) is good. We will discuss this aspect in Sect. 3.2.
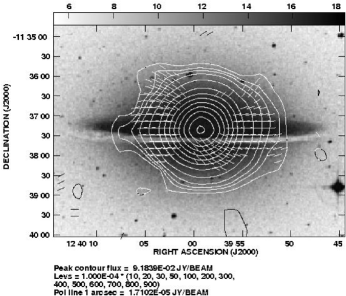
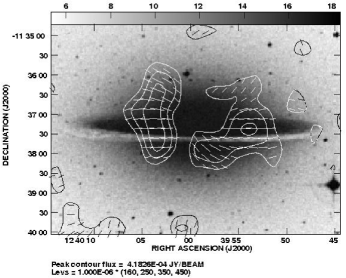
The total intensity map at cm is shown in Fig. 2, also with the DSS as grey plot. The map has an angular resolution of . Again, we see the strong central source with some emission of the extended disk.
3.1 The central radio source
The nucleus of NGC 4594 was identified as a LINER by Heckman (1980). Inside the central Burkhead (1986) detected an ”inner disk”. First evidence for a central black whole with a mass was given by Kormendy (1988) which could later be confirmed by HST observations (Kormendy et al. 1996).
With our angular resolution between and HPBW (corresponding to kpc) we cannot resolve the nucleus and its surroundings. Hence, we can only give flux densities for the central region at our observed frequencies.
We fitted a Gaussian to the central source at cm and find at our epoch a flux density of mJy. Our present value lies within the range of values compiled by de Bruyn et al. (1976). We could not observe any significant variations of the relative flux density ( mJy) between the two observing periods that were separated by 27 days.
Bajaja et al. (1988) compiled nuclear flux density values at cm for the period 1971–1986. At this wavelength the nuclear flux density remained rather constant between 1971 and 1980 while it increased in the following 4 years by about . The flux density dropped after 1985. Unfortunately, we could not find recent flux density values at cm in the literature to follow the temporal evolution in detail.
A Gaussian fit to the central source at cm gives a flux density of mJy.
3.2 The extended continuum emission
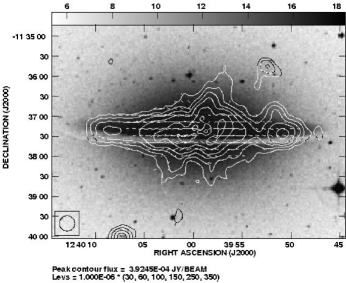
We subtracted the central source by fitting a Gaussian to the peak emission from the map in Fig. 1. This allows us to study the extended disk component as shown in Fig. 3. The extended disk emission shows four maxima along the major axis and several spurs at high z-values. The two outer, most prominent peaks along the major axis are located at a distance of about east and west of the nucleus. This is near the position of the inner HI ’ring’ () as found by Bajaja et al. (1984) and the location of detected molecular gas in NGC 4594 (r, Bajaja et al. 1991). The peaks at cm are further in the region of the dust rings and coincide with the peaks in the radio continuum observations at cm (Bajaja et al. 1988). Rather than a ring, they may outline the tangential directions of spiral arms in NGC 4594.
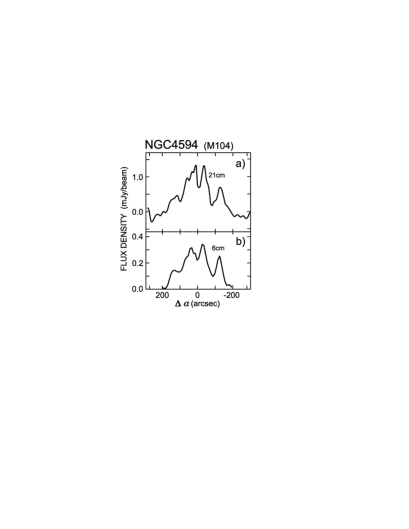
The two additional maxima in the central disk area can best be investigated by studying the intensity distribution along the major axis. These cuts were made for both, cm and cm, and are shown in Fig.4. They look very similar with only some small differences between the two cuts. The inner maxima at are nearly equally high, indicating the same spectral index. The eastern inner maximum has an additional structure along the axis. Also the maxima at have a similar ratio east and west of the nucleus, respectively.
Integrating the total intensity (without the central source) in ellipses leads to an integrated flux density of at cm. The integrated flux density at cm is found to be 13.4 mJy (Bajaja et al. 1988). Hence, the averaged spectral index for NGC 4594 is . This value is typical for a synchrotron spectrum (cf. also Sect. 4.2.2). It may, however, still be influenced by missing spacings in both maps and the amount of their effect is difficult to estimate.
The spurs at high z-values seen in both, the cm map and the cm map (Fig.1 in Bajaja et al. (1988)), are in similar positions, suggesting outflows as a result of central activity of NGC 4594. The spurs at cm are more pronounced than at cm,. This may indicate a thermal origin, suggesting that H emission is involved in the outflow.
3.3 The polarized emission
The cm data show considerable linear polarization in the disk (see Fig. 5). In both, the central area and also the outer disk region polarized emission has definitively been detected. Bajaja et al. (1988) suggested a preliminary detection of linear polarization mainly outside the disk along a spur at cm with an orientation of the magnetic field along the spur.
The orientation of the vectors in Fig.1, Fig.3 and Fig. 5 gives the orientation of the observed electric field rotated by , hence roughly the magnetic field orientation (as Faraday rotation is small in NGC 4594 (cf. Sect. 4.2.1). (Note that the extension of the vectors plotted in the figures is slightly different as we plotted the vectors up to the first contour in each figure which corresponds to about in Fig.1 and Fig.3 but to in Fig.5). The vectors are orientated regularly, mainly parallel to the galactic disk. Deviations from the alignment with the disk are seen mainly above and below the disk (see also Fig. 1) and indicate vertical magnetic field components. The lengths of the vectors are proportional to the degree of linear polarization. It is rather high with values between 20% and 30%.
The integrated flux density in polarized emission is . This leads to an averaged degree of linear polarization of over the whole galaxy.
The observation at cm with the 100-m Effelsberg telescope also clearly shows linear polarized emission (Fig. 2 and Fig. 6). Due to the rather low angular resolution of only HPBW and the higher frequency we can only detect the main polarized regions. The vector orientation suggests good agreement with those at cm. The correction of Faraday rotation and the deduced magnetic field orientation will be described in Sect. 4.2.1.
The degree of linear polarization is only around 10%, most probably because of strong beam depolarization due to the large beam size.
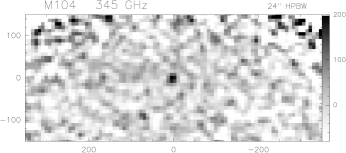
3.4 Dust emission
We have also observed the radio continuum emission of the dust at m in NGC 4594 as described in Sect. 2. The final map is shown in Fig. 7. This map has the original resolution of HPBW and shows no significant emission at m in the disk of NGC 4594 above the noise level of about 45 mJy/beam. At the upper left and right corner of the map we see an increase of the noise level at the edge of the coverage area. Also smoothing the map to HPBW gives no hint to an extended emission at this wavelength in the disk NGC 4594. However, Fig. 7 clearly reveals the emission of the nuclear region at m with mJy as described in Sect. 3.1. Within the central (200pc), a nuclear dust lane with a weak symmetric counterpart was observed by Emsellem (1995). This feature was later interpreted by Emsellem & Ferruit (2000) as a nuclear bar with a projected length of (50pc). The dust lane may be at least partly responsible for our central dust emission which cannot be resolved by our observations.
4 Discussion
4.1 Disk thickness
In order to determine the thickness of the synchrotron emission at cm we examined the distribution of the radio emission perpendicular to the disk plane ( i.e. in z-direction). We applied a procedure as described by Dumke et al. (1995): we made a strip integration of the total intensity (Fig.3) in z-direction with strips parallel to the major axis east and west of the nucleus and a width of . We varied the length of each strip parallel to the major axis between and up to distance of from the nucleus.
The z-distribution of the total intensity of NGC 4594 does not only reflect its disk height but is also affected by inclination effects and the beamwidth of the observations. We corrected for this as described by Dumke et al. (1995) and fitted either a Gaussian or an exponential function to the z-distribution, either with one component or two components. Least-square fits show lowest values for a single component Gaussian distribution.
The resultant scale height for the disk thickness of the cm radio emission in NGC 4594 is ( kpc) within (4.3kpc) (note that the larger value of 3kpc given in Krause (2003) refers to the same analysis but assumed a larger distance of NGC 4594). The scale height for the linearly polarized emission has about the same value.
This result differs from the analysis of other spiral galaxies seen edge-on, like NGC 891, NGC 3628, NGC 4565, and NGC 5907 (Dumke & Krause 1998; Dumke et al. 2000). In all those galaxies the z-distribution of the radio emission was better described by a two component exponential function with very similar scale heights for all these galaxies of 300pc for the thin and 1.8kpc for the thick disk. In contrast to those galaxies, NGC 4594 has a huge bulge with an elliptical mass distribution. The expected z-distribution of a relatively thin layer (the disk) inside a nearly spherical gravitational potential is in fact a Gaussian (Combes 1991).
4.2 Magnetic field
4.2.1 Faraday rotation and magnetic field structure
The observed electric vectors are rotated by the Faraday effect. The amount of Faraday rotation can be determined by calculating the rotation measure RM between different wavelengths. Correction of the observed electric vectors according to these RMs and rotation by leads to the intrinsic direction of the magnetic field in the sky plane. The RM value itself depends on the strength of the magnetic field component parallel to the line of sight, its sign indicates the direction of this parallel field component.
We determined the RM between 3.6 cm and 6.2 cm at an angular resolution of HPBW, the resolution of the 3.6 cm observations. We determined the RM only for those points for which the polarized intensity exceeds 2 times the noise value at that wavelength, resp. The calculated RM lies in the range between with most values between . The ambiguity (i.e. the RM value that corresponds to a Faraday rotation of ) between these two wavelengths is as high as for n=1 and hence not relevant. This also implies that M104 is Faraday thin at both wavelengths. As there are no strange jumps in the RM map and the degree of linear polarization is quite similar at both wavelengths when smoothed to the same resolution of HPBW, we can assume that the dependence of the RM is valid (Sokoloff et al. 1998).
We do not see a systematic change of the RM values above and below the major axis of NGC 4594 that would indicate a systematic change (of the direction) of the line of sight component of the magnetic field above and below the major axis. The RM structure looks quite smooth with both, positive and negative values on both sides of the galaxy along the major axis.
We estimated the galactic foreground rotation measure towards NGC 4594 by averaging the RM values of background sources within a distance of from NGC 4594 (Simard-Normandin et al. 1981, P. Kronberg, priv. comm.). We omitted two very strongly deviating sources as their RM values may rather reflect their intrinsic Faraday rotation than the galactic RM. The average of the remaining 18 sources is . Also within their errors it infers an additional rotation at 6.2 cm of at most . We conclude that the foreground RM is negligible and that the observed RM is exclusively associated with NGC 4594.
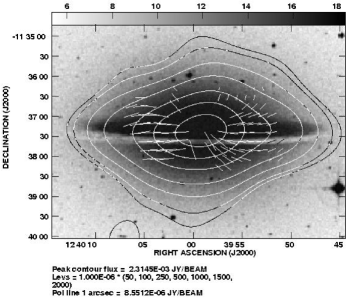
The corresponding corrections for Faraday rotation for most of the observed electric vectors at 6.2 cm is smaller than (). The corrected vectors, rotated by , are shown in Fig.8 superimposed on the smoothed 6.2 cm total intensity map of the disk emission (the central source has been subtracted before smoothing). The vectors give the intrinsic magnetic field orientation in NGC 4594 at the angular resolution of HPBW. Because of the large beam size compared to the angular extent of NGC 4594 and the small signal-to-noise ratio of the polarized emission at 3.6 cm, this correction is still quite coarse. Especially the small signal-to-noise ratio at 3.6 cm of may lead to an uncertainty on position angle of about for each single data point. Together with the (smaller) uncertainty at 6.2 cm the error in each single data point in the RM may be even . However, the smooth appearance of the RM-map and the similarity of the observed vectors at 3.6 cm (Fig.6) with those at the better linear resolution at 6.2 cm (Fig.5) indicates strongly that the true errors in the RM are much smaller. Further, the signal-to-noise ratio at 6.2 cm is as large as , inferring an error on position angle of only .
Hence, from Fig.8 we can deduce conclusions for the magnetic field structure in NGC 4594 which are in full agreement with the higher resolved map in Fig.5: along the inner galactic disk the magnetic field orientation is mainly parallel to the disk in the midplane except in the innermost . There and generally at higher z-values above and below the disk the magnetic field has also significant vertical components.
4.2.2 Magnetic field strength
We estimated the magnetic field strength in the two regions of highest linear polarization east and west of the nucleus at from the values of the cm map with HPBW angular resolution (see Fig. 5). The estimation has been done under the assumption of energy-density equipartition between the energy of the magnetic field and cosmic ray electrons with the revised formula (Beck & Krause 2005). The revised formula is based on the integration of the energy spectrum of the cosmic-ray protons and not on the integration over the radio frequency spectrum which introduces an implicit dependence on the field strength. We adopt a cosmic ray proton to electron ratio of , as in earlier publications.
The spectral index between 6.2 cm and 20 cm for these two regions was estimated to (east) and (west) which is very well in agreement with the value averaged for 74 external galaxies (Niklas et al. 1997) and not far away from the estimated integrated spectral index for this galaxy (, see Sect. 3.2). Assuming the values of Niklas et al. (1997) for the thermal fraction of 20% at 6.2 cm and 8% at 20 cm, we obtain a nonthermal spectral index for both regions of about 0.85. The nonthermal degree of linear polarization is found to be 29% (east) and 30% (west). We assumed (I) a mainly toroidal field configuration plane parallel to the disk of the galaxy with an inclination of (i.e. nearly edge-on) and a line of sight of 9kpc or (II) strong vertical field components () with a line of sight of 4kpc. In both cases the resulting field strengths for both regions are for the total field and for the regular magnetic field component with a cosmic energy density . The averaged total field strength estimated from the integrated intensity at cm averaged over the whole galaxy (without the central source) is with . Hence, the magnetic field strengths in NGC 4594 are in the lower range of those of normal spiral galaxies (e.g. Krause 2003; Beck 2004).
4.3 Morphology: bulge, bar and magnetic field
From the Hubble Heritage image of NGC 4594 it can clearly be seen that NGC 4594 is a galaxy with a thin disk that is structured, possibly by spiral arms, and an enormous halo or bulge (Christian et al. 2003). There has been a long and controversial discussion in the literature about the huge spherical bulge in NGC 4594. An appealing explanation is that the spherical bulge is due to a dissolving bar. Such a dynamical interpretation of the ring/spiral structure, a dissolved bar and possibly a bulge formation has first been proposed by Emsellem (1995). It was already known at that time that the colour of the bulge is about similar to that of the disk (Dettmar 1986). Later simulation of galaxy evolutions (e.g. Combes 2000) revealed that bulges can indeed form by dynamical evolution of disks through bars. If a bar extends about up to the corotation radius, a ring or tightly wound spiral structure can form. While the bar starts to decrease again in the further evolution, the spiral structure gets less tightly w ound and a spherical bulge may evolve. Similar simulations have successfully described e.g. the bar/spiral structure of NGC 7331 (von Linden et al. 1996).
Bars can even form and dissolve several times during the evolution of a galaxy. Bournaud & Combes (2002) concluded from their galaxy simulations that the pattern speed of the bar increases from one bar to the next while the new bar is shorter than the previous one. Hence a galaxy may be shifting progressively to early-types, with massive bulges. As the dissolving of a bar is a relatively short-living period compared to the galaxy’s lifetime, we expect to observe this evolutionary phase only in a few number of galaxies.
We note here, that Emsellem & Ferruit (2000) found strong indications for the existence of a nuclear bar in NGC 4594 inside a radius of from the nucleus.
The view of NGC 4594 of a ’normal’ early type, spiral galaxy seen edge-on is further supported by the magnetic field structure that we deduced from our observations: the magnetic field orientation is mainly parallel to the galactic disk for low z-values but shows also significant vertical components for higher z-values (cf. Sect. 4.2.1). Such a configuration has been observed for many other (also late-type) galaxies seen edge-on, like e.g. NGC 4631 (Krause 2003), NGC 5775 (Tüllmann et al. 2000), and recently for NGC 891 (Krause et al., in preparation).
It is interesting to note that the region of strong polarized intensity (cf. Fig. 5 at cm, the map with the highest linear resolution) is just within the range between the inner and the outer Lindblad resonances: and as estimated by Emsellem (1995) and (Emsellem et al. 1996). The latter authors separated the rotation velocity in that of the disk and the bulge and found a very fast increasing rotation curve for the disk with velocities of 280 km/s at a radius of only 6″. The velocity in the HI/CO ring/spiral is about 350 km/s (Bajaja et al. 1991), hence the rotation curve between the ILR and OLR is rather flat. The strong differential rotation in this radial range supports the action of a mean field dynamo (e.g. Ruzmaikin et al. 1988) that may be responsible for the observed uniform magnetic field in NGC 4594.
In Fig. 5 we see two clear maxima at a radius of only about (1.7 kpc) from the nucleus in linear polarization at cm. This might indicate the existence of another ring or a spiral arm structure nearby. It should be possible to reveal such a structure by a detailed analysis of the HST images of NGC 4594.
4.4 Cold dust
The dust distribution in NGC 4594 was studied by Emsellem (1995) on the basis of multi-color images. This study used multi-Gaussian expansion technique to determine via the optical depth the mass of the dust. From this modeling they came to the conclusion that the major part of the dust (%) should be cold ( K) and concentrated between and distance from the nucleus. This could however not directly be observed by Emsellem.
From the noise level of our HPBW map (rms = 40 mJy/beam) we estimated that any extended emission in the disk of NGC 4594 adds up to a flux density . This is significantly smaller than corresponding values for other spiral galaxies like e.g. NGC 4631 (, Dumke et al. 2004) or NGC 3628 (, Dumke et al. 2003).
We have plotted the upper limit for the flux density at m together with the IRAS values for NGC 4594 at m (Young et al. 1989) in Fig. 9. Also the IRAS flux density values of NGC 4594 are rather low compared to the corresponding values of the other 17 Sa galaxies in the sample of Young et al. (1989).

We fitted the FIR-to-mm spectrum with a dust model consisting of two components of large grains with different temperatures, both with (see below), similar to the procedure in Dumke et al. (2004) for NGC 4631. The result is also shown in Fig. 9 where the solid curve shows a two-component modified Planck spectrum with temperatures of 54 K and 22 K. The location of the maximum of the cold component (and therefore its temperature) depends strongly on the data points at m and m. Since the m value is an upper limit, we can only obtain a lower limit for the temperature of the cold component: because of Wien’s law, decreasing would lead to a higher fitted dust temperature. Similarly, decreasing would lead to a lower fitted temperature. Thus – to really obtain a lower limit – we used (i.e. the lower edge of the error bar) as data point for the temperature fit, as it can be seen in Fig. 9.
This lower limit for the temperature of the cold dust component enables us to roughly estimate an upper limit for the cold dust mass in NGC 4594. Following the procedure in Emsellem (1995), using an average grain size of m, the grain density and emissivity given by Hildebrand (1983) for m with and the relation
where is the IRAS flux in mJy at wavelength m), distance D (Mpc) and temperature (K). With T = 22K, the upper limit for the m flux infers an upper limit for the cold dust mass of . The mass of the ’warm dust’ as given by Emsellem (1995) and corrected for the distance of 8.9 Mpc is . Hence, our upper limit for the cold dust mass lies well above Emsellem’s value for the warm dust and allows that more than of the dust mass is indeed cold as inferred from Emsellem’s light scattering model.
However, the observation of the cold () dust in the submm wavelength range is quite difficult because of the exponential dependence of the dust mass on the dust temperature and the observed wavelength (cf. the formula above). The expected flux density is much higher at wavelengths between m. Indeed, the detection of a dust ring in NGC 4594 at m by Spitzer observations has recently been reported by Bendo et al. (2004).
The total HI mass in NGC 4594 is estimated to be (Bajaja et al. 1984) and the total mass is (Bajaja et al. 1991), both corrected for our adopted distance of 8.9Mpc. Hence, the total gas mass in NGC 4594 is . The estimated upper limit for the mass of the cold dust is of the total gas mass. This upper value for NGC 4594 is equal to the value in the Milky Way (Sodroski et al. 1994) and at the lower end of the range estimated for M 31 (Nieten et al. 2005).
4.5 Star formation rates and efficiencies
As mentioned above, the FIR to submm flux densities of NGC 4594 are rather weak compared to other galaxies. The FIR luminosity of NGC 4594 as given by Young et al. (1989) and corrected for the distance of 8.9 Mpc is (respectively ), hence . The radio flux density of the disk of NGC 4594 at 20 cm is 13.4 mJy (Bajaja et al. 1988), giving a radio luminosity of . The corresponding data point lies at the low radio luminosities of the radio-FIR-correlation of Condon et al. (1991) and of Niklas (1997). In both samples of the radio-FIR relation the total radio luminosity has been considered, including the nuclear fluxes of the galaxies. If we include the nuclear flux also for NGC 4594, the total radio luminosity is . With this radio luminosity, NGC 4594 fits right above the best fit line in the radio-FIR correlation diagram of Niklas (1997).
The molecular gas as derived from CO measurements by Bajaja et al. (1991) (corrected for the distance of 8.9 Mpc) is . This leads to a star formation efficiency SFE of according to the definition of Young et al. (1989). The SFE for early-type galaxies does not generally differ from those of late-type galaxies (Thronson et al. 1989) and the value of NGC 4594 is rather but not extremely low.
The star formation rate SFR can be estimated from the or FIR luminosities which leads for NGC 4594 to quite different values. Following the procedure described by Thronson et al. (1989) we derive from the flux density of Schweizer (1978) a SFR of for D = 8.9 Mpc which is only about of the SFR in M 31 (Walterbos 2000). From the FIR luminosity we derive with the formula given by Thronson et al. (1989) a SFR of . The difference between and may partly be due to the dust that leads to extinction of the emission. Simultaneously, there may be additional FIR radiation by a cool ’cirrus’ component that does not come from star formation but from dust heated by the general interstellar radiation field. Furthermore, the FIR emission includes the nuclear emission as well. Its contribution in the (submm) range is more than and may be similar in the FIR.
According to Niklas & Beck (1997) the SFR scales with the equipartition magnetic field strength as . The averaged equipartition magnetic field strength of a sample of 74 spiral galaxies is (Niklas 1995). While the total equipartition field strength for is , the averaged total magnetic field strength in NGC 4594 was estimated to be (Sect. 4.2.2). This value is below the one of Niklas’ sample and somewhat lower than the averaged total field strength of M 31 (type Sb) and M 33 (type Sc) (which is according to Beck (2000). The above relation expects the SFR in NGC 4594 to be a factor of about 10 lower than galaxies with an averaged total field strength of . With the field strength given for M 31, the SFR in NGC 4594 is expected to be of the value for M 31 in accordance with the SFRs for both galaxies as estimated from their emission (see last chapter).
5 Summary
We observed NGC 4594 in a wide wavelength range in radio continuum: with the VLA at 6.2 cm in its D-array, with the Effelsberg 100-m telescope at 3.6 cm, both also in linear polarization, and with the HHT at . At 6.2 cm we detected extended disk emission with a similar distribution along the major axis as at 20 cm by Bajaja et al. (1988) and some extended spurs suggesting outflows.
From the 6.2 cm total intensity we also determined the thickness of the galactic disk in NGC 4594. Least-square fits to the z-distribution show lowest values for a single component Gaussian distribution different from other spiral galaxies seen edge-on whose z-distribution can be best described by a two-component exponential function (with scale heights of 300pc and 1.8 kpc) (Dumke & Krause 1998). The resultant scale height for the disk thickness in NGC 4594 is 1.5kpc () within (4.3kpc). The Gaussian shape may be due to the huge bulge in NGC 4594 as it is expected for a relatively thin layer (the disk) inside a nearly spherical potential (Combes 1991).
For the first time, we detected extended linear polarization in the radio range in NGC 4594 with an average degree of polarization of over the whole galaxy and local values as high as 20% to 30%. This is to our knowledge the first detection of a large-scale magnetic field in an Sa galaxy in the radio range.
The Faraday rotation could be determined between 6.2 cm and 3.6 cm to be in the range of with most values between . Correcting for Faraday rotation leads to the intrinsic magnetic field orientation which is parallel to the galactic disk in the midplane except in the innermost . There and generally at higher z-value above and below the disk the magnetic field has also significant vertical components.
Under the assumption of equipartition the magnetic field strength in NGC 4594 was estimated to be for , whereas the averaged total magnetic field strength in NGC 4594 was estimated to be (Sect. 4.2.2). Hence, the magnetic field strengths in NGC 4594 are in the lower range of those of normal spiral galaxies.
The polarized intensity is concentrated in the radial range between the ILR and OLR as estimated by Emsellem (1995) and Emsellem et al. (1996). In this radial range, the rotation velocity is as high as about 300 km/s and the rotation curve of the disk is only slightly increasing. The strong differential rotation there supports the action of a mean field dynamo that may be responsible for the observed uniform magnetic field in NGC 4594.
At m we detected the central source with a flux density of mJy. We could not detect extended emission at this wavelength with our sensitivity of 40 mJy/beam with HPBW. However, we estimated an upper limit of a possible dust emission between (as expected e.g. by Emsellem (1995)) below our noise level to .
A two-component fit of the dust spectrum (our upper limit for together with the IRAS values of Young et al. (1989)) gives a lower limit for the temperature of the cold dust component of . This temperature enables us to roughly estimate an upper limit for the cold dust mass in NGC 4594 to which agrees with the cold dust mass claimed by Emsellem (1995) in his model including light scattering by dust.
Acknowledgements.
We thank the staff of the HHT, the VLA and the Effelsberg 100-m telescope for their excellent support. We acknowledge discussions with S. v. Linden about galaxy evolution in simulations and thank R. Beck for helpful comments on the manuscript.References
- Baars et al. (1977) Baars, J. W. M., Genzel, R., Pauliny-Toth, I. I. K., & Witzel, A. 1977, A&A, 61, 99
- Baars et al. (1999) Baars, J. W. M., Martin, R. N., Mangum, J. G., McMullin, J. P., & Peters, W. L. 1999, PASP, 111, 627
- Bajaja et al. (1988) Bajaja, E., Hummel, E., Wielebinski, R., & Dettmar, R.-J. 1988, A&A, 202, 35
- Bajaja et al. (1991) Bajaja, E., Krause, M., Wielebinski, R., & Dettmar, R.-J. 1991, A&A, 241, 411
- Bajaja et al. (1984) Bajaja, E., van der Burg, G., Faber, S. M., et al. 1984, A&A, 141, 309
- Beck (2000) Beck, R. 2000, in Berkhuijsen, E.M., Beck, R., & Walterbos, R.A.M. (eds.), “The interstellar medium in M 31 and M 33”. Proc. 232. WE-Heraeus Seminar, Shaker Verlag, Aachen, p. 171
- Beck (2004) Beck, R. 2004, Ap&SS, 289, 293
- Beck & Krause (2005) Beck, R. & Krause, M. 2005, Astronomical Notes, 326, 414
- Bendo et al. (2004) Bendo, G. J., Armus, L., Calzetti, D., et al. 2004, American Astronomical Society Meeting Abstracts, 205, 60.06
- Bournaud & Combes (2002) Bournaud, F. & Combes, F. 2002, A&A, 392, 83
- Burkhead (1986) Burkhead, M. S. 1986, AJ, 91, 777
- Christian et al. (2003) Christian, C. A., Bond, H. E., Frattare, L. M., et al. 2003, American Astronomical Society Meeting Abstracts, 203, 116.11
- Combes (1991) Combes, F. 1991, ARA&A, 29, 195
- Combes (2000) Combes, F. 2000, in Building Galaxies; from the Primordial Universe to the Present, 413
- Condon et al. (1991) Condon, J. J., Anderson, M. L., & Helou, G. 1991, ApJ, 376, 95
- de Bruyn et al. (1976) de Bruyn, A. G., Crane, P. C., Price, R. M., & Carlson, J. B. 1976, A&A, 46, 243
- Dettmar (1986) Dettmar, R. 1986, Ph.D. Thesis, University of Bonn
- Dumke & Krause (1998) Dumke, M. & Krause, M. 1998, in Breitschwerdt, D., Freyberg, M., & Trümper, J. (eds.), LNP Vol. 506: “The Local Bubble and Beyond”. Proc. IAU Colloq. 166, Springer-Verlag, Berlin, p. 555
- Dumke et al. (2000) Dumke, M., Krause, M., & Wielebinski, R. 2000, A&A, 355, 512
- Dumke et al. (2003) Dumke, M., Krause, M., & Wielebinski, R. 2003, in Aalto, S., Hüttemeister, S., & Pedlar, A. (eds.), “The Neutral ISM in Starburst Galaxies”. ASP Conf. Ser. 320, p. 134
- Dumke et al. (2004) Dumke, M., Krause, M., & Wielebinski, R. 2004, A&A, 414, 475
- Dumke et al. (1995) Dumke, M., Krause, M., Wielebinski, R., & Klein, U. 1995, A&A, 302, 691
- Emerson & Graeve (1988) Emerson, D. T. & Graeve, R. 1988, A&A, 190, 353
- Emsellem (1995) Emsellem, E. 1995, A&A, 303, 673
- Emsellem et al. (1996) Emsellem, E., Bacon, R., Monnet, G., & Poulain, P. 1996, A&A, 312, 777
- Emsellem & Ferruit (2000) Emsellem, E. & Ferruit, P. 2000, A&A, 357, 111
- Ford et al. (1996) Ford, H. C., Hui, X., Ciardullo, R., Jacoby, G. H., & Freeman, K. C. 1996, ApJ, 458, 455
- Heckman (1980) Heckman, T. M. 1980, A&A, 87, 152
- Hildebrand (1983) Hildebrand, R. H. 1983, QJRAS, 24, 267
- Kormendy (1988) Kormendy, J. 1988, ApJ, 335, 40
- Kormendy et al. (1996) Kormendy, J., Bender, R., Ajhar, E. A., et al. 1996, ApJ, 473, L91+
- Krause (2003) Krause, M. 2003, in Han, J.l., Sun, X.H., Yang, J., & Wielebinski, R. (eds.), “Radio Studies of Galactic Objects, Galaxies, and AGNs”. Proc. Sino-German Radio Astronomy Conference, Acta Astronomica Sinica, 44, 123
- Nieten et al. (2005) Nieten, C., Neininger, N., Guélin, M., et al. 2005, A&A, submitted
- Niklas (1995) Niklas, S. 1995, Ph.D. Thesis, University of Bonn
- Niklas (1997) Niklas, S. 1997, A&A, 322, 29
- Niklas & Beck (1997) Niklas, S. & Beck, R. 1997, A&A, 320, 54
- Niklas et al. (1997) Niklas, S., Klein, U., & Wielebinski, R. 1997, A&A, 322, 19
- Rubin et al. (1985) Rubin, V. C., Burstein, D., Ford, W. K., & Thonnard, N. 1985, ApJ, 289, 81
- Ruzmaikin et al. (1988) Ruzmaikin, A. A., Sokolov, D. D., & Shukurov, A. M. 1988, Magnetic fields of galaxies (Moscow, Izdatel’stvo Nauka, 1988, 280 p. In Russian.)
- Scarrott et al. (1977) Scarrott, S. M., White, C., Pallister, W. S., & Solinger, A. B. 1977, Nature, 265, 32
- Schweizer (1978) Schweizer, F. 1978, ApJ, 220, 98
- Simard-Normandin et al. (1981) Simard-Normandin, M., Kronberg, P. P., & Button, S. 1981, ApJS, 45, 97
- Sodroski et al. (1994) Sodroski, T. J., Bennett, C., Boggess, N., et al. 1994, ApJ, 428, 638
- Sokoloff et al. (1998) Sokoloff, D. D., Bykov, A. A., Shukurov, A., et al. 1998, MNRAS, 299, 189
- Tüllmann et al. (2000) Tüllmann, R., Dettmar, R.-J., Soida, M., Urbanik, M., & Rossa, J. 2000, A&A, 364, L36
- Thronson et al. (1989) Thronson, H. A., Tacconi, L., Kenney, J., et al. 1989, ApJ, 344, 747
- van der Burg & Shane (1986) van der Burg, G. & Shane, W. W. 1986, A&A, 168, 49
- von Linden et al. (1996) von Linden, S., Reuter, H.-P., Heidt, J., Wielebinski, R., & Pohl, M. 1996, A&A, 315, 52
- Wagner et al. (1989) Wagner, S. J., Bender, R., & Dettmar, R.-J. 1989, A&A, 215, 243
- Wainscoat et al. (1990) Wainscoat, R. J., Hyland, A. R., & Freeman, K. C. 1990, ApJ, 348, 85
- Walterbos (2000) Walterbos, R. A. M. 2000, in Berkhuijsen, E.M., Beck, R., & Walterbos, R.A.M. (eds.), “The interstellar medium in M 31 and M 33”. Proc. 232. WE-Heraeus Seminar, Shaker Verlag, Aachen, p. 99
- Young et al. (1989) Young, J. S., Xie, S., Kenney, J. D. P., & Rice, W. L. 1989, ApJS, 70, 699