An INTEGRAL Hard X-ray Survey of the Large Magellanic Cloud ††thanks: Based on observations with INTEGRAL, an ESA project with instruments and science data centre funded by ESA member states (especially the PI countries: Denmark, France, Germany, Italy, Switzerland, Spain), Czech Republic and Poland, and with the participation of Russia and the USA.
Two observation campaigns performed in 2003 and 2004 with the INTEGRAL satellite have provided the first sensitive survey of the Large Magellanic Cloud with an imaging instrument in the hard X-ray range (15 keV - 10 MeV). The high energy flux and long term variability of the black hole candidate LMC X–1 was measured for the first time without the contamination of the nearby (25′) young pulsar PSR B0540–69. We studied the accreting pulsar LMC X–4, constraining the size of the hard X-ray emitting region (31010 cm) from the analysis of its eclipses, and measuring its spin period (13.4970.005 s) in the 20-40 keV band. LMC X–3 was not detected, being in a soft state during the first observation and possibly in an extremely low state in the second one. Thanks to the large field of view of the IBIS instrument, we could study also other sources falling serendipitously in the observed sky region around the LMC: the Galactic low mass X-ray binary EXO 0748–676, the accreting pulsar SMC X-1 in the Small Magellanic Cloud, and the Active Galactic Nucleus IRAS 04575–7537 . In addition we discovered five new hard X-ray sources, two of which most likely belong to the LMC.
Key Words.:
gamma-rays: observations – pulsars: individual PSR B0540–69 – X-rays: binaries1 Introduction
The Large Magellanic Cloud (LMC) has been extensively observed in the soft X-ray range (E10 keV) with imaging X–ray satellites, which revealed a large number of X-ray sources of different classes (see e.g. Long et al. (1981) for Einstein, Sasaki et al. (2000); Haberl & Pietsch (1999) for ROSAT, and Haberl et al. (2003) for XMM surveys). The brightest sources have also been observed at higher energies, but mostly with collimated hard X-ray detectors. Observations with non-imaging instruments include those performed with the OSO-7 satellite, which yielded only upper limits for the LMC point sources (Markert & Clark (1975)), and with the Ginga satellite which detected LMC X–3 (Ebisawa et al. (1993)), LMC X–1 (Ebisawa et al. (1989)), two black hole candidates, and LMC X–4, an accreting pulsar, up to 30 keV (e.g. Levine et al. (1991)). LMC X–3 and LMC X–1 were then studied with more sensitive instruments like HEXTE on board RXTE (e.g. Nowak et al. (2001)) and the PDS on board BeppoSAX (Treves et al. (2000)). However, all these non-imaging instruments were affected by some confusion problems, due to the source crowding in this region of the sky.
A few imaging surveys of this nearby (d 55 kpc) galaxy in the hard X-ray (E10 keV) energy range were carried out, with limited sensitivity, exploiting coded mask telescopes. Observations with the SIGMA telescope (40-150 keV) on board the Granat satellite failed to reveal a significant hard X-ray flux from any of the high-energy sources of the LMC (Finoguenov et al. (1993)). The data taken with ART-P, on board the same satellite, but working in a lower energy band (3-15 keV), revealed LMC X–1 and the young rotation powered pulsar PSR B0540–69, without any significant detection above 10 keV (Grebenev et al. (1991)). The TTM telescope (2-27 keV) detected only LMC X–4 and supernova SN 1987A above 15 keV (Sunyaev et al. (1990, 1987)).
The INTEGRAL observatory (Winkler et al. (2003)), thanks to the good sensitivity and to the imaging capabilities of its instruments, recently performed a deep observation of the LMC in the hard-X/soft--ray domain. We will focus here on the results obtained with the ISGRI detector layer (15 keV-1 MeV, Lebrun et al. (2003)) of the IBIS (Ubertini et al. (2003)) coded mask telescope. Its large field of view (2929∘) contains the entire galaxy, and its good angular resolution (12′) is sufficient to resolve most of the LMC hard X-ray sources.
2 Observations and Data Analysis
INTEGRAL performed two series of observations of the LMC. The first in January 2003, just after the end of the Performace and Verification phase of the satellite, and the second in January 2004. The dates and exposure times of the observations are reported in Table 1.
| INTEGRAL | Orbit Start | Net exposure |
|---|---|---|
| Orbit | Time [UT] | [ksec] |
| 27 | 2003-01-02 04:07:37 | 209.2 |
| 28 | 2003-01-05 03:53:52 | 71.0 |
| 29 | 2003-01-08 03:41:54 | 212.0 |
| 33 | 2003-01-20 02:53:20 | 216.2 |
| 34 | 2003-01-23 02:38:41 | 215.1 |
| 35 | 2003-01-26 02:25:14 | 217.2 |
| 27-35 | 1140.7 | |
| 150 | 2004-01-05 02:11:14 | 80.3 |
| 151 | 2004-01-08 02:00:31 | 197.3 |
| 152 | 2004-01-11 01:49:00 | 130.3 |
| 150-152 | 407.9 |
The highly inclined (52∘) and long (72 hr) orbit of INTEGRAL allows for long, uninterrupted observations. However, in order to reduce the presence of the typical systematic noise of coded mask instruments in the reconstructed sky images, each observation is divided in a series of individual pointings following a predefined pattern of sky directions around the target. The 2003 data were obtained in “hexagonal dithering” mode, which consists of the cyclic repetition of a pattern composed by 7 pointings: the first one aimed at SN 1987A and the following six spaced by two degrees at the vertices of a hexagon centred on the first pointing. The 2004 observation was instead performed using a dithering mode consisting of 25 pointings, spaced again by 2 degrees, arranged over a 55 square grid.
We analysed the IBIS data using version 4.2 of the Offline Scientific Software (OSA) provided by the INTEGRAL Science Data Centre (Courvoisier et al. (2003)).
2.1 Imaging
After standard data processing (dead time correction, good time intervals selection, gain correction, energy reconstruction), we produced the sky images of each individual pointing in four energy bands: 20-40, 40-60, 60-100 and 100-150 keV. No sources are visible in the single pointings, owing to their short duration, with the exception of LMC X–4 (see below). To look for fainter sources, we produced the mosaics of the single orbits ( 200 ks) and of the two entire observations, after flat-fielding each individual sky image using the median of all the images of the same orbit. This procedure reduces the systematic noise induced by the non-uniformity of the detector shadowgrams, and thus improves the quality of the mosaic images.
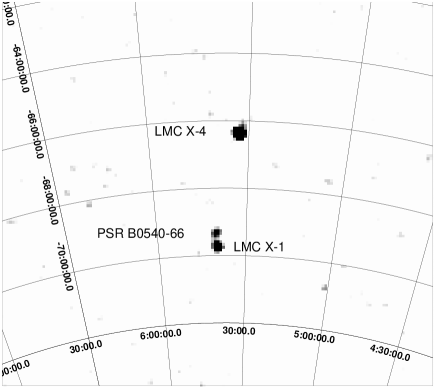
In the 20-40 keV mosaic of the 2003 observation we detected three LMC sources, LMC X–1, LMC X–4 and PSR B0540–69 (see Fig. 1), the Galactic low mass X-ray binary EXO 0748–676 and the Seyfert 2 galaxy IRAS 04575–7537. In the 2004 mosaic in the same energy band we detected LMC X–4, PSR B0540–69, EXO 0748–676, and, at a large off-axis angle also a source in the Small Magellanic Cloud, SMC X–1. Due to source variability LMC X–1 was below the sensitivity threshold for the 2004 observation, which was too short to detect IRAS 04575–7537.
In addition to these known objects, we discovered a few new hard X-ray sources in the 20-40 keV band. They were detected in the partial and total mosaics as indicated in Table 2. To evaluate the significance of their detection, we scaled the significance computed by the OSA software, to the values derived by fitting a Gaussian to the pixel distribution of the final significance images. The coordinates, detection significance and fluxes of the new sources are reported in Table 2. The uncertainty on their coordinates is about 3.5′.
| Name (IGR) | R.A. (J2000) | Dec. (J2000) | 2003 | 2003 Flux [mCrab] | 2004 | 2004 Flux [mCrab] |
|---|---|---|---|---|---|---|
| 20-40 keV | 20-40 keV | |||||
| J03532–6829 | 03:53:14 | –68:29:00 | 3.9 | 0.6 | - | - |
| J05009–7044 | 05:00:59 | –70:44:45 | 4.11 | 0.7 | - | - |
| J05319–6601 | 05:31:57 | –66:01:35 | 6.2 | 0.9 | - | - |
| J05346–5759 | 05:34:35 | –57:59:35 | 4.4 | 1.2 | - | - |
| J06239–6052 | 06:23:58 | –60:52:15 | - | - | 4.6 | 1.8 |
1 reaches 5.5 (2.5 mCrab) during orbit 27.
2.2 Spectral Extraction
To derive the average fluxes and spectra of each source we used the count rate values obtained from the mosaic sky images and rebinned the IBIS/ISGRI response matrix in order to match the four energy channels we used. This spectral extraction method is indicated for weak sources and has already been used successfully (see e.g. Mereghetti et al. (2005)). In addition, for the brightest sources (LMC X–4, LMC X–1 (only 2003 obs.) and EXO 0748–676), we performed the imaging analysis and derived the spectra also in nine energy bands between 20 and 200 keV. The spectra were fitted with XSPEC v 11.2 (Arnaud et al. (1996)). A systematic error of 10% has been added to the data, to account for the uncertainties of our spectral extraction method and of the response matrix. All the spectra were fitted with a power law model, with the exception of LMC X–4 and EXO 0748–676, for which a cutoff power law (, where is the cutoff energy and the photon index) gives better results. The photon spectra have then been multiplied by a constant factor (1.7) derived from the comparison with observations of the Crab Nebula.
In order to look for spectral variability, we also considered the mosaics of the single orbits. With the exception of LMC X–4 (see below), all sources were consistent with a constant flux within the same observation, while, as mentioned above, some long term variations appeared by comparing the fluxes in 2003 and 2004 (LMC X–1). All the fluxes and spectral parameters, referring to the 20-100 keV energy range, are reported in Table 3.
| LMC X–1 | LMC X–4 | PSR B0540–69 | EXO 0748–676 | IRAS 04575–7537 | |
| Flux [10-12 erg cm-2 s-1] | 58 | 12460 | 31 | 320150 | 15.35.1 |
| Photon Index | 2.90.3 | 1.00.2 | 2.20.4 | 1.30.4 | 3.41.0 |
| Cutoff Energy [keV] | - | 135 | - | 4415 | - |
| Flux [10-12 erg cm-2 s-1] | - | 590100 | 247 | 421150 | - |
| Photon Index | - | 1.35 0.2 | 1.90.5 | 1.60.4 | - |
| Cutoff Energy [keV] | - | 17 7 | - | 5015 | - |
2.3 Timing analysis
2.3.1 LMC X–4
From the mosaics of the individual orbits we noticed that the flux of LMC X–4 increased by a factor 7 in 6 days during the first part of the January 2003 observation, and returned to the initial level towards the end of the observation. This can be clearly seen from the light curve obtained from the fluxes measured in the individual pointings ( 2200 s each, Fig. 2, upper panel). The source variability can be attributed to the 30.3-day super-orbital period observed at lower energies (e.g. Paul & Kitamoto (2002)) and generally interpreted as the effect of precession of a tilted accretion disk. The bottom panel of Fig. 2 shows for comparison the 2-10 keV light curve obtained by folding at =30.296 days the data of the RXTE ASM instrument.

Our 2003 observation, extending over 26 days, covered most of the super-orbital period but missed the peak of the source intensity (top panel of Fig. 2), while a much shorter phase coverage was obtained in 2004 (Fig. 2 middle panel).
Referring to the upper panel of Fig. 2, we define high and low state of the source when the 20-40 keV flux is above/below 4 counts/s. The spectra extracted over the two states differ only in flux (from 710-11 to 4.310-10 erg cm-2 s-1) but show a similar shape. For comparison we have extracted the high state spectra of LMC X–4 also using the standard OSA 4.2 spectral extraction, which is suitable for bright sources that are clearly detected during single pointings. In fact LMC X–4 was detected also in the single pointings in this case. The two methods gave similar results.
When the source was in the high state, the eclipses due to its occultation by the giant companion star (= 1.4084 days, White (1978)) are visible in the INTEGRAL light curves. To study the eclipses in more detail we extracted the light curves (20-40 keV) with 100 s resolution around the time of the eclipses, both for the 2003 and 2004 observations.

We added in phase the data of the two complete eclipses of the 2004 observation, see Fig. 3. The eclipse ingress seems to be resolved and in fact it can not be fitted with a step function. The same is not true for the egress. Assuming that the ingress is truly resolved, we can derive some information on the size of the largest hard X-ray emitting region. If the geometry of the binary system and its projection on the sky are known, we can assume that at the beginning of the eclipse the projection of the distance between the centres of the two binary components coincides with the sum of their radii, while at the beginning of the total occultation it coincides with their difference. We indicate with and the radii of the companion star and the hard X-ray emission region respectively, with the binary separation (8.51011 cm, Levine et al. (2000)) and with the phase ( for the early beginning and for the start of the total occultation and obtain the following relations:
| (1) |
| (2) |
corresponds to the conjunction of the two stars with the compact object closer to the observer, corresponds to the mideclipse time. By fitting the light curve with a constant plus an exponential cutoff, one can derive a precise value of and . Substituting Eq. 1 in Eq. 2 and knowing the geometry of the system (inclination angle =68∘, Levine et al. (1991)) we derive a size for the high energy emitting region, , 2.631010 cm.
We looked for the presence of the 13.5 s neutron star spin period by analysing the pointings during which the source was brighter. The photon arrival times were converted to the solar system barycentre and corrected for the orbital motion of the system. We restricted our search to the 15-40 keV energy band, the one with the highest signal-to-noise ratio. An additional selection criterion to improve our statistics was to chose only the pixels illuminated by the source for at least 75% of their surface. We applied an epoch folding analysis to search in the range from 13.4 s to 13.6 seconds, with 8 phase bins and 150 trial periods. This period range is much larger than the range of periods ever observed in this source (see Fig. 2 in Woo et al. (1996)). We could not detect the pulsations in the 2003 data, which, having been taken at the beginning of the mission, when the on board parameters of the instruments were not yet completely optimised, are affected by a higher background noise. The search was more fruitful for the 2004 observation, for which pulsations were detected considering together five time series taken from orbit 152, starting at 53016.54105 MJD and ending at 53016.71887 MJD (total exposure 11.5 ks). Fitting the distribution of values versus trial period as described in Leahy (1987), we obtained a best-fit period of 13.4970.005 s. The folded light curve (Fig. 4) shows two peaks per phase, in contrast to the single broad peak measured between 15 and 37 keV by Ginga (Woo et al. (1996)), and with SAX between 23 and 30 keV (Naik & Paul (2004)).

3 Discussion
3.1 LMC X–1
LMC X–1 is a well known black hole candidate. Together with Cyg X-1 and LMC X–3, it is the only persistent X-ray binary with an accurately determined mass function strongly suggesting the presence of an accreting black hole (Hutchings et al. (1987)). LMC X–1 spends most of the time in the so called high/soft state, characterised by a spectrum modeled with a multi-temperature disk black body plus a power law component dominating above 10 keV and a narrow emission line at 6.5 keV. The photon index of the power law component is usually around 3 (Nowak et al. (2001)).
This is the first time that the high-energy flux of this source can be fully disentangled (see Fig. 1) from that of PSR B0540–69, which lies just 24.6′ from it (see e.g. Haardt et al. (2001)). We detected LMC X–1 up to 80 keV only during the 2003 bservation. The flux measured in 2003 (see Table 3) was one order of magnitude higher than that measured by SAX in the same energy range (Haardt et al. (2001)) and a factor 5 larger than that reported with RXTE (Nowak et al. (2001)). This could be interpreted as a transition of the source to its low/hard state. However the photon index (3) and the fact that the 2-10 keV flux, measured with the All Sky Monitor (ASM) on board RXTE (see Fig. 5), remained constant, indicate that the source was in high/soft state. Hence the 2003 observation represents the highest hard X-ray flux reported so far for the soft state of LMC X–1.
The non-detection of LMC X–1 in 2004 indicates that it became fainter by a factor 10. The 3 upper limit on its flux in January 2004 is 2.610-4 ph cm-2 s-1 in the 20-100 keV band (assuming the same spectral shape of the 2003 observation). This value is still compatible with the SAX/PDS measurement. The 2-10 keV ASM flux remained almost constant during both observations (see Fig. 5), indicating we are again measuring a soft state of the source. A similar behaviour, with large variations of the hard-X ray component independent of the soft component, has been observed in this source and in LMC X–3 using Ginga data (Ebisawa et al. (1989, 1993)). This seems to indicate that there is a mechanism responsible for the variation of high-energy emission, which does not involve variations of the low-energy flux.

3.2 LMC X–3
LMC X–3 is another black hole candidate, similar in many respects to LMC X–1 (Nowak et al. (2001)), with the main difference that it shows a larger degree of variability at soft X-rays. In fact it undergoes strong variations in luminosity associated with the cyclic transitions between its low/hard and its high/soft state. During the low/hard state the flux dims at low energies, but grows at high energies, pivoting at 10 keV. The spectrum can then be represented by a single power law with photon index 1.7 (Boyd et al. (2000); Wilms et al. (2001)).
LMC X–3 was not detected in our INTEGRAL observations. We can put a 3 upper limit on its flux (20-100 keV) of 1.810-4 ph cm-2 s-1 deduced from the first observation. Following Wilms et al. (2001) one can associate the minima of the ASM light curve with the hard states of the source. By comparing our data with the ASM (see Fig. 6), we can conclude that we did not observe in 2003 the hard state of the source. In fact our first observation was close but not exactly corresponding to a minimum. Our non-detection can be explained with the source being in a soft state without a strong high energy component similarly to what we observe during the second LMC X–1 observation and to what reported for the March 1988 Ginga observation (Ebisawa et al. (1993)).
The second INTEGRAL observation, on the other hand, corresponds to an extremely low X-ray state (no detection in the ASM light curve), close to quiescence, similar to the “off” states of transient black hole binaries. This picture is consistent with our upper limit (310-4 ph cm-2) derived for the 2004 observation, which is lower than the extrapolation of the flux measured at lower energies with the PCA during low/hard states (Boyd et al. (2000)).

3.3 LMC X–4
LMC X-4 is a high-mass X-ray binary system composed by an O/B type star (Sanduleak & Philip (1977)), probably a main-sequence star (Woo et al. (1996)), and a pulsating neutron star, with an intense magnetic field (La Barbera et al. (2001)), accreting material from the companion by stellar wind. Like for Her X–1, an accretion disk thicker in the outer regions, truncated at the Alfén radius by the magnetic pressure, is also present (Lang et al. (1981)).
The disk emits thermal photons which contribute to the main soft (0.1-2 keV) component of the spectrum. Hard X-ray photons are instead produced by reprocessing in an external hot corona, that surrounds the inner part of the disk: soft photons are, in general, Compton-inverse upscattered to higher energy. When the disk is edge-on, only the contribution due to the corona (Woo et al. (1996)) is visible. This behaviour is confirmed by the absence of spectral variations between high and low state (see also Naik & Paul (2003, 2004)).
If the indication of the resolved ingress duration derived from our data is confirmed, the corresponding size for the region emitting above 20 keV is clearly not compatible with the size of the neutron star, confirming that the hard X-rays are produced in a hot scattering corona surrounding the accretion disk.
LMC X–4 is thought to be near the condition of spin equilibrium, which occurs when the spin period of the neutron star is close to the Keplerian period of the inner boundary of the accretion disk. This condition is reflected in a rather constant spin period evolution. In fact the latter has been studied for more than 20 years (see e.g. Woo et al. (1996); Levine et al. (2000); Naik & Paul (2004)) and has shown some variations but no particular spin-up or spin-down trend. Our measurement is still in the range of the reported periods for this source.
3.4 PSR B0540–69
PSR B0540–69 is one of the youngest rotation-powered pulsars. It was discovered in the X-rays by the Einstein Observatory (Seward et al. (1984)). Its rotational characteristics (P=50 ms and = 4.7910-13 s s-1) resemble those of the Crab pulsar and give a characteristic age of 1.6 yr. Like the Crab, it is surrounded by a bright radio, optical and X-ray synchrotron nebula.
The source was detected in our data up to 60 keV with a marginal ( 3) detection in the 60-100 keV band. This is the first time that a measure of the total flux from this pulsar and its nebula can be done at these energies. Up to now only the pulsed component could be measured with RXTE (de Plaa et al. (2003)) up to 48 keV.

The flux we measure is about three times higher than the pulsed one measured by RXTE, see Fig. 7. This means that the nebular and the unpulsed contributions at these energies would then be of the order of 50-75% of the total flux. This can be compared to what is reported in the same energy range for the Crab nebula, for which the nebula and unpulsed flux represent the 85% of the total flux (Kuiper et al. (2001)).
The spectral index we derive is compatible, within the errors, with the one measured with RXTE. A softening at higher energies has been reported for the HEXTE data on the pulsed emission: a spectral break in our data cannot be ruled out, due to the low statistics.
3.5 EXO 0748–676
The low-mass X-ray binary (LMXB) EXO 0748–676, discovered with EXOSAT (Parmar et al. (1985)), has been extensively studied in the soft X-ray band (0.1-10 keV). It is a peculiar source, showing all types of temporal variability typical of the different kinds of LMXBs: it shows eclipses (=3.82 hr), dips, flares, and type I X-ray bursts indicating the presence of a neutron star in the system. The estimated distance of this source, lying outside the Galactic Plane at 20∘, is 10 kpc, and the mass of the companion is estimated to be 0.5 M⊙ (Gottwald et al. (1986); Parmar et al. (1986)). A physical model for EXO 0748–676 was proposed by Church et al. (1998): the blackbody emission seen at low energies originates from the neutron star and an extended Comptonized emission from the Accretion Disc Corona (ADC) causes the cutoff power-law component measured in the hard X-ray band. Recent XMM-Newton results based on the absence (Bonnet-Bibaud et al. (2001)) or presence (Homan et al. (2003)) of eclipses in the soft energy band (E 2 keV), seem to indicate that the dimensions of the Comptonized region vary and, in general, that the source has different states reflecting different geometries of the system.
The only hard X-ray observation of this source was performed by BeppoSAX in October 1998. The source was detected in the PDS up to 100 keV (Sidoli et al. (2005)). A broad-band (0.1 keV-100 keV) persistent (non-dip, non-burst) spectrum was obtained. They derived a 20-100 keV flux of 3.6810-10 erg cm-2 s-1 which is fully compatible with the flux derived here. Also the cutoff energy of 48 keV found in the SAX observation agrees with our data. This indicates, that despite the large flux variations found in the soft X-rays, the hard component seems to be more stable.
We extracted the light curve (20-100 keV) of EXO 0748–676 with 600 s time bins (corresponding roughly to the eclipse duration at lower energies) and folded it at the orbital period value. The resulting light curve, Fig. 8, shows a clear indication of the eclipse. However, the low statistics due to the fact that EXO 0748–676 was detected at a very large off-axis angle, does not allow us to perform more detailed analysis.

The eclipse above 20 keV is consistent with being total, indicating that the angular size of the companion star is greater than that of the hard X-ray emission region.
3.6 IRAS 04575–7537
The AGN IRAS 04575–7537 is associated with a rather bright barred spiral Galaxy at redshift z=0.0184 and showing strong infrared emission (Hewitt & Burbidge (1991)). IRAS 04575–7537 was first detected in the X-ray range with HEAO-1, and later observed with ROSAT, Ginga and ASCA (Vignali et al. (1998)). It is classified as a Seyfert 2 galaxy.
In our observations it was quite faint (3 mCrab) and detected it up to 80 keV in the IBIS/ISGRI mosaic. We derived two spectral points and an upper limit, which represent the first measurement of this AGN at these energies. The flux is about 1.5 erg cm-2 s-1 (20-100 keV). This implies a 20-100 keV luminosity of 1.2 erg s-1 (=70, =0.7).
3.7 New sources
IGR J05319–6601 is located at a position consistent with the LMC. It is at an angular distance of 21′ from LMC X–4, and their point spread functions partially overlap, therefore its significance and flux are likely to be influenced by the brighter source. Within its error box ( 3.5′) there are at least 7 faint unidentified soft X-ray sources, discovered during different X-ray surveys of the LMC. Hence we cannot exclude that we are measuring the blended emission from different unresolved sources. The 20-40 keV luminosity we derive for this source, supposing it is located in the LMC, is of the order of 1036 erg s-1. This value and the fact that IGR J05319–6601 is close to the centre of the galaxy suggest that we are dealing with a binary system.
IGR J05009–7044 is possibly the same source recently reported as IGR J05007–7047 and for which a Chandra X-ray counterpart has been found (Halpern (2005)). The Chandra source is optically identified with the bright blue star USNO-B1.00192-00057570 (Monet et al. (2003)). This suggests that IGR J05009–7044 could be a High Mass X-ray Binary (HMXB) in the LMC. In this case it would have a 20-40 keV luminosity of 71035 erg s-1. However, inside the error box of IGR J05009–7044 there is also a radio emitting galaxy (SUMSS J050059–704225, 10 mJy at 843 Mhz, Mauch et al. (2003)), so we cannot exclude that the INTEGRAL source is instead an AGN.
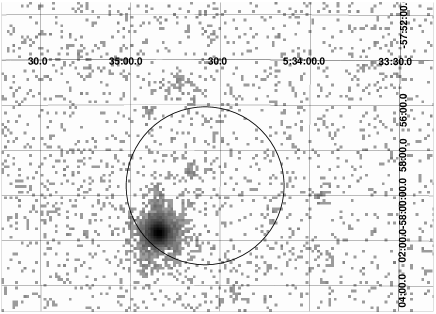
All the other new sources we discovered are at positions not consistent with the LMC. IGR J05346–5759 is spatially coincident with TW Pic, see Fig. 9, a cataclysmic variable of the DQ Her type (Norton et al. (2000)).
We analysed an archival ROSAT/PSPC observation of this source. The observation is 10 ks long and was performed on April 10 1992. The source spectrum is well fitted with an absorbed power law model. We derive a photon index = 1.30.2 and a hydrogen column density =(1.20.5)1020 cm-2, with an unabsorbed 0.5-2 keV flux of 310-12 erg cm-2 s-1. The extrapolation of this spectrum to the 20-40 keV energy band yields a flux of 1.310-11 erg cm-2 s-1, which is fully compatible with the 110-11 erg cm-2 s-1 value derived from the IBIS data.
IGR J03532–6829 can be associated with 1RXS J035257.7–683120, which has been discovered in the X-rays by the Einstein satellite (Elvis et al. (1992)) and detected also with RXTE in the 8-20 keV band (Revnivtsev et al. (2004)) and is likely associated with the AGN PKS 0352–686. IGR J06239–6052 is coincident with a radio galaxy (SUMSS J062346–605222, Mauch et al. (2003)), making it an AGN candidate.
4 Conclusions
The INTEGRAL survey of the LMC allowed us for the first time to study the hard X-ray emission of some of the sources of this galaxy. Among the sources of the LMC we detected and studied LMC X–1, LMC X–4 and PSR B0540–69. LMC X–3 was not detected during our observations, being in its soft state during the first one and close to quiescence in the second one.
For the first time we were able to disentangle the high-energy emission of PSR B0540–69, for which we measured the total (pulsar+nebula) spectrum, from the one of LMC X–1, for which we measured the flux and long term variability.
Our data on the eclipses of the accreting X-ray pulsar LMC X–4 suggest that the size of the high-energy emission region is 31010cm.
Several serendipitous sources were detected during our survey: the brightest ones are EXO 0748–676, IRAS 04575–7537 and SMC X–1. We derived their fluxes and spectral parameters, where possible. The eclipses of EXO 0748–676 were reported for the first time at energies above 10 keV.
In addition we reported the discovery of 5 new faint high-energy sources. Two of them are most likely associated with AGNs. One represents the first high-energy detection of the cataclysmic variable TW Pic and the last two are potentially located in the LMC: One (IGR J05319–6601) has no clear association and could be due to the blended emission of several sources and the other (IGR J05009–7044) may be an HMXB.
Acknowledgements.
We acknowledge the Italian Space Agency financial and programmatic support via contract I/R/046/04.References
- Arnaud et al. (1996) Arnaud, K. A., 1996, ASP Conf. Ser. 101: Astronomical Data Analysis Software and Systems V, 17
- Bonnet-Bibaud et al. (2001) Bonnet-Bibaud, J. M., et al., 2001, A&A, 365, L282
- Boyd et al. (2000) Boyd, P. T., Smale, A. P., Homan, J. 2000, ApJ, 542, L127
- Church et al. (1998) Church M. J., et al. 1998, ApJ, 504, 516
- Courvoisier et al. (2003) Courvoisier T. J.-L., Walter, R., Beckmann, V., et al. 2003, A&A, 411 L53
- Ebisawa et al. (1989) Ebisawa, K., Mitsuda, K., & Inoue H. 1989, PASJ, 41, 519
- Ebisawa et al. (1993) Ebisawa, K., Makino, F., Mitsuda, K., et al. 1993, Apj, 403, 684
- Elvis et al. (1992) Elvis, M., et al. 1992, ApJS, 80, 527
- Finoguenov et al. (1993) Finoguenov, A., Gilfanov, M., Grebenev, S., et al. 1993, AstL, 19, 69
- Gottwald et al. (1986) Gottwald, M., Haberl, F., Parmar, A. N., White, N. E. 1986, ApJ, 308, 213
- Grebenev et al. (1991) Grebenev, S., Sunyaev, R., Pavlinsky, M., et al. 1991, AstL, 17, 310
- Haardt et al. (2001) Haardt, F., Galli, M. R., Treves, A., et al. 2001, ApJS, 133, 187
- Haberl & Pietsch (1999) Haberl, F. & Pietsch, W. 1999, A&AS, 139, 277
- Haberl et al. (2003) Haberl, F., et al. 2003, A&A, 406, 471
- Halpern (2005) Halpern, J. P. 2005, ATel, 572
- Hewitt & Burbidge (1991) Hewitt A. & Burbidge G. 1991, ApJSS 75, 297
- Homan et al. (2003) Homan, J., et al. 2003, A&A, 412, 799
- Hutchings et al. (1987) Hutchings, J. B., et al. 1987, AJ, 94, 340
- Kuiper et al. (2001) Kuiper, L., Hermsen, W., Cusumano, G., et al. 2001, A&A, 2001, 378, 918
- La Barbera et al. (2001) La Barbera, A., Burderi, L., Di Salvo, T., Iaria, R., & Robba, N.R. 2001, ApJ, 553, 375
- Lang et al. (1981) Lang, F. L., Levine, A. M., Bautz, M., et al. 1981, ApJ, 246, L21
- Leahy (1987) Leahy, D.A. 1987, A&A, 180, 275
- Lebrun et al. (2003) Lebrun, F., Leray, J.P., Lavocat, P., et al. 2003, A&A, 411, L141
- Levine et al. (1991) Levine, A., Rappaport, S., Putney, A., Corbet, R., Nagase, F. 1991, ApJ, 381, 101
- Levine et al. (2000) Levine, A. M., et al. 2000, ApJ, 541, 194
- Long et al. (1981) Long, K. S., et al. 1981, ApJ, 248, 925
- Markert & Clark (1975) Markert, T. H., & Clark, G. W. 1975, ApJ, 196, L55
- Mauch et al. (2003) Mauch, T., Murphy, T., Buttery, H. J., et al. 2003, MNRAS, 342, 1117
- Mereghetti et al. (2005) Mereghetti, S., Götz, D., Mirabel, I.F., and Hurley, K. 2005, A&A, 433, L9
- Monet et al. (2003) Monet, D. G., Levine, S. E., Canzian, B., et al. 2003, AJ, 125, 984
- Naik & Paul (2003) Naik, S., & Paul, B. 2003, A&A, 401, 265
- Naik & Paul (2004) Naik, S., & Paul, B. 2004, ApJ, 600, 351
- Norton et al. (2000) Norton, A.J., et al. 2000, MNRAS, 312, 362
- Nowak et al. (2001) Nowak, M. A., Wilms, J., Heindl, W. A., et al. 2001, MNRAS, 320, 316
- Parmar et al. (1985) Parmar, A. N., White, N. E., Giommi, P., et al. 1985, IAU Circ. 4039
- Parmar et al. (1986) Parmar, A. N., White, N. E., Giommi, P. Gottwald, M. 1986, ApJ, 308, 199
- Paul & Kitamoto (2002) Paul, B., & Kitamoto, S. 2002, JApA, 23, 33
- de Plaa et al. (2003) de Plaa, J., Kuiper, L., & Hermsen W. 2003, A&A, 400, 1013
- Revnivtsev et al. (2004) Revnivtsev, M., et al. 2004, A&A, 418, 927
- Seward et al. (1984) Seward, F. D., Harnden, F. R., & Helfand, D. J. 1984, 287, L19
- Sidoli et al. (2005) Sidoli, L., Parmar, A. N., Oosterbroek, T. 2005, A&A, 429, 291
- Sanduleak & Philip (1977) Sanduleak, N. & Philip, A.G.D. 1977, IAUC Circ., No 3023.
- Sasaki et al. (2000) Sasaki, M., et al. 2000, A&AS, 143, 391
- Sunyaev et al. (1987) Sunyaev, R., Kaniovsky, A., Efremov, V., et al. 1987, Nature, 330, 227
- Sunyaev et al. (1990) Sunyaev, R., Gilfanov, M., Churazov, E., et al. 1990, AstL, 16, 124
- Treves et al. (2000) Treves, A., Galli, M., Haardt, F., et al. 2000, AdSpR, 25, 437
- Ubertini et al. (2003) Ubertini, P., Lebrun, F., Di Cocco, G., et al. 2003, A&A, 411, L131
- Vignali et al. (1998) Vignali, C., Comastri, A., Stirpe, G. M., et al. 1998, A&A 333, 411
- White (1978) White, N. E. 1978, Nature, 271, 38
- Wilms et al. (2001) Wilms, J., Nowak, M. A., Pottschmidt, K., et al. 2001, MNRAS, 320, 327
- Woo et al. (1996) Woo, J. W., et al. 1996, ApJ, 467, 811
- Winkler et al. (2003) Winkler, C, Courvoisier, T.J.-L., Di Cocco G., et al. 2003, A&A, 411, L1