Constraining the Emission Properties of TeV Blazar H1426+428 by the Synchrotron-Self-Compton Model
Abstract
H1426+428 is one of blazars that are observed by -rays in the TeV region. Because TeV -rays from distant sources are subject to attenuation by the extragalactic background light (EBL) via electron-positron pair production, the intrinsic spectrum of the TeV -rays should be inferred by using the models of radiation processes and EBL spectrum. We set constraints on the physical condition of H1426+428 with the synchrotron-self-Compton model applying several EBL models. We find that the emission region of H1426+428 is moving toward us with the bulk Lorentz factor of and that its magnetic field strength is G. These properties are similar to other TeV blazars such as Mrk 421 and Mrk 501. However, the ratio of the energy density of nonthermal electrons to that of the magnetic fields is about 190 and fairly larger than those of Mrk 421 and Mrk 501, which are about 5 – 20. It is also found that the intensity of EBL in the middle and near infrared wavelengths should be low, i.e., the intensity at 10 m is about 1 nW m-2 sr-1 to account for the observed TeV -ray flux. Because the spectral data of H1426+428 in X-rays and -rays used in our analysis were not obtained simultaneously, further observations of TeV blazars are necessary to make the constraints on EBL more stringent.
1 Introduction
Recent observations of very high energy -rays revealed that some blazars emit -rays in the TeV region (e.g., Aharonian et al., 2005b, and references therein). The spectral energy distribution (SED) of these blazars has two peaks; one in the X-ray region and the other in the very high energy -ray region (GeV – TeV). The emission mechanisms of TeV blazars are thought to be synchrotron radiation and inverse Compton scattering by nonthermal particles in relativistically moving jets (e.g., Maraschi et al., 1992; Marscher & Travis, 1996; Inoue & Takahara, 1996; Li & Kusunose, 2000; Kino et al., 2002). Leptonic models that assume electrons and positrons as emitting particles are most widely accepted. Although hadronic models are viable, which postulate emission from mesons and leptons produced by the cascade initiated by proton-photon or proton-proton collisions (e.g., Mannheim & Biermann, 1992; Mannheim, 1993; Mücke et al., 2003), we do not consider these models in this paper.
It has been known that TeV -rays emitted by blazars are attenuated by absorption due to the extragalactic background light (EBL) en route to the Earth, because pair production occurs via . The importance of the absorption of high energy -rays due to cosmic background radiation was noticed quite early (Nikishov, 1962; Gould & Schrèder, 1966; Jelly, 1966). The effects of the attenuation on the SED of blazars were recognized by Stecker et al. (1992) following EGRET observation of 3C 279 (Hartman et al., 1992). Since then this effect has been extensively studied by many authors (e.g., Dwek & Slavin, 1994; Stecker & Salamon, 1996; Konopelko et al., 2003; Kneiske et al., 2004; Dwek & Krennrich, 2005). The spectrum of EBL ( to 1000 m) has been observed by various instruments (Hauser & Dwek, 2001; Kashlinsky, 2005, for review). It is known that there are two peaks in the SED of EBL; one at m is associated with star light and the other at m is related with dust emission. The wavelength region of to 60 m is difficult to observe because of interplanetary dust emission, while the attenuation of TeV -rays is most effective in this wavelength region of EBL. When a -ray with energy collides with an EBL photon with energy , pair production occurs if is satisfied, where and are the rest mass of an electron and the light speed, respectively. If TeV, a photon with m produces a pair, where is the Planck constant.
Because both the intrinsic SED of TeV blazars and the EBL spectrum are not well known, various attempts have been made to construct self-consistent models of TeV blazars and the EBL spectrum. (Differences in various EBL models are discussed in detail by Hauser & Dwek (2001).) For example, De Jager & Stecker (2002) derived the intrinsic -ray spectrum of Mrk 501 during 1997 high state, using the models of EBL by Malkan & Stecker (2001) (backward evolution model). Recently Dwek & Krennrich (2005) employed a different way of constructing the models of the EBL spectrum. They adopted various observed EBL data and fitted the data with polynomials; 12 different EBL template spectra with different intensities in UV – near IR, mid IR, and far IR spectra. Using those spectra, they set constraints on the intrinsic spectra of Mrk 421, Mrk 501, and H1426+428 and the acceptable range of the EBL spectrum was estimated.
Most models of the SED of TeV blazars and the EBL spectrum have not taken into account the electron spectrum in the emission region self-consistently. Many authors assumed a given form of the energy spectrum of electrons or do not consider the emission mechanisms at all. Konopelko et al. (2003), on the other hand, solved kinetic equations of electrons and photons simultaneously to calculate the emission spectrum of Mrk 501 and Mrk 421. They calculated the optical depth for TeV -rays according to the EBL models by Malkan & Stecker (2001) and De Jager & Stecker (2002). They obtained a fairly good fit to the observed spectrum of the blazars with a rather large value of the Doppler factor of the jet, i.e., .
In this paper we make models of H1426+428 (at redshift and estimate the intensity of EBL, solving the kinetic equations of electrons and photons to obtain the intrinsic SED of blazars, so that the observed SED is consistent with the electron injection and cooling processes. X-ray observation of H1426+428 was carried out by Costamante et al. (2001) with BeppoSAX and X-ray spectrum was found to extend up to 100 keV. Falcone et al. (2004) observed H1426+428 with RXTE and found that the peak energy in SED was sometimes in excess of keV and at other times in the 2.4 – 24 keV region. TeV -rays have been observed by several groups (Horan et al., 2002; Aharonian et al., 2002; Djannati-Atai et al., 2002; Petry et al., 2002; Aharonian et al., 2003). Because the redshift of H1426+428 is 0.129, the effects of the attenuation of TeV -rays should be very large and the object can be a good test against various EBL models.
Costamante et al. (2003) inferred the intrinsic spectrum of H1426+428 using the model spectrum of EBL given by Primack et al. (2001), who employed the semi-analytical models of galaxy formation, as well as a EBL model spectrum designed to match the high fluxes below 2 m (Aharonian et al., 2002). Their model spectrum of H1426+428 has a large value of the ratio of Compton luminosity to synchrotron luminosity, . According to Costamante et al. (2003), external seed radiation fields for inverse Compton scattering are necessary to account for and to avoid the Klein-Nishina effects in inverse Compton scattering. Aharonian et al. (2003) obtained a rising intrinsic spectrum in the TeV regime, using the same EBL spectra as Costamante et al. (2003) and Malkan & Stecker (2001) adopted.
Since the estimate of the intrinsic SED of TeV blazars largely depends on the EBL spectrum and the uncertainty of the SED of EBL is quite large, it is worth testing various possibilities of the EBL spectrum. In this paper we use the templates of EBL derived by Dwek & Krennrich (2005), because their model spectra cover a wider range in intensity than those used by Konopelko et al. (2003). We present the method of calculations of the energy spectra of photons and electrons in the jet and the spectrum of EBL in §2. Numerical results for energy spectra of photons and electrons in the emission region of H1426+428 are shown in §3. Finally summary of our results and discussion are given in §4.
2 Model
2.1 Kinetic equations
The emission mechanisms of H1426+428 are assumed to be synchrotron radiation and synchrotron-self-Compton (SSC) scattering. We calculate the SED of H1426+428 before the attenuation of -rays by simultaneously solving the kinetic equations of photons and electrons in the emission region. We use the same numerical scheme as used in Kusunose et al. (2003) except that external soft photons are not included in this work. We assume that the emission region is a spherical blob with radius moving with a relativistic speed with Lorentz factor . It is also assumed that . Nonthermal electrons are injected into the emission region at injection rate per unit and unit volume in the comoving frame of the blob, where is the electron Lorentz factor. The kinetic equation of nonthermal electrons is given by
| (1) |
where is the electron escape time from the emission region, and and are the cooling rates by synchrotron radiation and SSC scattering, respectively. Here depends on the photon spectrum in the blob. The injection rate of nonthermal electrons is given by
| (2) |
where , , and are parameters, which are determined by fitting the emission spectrum with observed one.
The kinetic equation of photon number spectrum , where is the photon energy, is given by
| (3) |
where is the photon escape time from the emission region. The photon production rate per unit volume in the blob by synchrotron radiation is denoted by . The self-absorption by synchrotron radiation and the absorption by pair production inside the blob are included in . The production and loss of photons by Compton scattering is given by
| (4) |
where is the angle averaged scattering rate and is the probability that photon energy is changed to by a single scattering with an electron with (Coppi & Blandford, 1990). Here the exact Klein-Nishina cross section is used to calculate and . We solve equations (1) and (3) simultaneously to obtain the spectra of electrons and photons self-consistently. The emission spectrum is calculated from the term of photon escape in equation (3) and the observed spectrum is affected by the Doppler and beaming effects because of the relativistic motion of the emission region. We include these effects to compare the model SED with observations.
2.2 Optical Depth by EBL
The interaction between high energy -rays and EBL via pair production attenuates TeV -rays from blazars. The optical depth of the attenuation is a function of the -ray energy and the EBL spectrum. For the calculation of we assume a flat CDM cosmology with km s-1 Mpc-1, , and (Bennett et al., 2003), where is the Hubble constant and and are the density parameters of matter and dark energy, respectively. The EBL number density at is calculated as
| (5) |
where is the EBL number spectrum measured at and . Equation (5) assumes that the phase space density of EBL is conserved. The spectrum of EBL has been measured by various groups. However, there is a large uncertainty in the observed spectra. To take into account various possibilities, we follow the recently adopted method by Dwek & Krennrich (2005). They generated 12 EBL templates based on numerous observational data. The templates are labeled as XYZ such as LLL, MLH, and LHH, etc. Namely, X = L, M, or H representing the energy flux of the stellar component of EBL (L = low, M = medium, and H = high). Also, Y = L or H, and Z = L or H, where Y denotes the flux level at 15 m band and Z does at far-IR band.
The observed SED is calculated by multiplying the model SED by . Because of this exponential factor of the attenuation, the differences in are significant in construction of the SED models of blazars.
3 Numerical Results
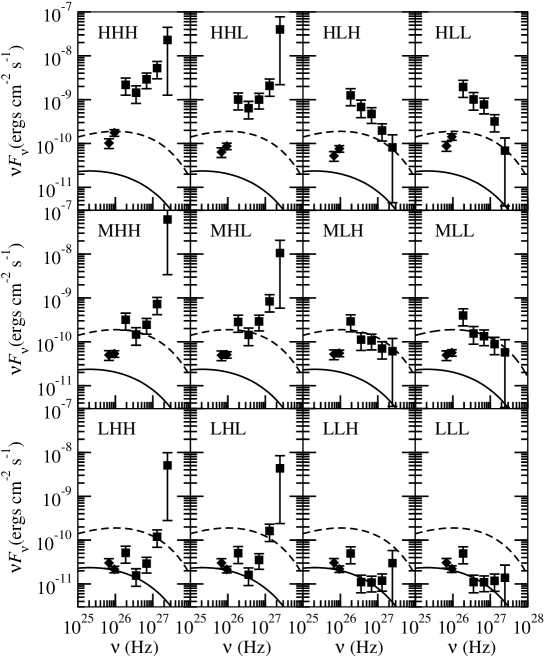
In Figure 1, the -ray data obtained by the Whipple collaboration (Horan et al., 2002) and the HEGRA collaboration in the term 1999 – 2000 (Aharonian et al., 2003) are shown. These are calculated by multiplying the observed data by assuming various models of EBL. It is found that the attenuation free SED does not depend much on Z of EBL, i.e., SED is almost the same for Z = L and Z = H. To distinguish the dependence on Z, -ray sources with higher energies are needed. When EBL models with Y = L are applied, SED is flat or becomes downward as the photon energy increases. For EBL models with Y = H, the peak of before the attenuation may appear at photon energies greater than 50 TeV, which is hard to explain by SSC models; this will be discussed in §4. Because we search for the values of parameters with SSC models, EBL models with Y = H are excluded.
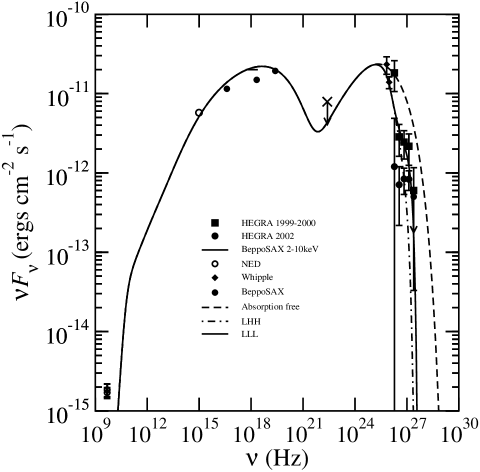
Our model SEDs of H1426+428 are shown in Figure 1 by solid and dashed lines. The parameters to specify the spectra of electrons and photons of the emission region of H1426+428 are , , magnetic field , , , , , and . The model spectrum of EBL that can be consistent with our SED models are LLL, LLH, MLH, and MLL. With these EBL templates, it is not necessary to invoke the external soft photons as seed photons of inverse Compton scattering, because of the smaller value of the optical depth for -rays in 1 – 20 TeV region. We first adopt X = L as a template for which the model of H1426+428 is obtained. In Figure 2, the -ray data together with the data in other wave bands are shown, where HEGRA data in the term 2002 are also shown for reference. The X-ray data obtained by BeppoSAX are read from Figure 3 in Costamante et al. (2003) and only three points are plotted in this figure. It is to be noted that the data in multiwavelength bands were not obtained simultaneously. We find that the following values of the parameters for the model SED before the attenuation fit the observed data: G, , cm, , , , the electron injection rate of electrons cm-3 s-1, and . We call this model “base model,” hereafter. (The solid line in Figure 1 is the SED calculated with these parameters.) In Figure 2, the attenuation free SED is shown by a dashed line. The model SEDs in the observer frame are calculated by multiplying the base model by with the EBL models, LHH and LLL. The EBL models LHH and LHL result in almost the same SEDs, and LLL and LLH also result in almost identical SEDs. In these calculations, we included the pair production that occurs in the emission region, but this effect is found to be negligible. The peak value in the - representation of the SSC component is given at eV and eV for before and after the attenuation by EBL, respectively. These values are much smaller than those obtained by Costamante et al. (2003). Also these are smaller than the peak energy obtained for Mrk 421 and Mrk 501 by Dwek & Krennrich (2005).
For the base model shown in Figure 2, the energy contents of the emission region are as follows; magnetic energy density ergs cm-3, nonthermal electron energy density ergs cm-3, and photon energy density ergs cm-3. Thus and this value is larger than for other TeV blazars (Kino et al., 2002). This large value of is a result of a large energy density of very high energy electrons, which is necessary to emit a large flux of TeV -rays. The high energy tail of the -ray spectrum is highly affected by the Klein-Nishina effects in inverse Compton emission and the attenuation by EBL. If the flux of EBL is larger than LLL or LLH model, much larger values of and are needed to account for the observed flux of TeV -rays.
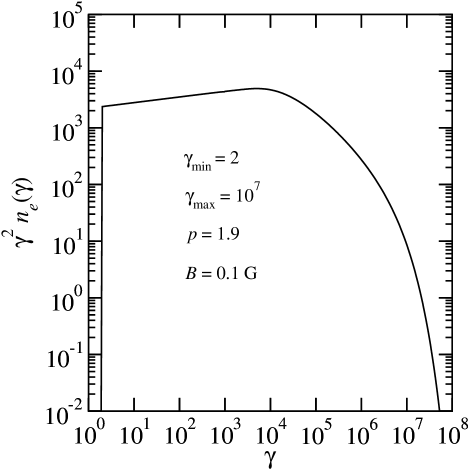
The energy spectrum of nonthermal electrons is shown in Figure 3 for the base model. The injected electron spectrum has an exponential cutoff at . The steady state energy spectrum of electrons has a peak at that is caused by the balance between radiative cooling and escape of electrons from the emission region. The observed characteristic synchrotron frequency due to electrons with is about Hz, if and G. The value of is 2 and the cooling time for electrons with this value of is so long that there is no flow in the energy space of electrons toward lower energies below .
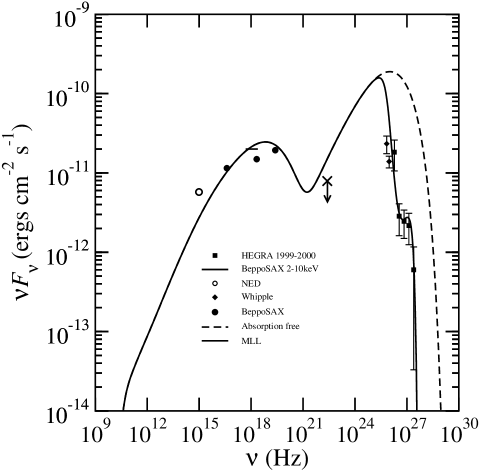
In Figure 4, a model SED with X=M, i.e., MLL, is shown. To fit the data with MLL, a very large SSC component is necessary. For this, G and the injection rate of electrons cm-3 s-1 are assumed, and other parameter values are the same as those of the base model. (The dashed line in Figure 1 is the SED calculated with these parameters.) Because the SSC component highly dominates over the synchrotron component, an extremely large value of is realized, i.e., .
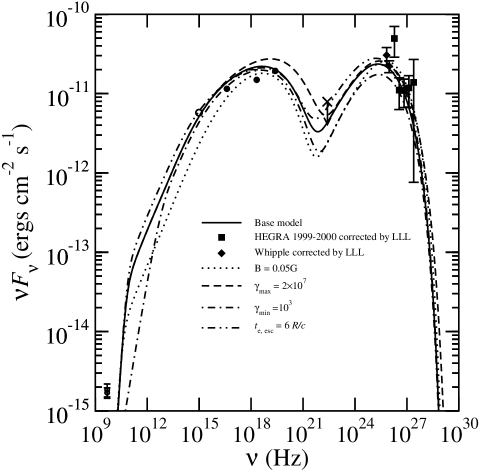
We compare the models of the emission spectrum of H1426+428 with different values of parameters in Figure 5. Note that in this figure observed -rays are corrected by multiplying to reproduce the SED before the attenuation, assuming LLL model for EBL. When the magnetic fields are weaker but the other parameter values are the same as for the base model in Figure 2, the synchrotron cooling rate decreases and the number of high energy electrons increases. As a result the SSC component has a larger luminosity. An example with G is shown by a dotted line. When the value of is larger, the synchrotron luminosity in radio decreases and the inverse Compton luminosity in the MeV region also decreases. In Figure 5, is shown by a dash-dotted line. This SED is calculated with the value of adjusted so that the peak luminosity in X-rays is almost the same as that of the base model. The difference in does not change much the spectra of X-ray and TeV -ray, although the larger value of results in a larger flux in MeV -rays. The important parameters to determine the TeV flux are and . When the value of is larger, the peak energy of synchrotron emission becomes larger, but the peak energy of the SSC component does not change much because of the Klein-Nishina effects. On the other hand, the value of does not change the spectral shape. It appears that the base model does not yield a good fit in X-ray regime, and the allowable parameter ranges are still large. Since the data in X-rays and -rays were not obtained simultaneously stronger constraints are difficult to set.
4 Summary and Discussion
We obtained the self-consistent models of the emission region of H1426+428, taking account of the interaction of TeV photons and EBL photons via . In the calculations of the emission spectrum of H1426+428, we solved the kinetic equations of electrons and photons in a relativistically moving blob. To obtain the optical depth for the attenuation () we used 12 templates of EBL constructed by Dwek & Krennrich (2005).
We found the parameter sets of H1426+428 for the models with EBL models with X = L or M and Y = L. Here X and Y represent the energy fluxes of the stellar component and 15 m band, respectively. Other EBL models require stronger emission of TeV -rays and we did not find better models of H1426+428. With Y = L, we found that the bulk Lorentz factor of H1426+428 is about 20 and that the magnetic field is G. These are similar values to those of other TeV blazars such as Mrk 421 (Kino et al., 2002). The energy density of the nonthermal electrons dominates that of magnetic fields. This is the same properties as have been found for other TeV blazars such as Mrk 421 and Mrk 501 (Kino et al., 2002), but the value of is about 190 and this is much larger than the values of about 10 for Mrk 421 and Mrk 501. The injected electron number spectrum follows a power law with a power-law index of 1.9 and has an exponential cutoff at . This value of is larger than that for Mrk 421 and Mrk 501 (Kino et al., 2002) and very efficient acceleration mechanisms is suggested in this source. The electron energy spectrum in the steady state in the emission region has a break at . Very efficient cooling by synchrotron radiation and inverse Compton scattering produces this break and a large fraction of particle energy is lost as radiation. In many models to explain the high energy -rays from blazars, the electron spectrum in the emission region is just assumed to obey a power law or a broken-power law. However, it is clear from our results that solving the kinetic equation of particles is necessary to obtain the self-consistent particle spectrum in particular when Klein-Nishina effects are significant.
The peak value of in the -ray region is attained at eV before the attenuation according to our base model. This value is significantly smaller than the peak energy estimated by Costamante et al. (2003) for H1426+428 (larger than 10 TeV) and the values estimated for Mrk 421 and Mrk 501 (-3 TeV) by Dwek & Krennrich (2005). Costamante et al. (2003) concluded that inverse Compton scattering of external soft photons produces TeV -rays, because SSC models suffer from the Klein-Nishina effects. However, our results show that there is no need for the external soft photon sources. This discrepancy originates from the use of different models of EBL. Costamante et al. (2003) used the models by Aharonian et al. (2002) and Primack et al. (2001) and these models yield higher intensity of EBL than LLL and LLH. Then the similar arguments might be raised, if EBL models such as HHH, HHL, MHH, and MHL are applied. That is, for these EBL models, TeV emission appears to have a peak above 50 TeV in SED before the attenuation and inverse Compton scattering of external soft photons might be necessary to account for the -rays spectrum. If the X-ray emission at Hz (a peak frequency in SED) is by synchrotron emission, radiating electrons have Lorentz factor of , where G and are assumed. To produce -rays with energy of 50 TeV via inverse Compton scattering by the same electrons in the Thomson regime, the energy of soft photons in the rest frame of external soft photon sources is in the IR region with the frequency of about Hz and the broad line regions can be a photon source. Because of the large cooling rate of Compton scattering of external soft photons, the values of , , and will be modified. It is, however, beyond the scope of this paper to find another model with Compton scattering of external soft photons.
Dwek & Krennrich (2005) analyzed the data of Mrk 421, Mrk 501, and H1426+428, and they rejected some EBL spectra which cause “unphysical intrinsic spectra characterized by an exponential rise at high TeV energies.” The EBL models, LLL, LLH, MLL and MLH, which are found to be good candidates for the EBL spectrum in our model, are also allowed models in Dwek & Krennrich (2005). Since they only tested the behavior of high energy -rays, their constraints may not be restrictive. In contrast, we searched for a set of parameter values that realizes multiwavelength properties of H1426+428, based on the homogeneous SSC model.
In this paper we assumed that the phase space density of EBL is constant [equation (5)]. It is possible that the EBL spectrum may not change with redshift so that , because stellar population and dust emission might be almost homogeneous for small values of . We tested this model of EBL and found the value of of LLL at TeV decreases about 18 %. Then above mentioned results with the constant phase space density of EBL are not changed much.
Because the multiwavelength data of H1426+428 have not been obtained simultaneously, the constraints on the physical condition of H1426+428 and the EBL spectrum are not stringent yet. Also, because there are several parameters to determine the emission spectrum from the jet, the allowed ranges of the parameter values are not strictly determined. According to our numerical calculations, the magnetic fields, for example, might be in the range between 0.05 and 0.2 G, and the bulk Lorentz factor might be in the range between 15 and 25. However, the properties of H1426+428 found in this work will not be changed dramatically as long as the SSC model is applied and the EBL flux at around 10 m should be as low as the model values such as LLL, LLH, MLL, and MLH.
Recent observations of PKS 2155–304 by H.E.S.S. (High Energy Stereoscopic System) showed that it emits -rays above 160 GeV and possibly above a few TeV (Aharonian et al., 2005a). Because this object is located at , the absorption of TeV -rays by EBL is probable and further constraints on the EBL spectrum will be obtained. More recently, Aharonian et al. (2005c) reported the detection of TeV -rays by H.E.S.S. from further distant blazars, i.e., H2356–309 () and 1ES 1101–232 (). Assuming that the source spectra of -rays obey a power law, , where is the differential number spectrum of -rays and is the power-law index, they set upper limits on the EBL spectrum in the wavelength band – 10 m. The EBL models of LLL and LLH that are favored in this work are consistent with the EBL models of P0.45 and P0.55 of Aharonian et al. (2005c) in – 10 m.
Dwek et al. (2005) recently examined the extragalactic nature of the excess near-infrared background light (NIRBL) (e.g., Matsumoto et al., 2005), using the analysis of the -ray spectra of blazars such as H1426+428 and PKS 2155–304. This excess NIRBL is still controversial and they argued that the excess NIRBL may not be related with the spectral imprint of the first generation of stellar objects on the EBL.
In this paper we assumed the steady state of the emission region, but the time variation of X-rays and TeV -rays of blazars is common. The time evolution of the emission spectrum might be used to constrain the emission mechanisms of blazars including external soft photons and hadronic models. Then the EBL spectrum might be constrained further. Since our numerical scheme is capable of time-dependent calculations, we may apply our model to time variable blazar emission in future work.
References
- Aharonian et al. (2002) Aharonian, F. A., et al. 2002, A&A, 384, L23
- Aharonian et al. (2003) Aharonian, F. A., et al. 2003, A&A, 403, 523
- Aharonian et al. (2005a) Aharonian, F. A., et al. 2005a, A&A, 430, 865
- Aharonian et al. (2005b) Aharonian, F. A., et al. 2005b, A&A, 441, 465
- Aharonian et al. (2005c) Aharonian, F. A., et al. 2005c, astro-ph/0508073
- Bennett et al. (2003) Bennett, C. L., et al. 2003, ApJS, 148, 1
- Costamante et al. (2001) Costamante, L., et al. 2001, A&A, 371, 512
- Costamante et al. (2003) Costamante, L., Aharonian, F., Ghisellini, G., & Horns, D. 2003, New Astronomy, 47, 677
- Coppi & Blandford (1990) Coppi, P. S., & Blandford, R. D. 1990, MNRAS, 245, 453
- De Jager & Stecker (2002) De Jager, O. C., & Stecker, F. W. 2002, ApJ, 566, 738
- Djannati-Atai et al. (2002) Djannati-Atai, A., et al. 2002, A&A, 391, L25
- Dwek & Krennrich (2005) Dwek, E., & Krennrich, F. 2005, ApJ, 618, 657
- Dwek & Slavin (1994) Dwek, E., & Slavin, J. 1993, ApJ, 436, 696
- Dwek et al. (2005) Dwek, E., Krennrich, F., & Arendt, R. G., astro-ph/0508133, to appear in ApJ
- Falcone et al. (2004) Falcone, A. D., Cui, W., & Finley, J. P. 2004, ApJ, 601, 165
- Gould & Schrèder (1966) Gould, R. J., & Schrèder, G. 1966, Phys. Rev. Lett., 16, 252
- Hartman et al. (1992) Hartman, R., et al. 1992, ApJ, 385, L1
- Hauser & Dwek (2001) Hauser, M. G., & Dwek, E. 2001, ARA&A, 39, 249
- Horan et al. (2002) Horan, D., et al. 2002, ApJ, 571, 753
- Inoue & Takahara (1996) Inoue, S., & Takahara, F. 1996, ApJ, 463, 555
- Jelly (1966) Jelly, J. V. 1966, Phys. Rev. Lett., 16, 479
- Kashlinsky (2005) Kashlinsky, A. 2005, Phys. Rep., 409, 361
- Kino et al. (2002) Kino, M., Takahara, F., & Kusunose, M. 2002, ApJ, 564, 97
- Kneiske et al. (2004) Kneiske, T. M., Bretz, T., Mannheim, K., & Hartmann, D. 2004, A&A, 413, 807
- Konopelko et al. (2003) Konopelko, A., et al. 2003, ApJ, 597, 851
- Kusunose et al. (2003) Kusunose, M., Takahara, F., & Kato, T. 2003, ApJ, 592, L5
- Li & Kusunose (2000) Li, H., & Kusunose, M. 2000, ApJ, 536, 729
- Malkan & Stecker (2001) Malkan, M. A., & Stecker, F. W. 2001, ApJ, 555, 641
- Mannheim & Biermann (1992) Mannheim, K., & Biermann, P. 1992, A&A, 253, L21
- Mannheim (1993) Mannheim, K. 1993, A&A, 269, 67
- Maraschi et al. (1992) Maraschi, L., Ghisellini, G., & Celotti, A. 1992, ApJ, 397, L5
- Marscher & Travis (1996) Marscher, A. P., & Travis, J. P. 1996, A&A, Suppl., 120, 537
- Matsumoto et al. (2005) Matsumoto, T., et al. 2005, ApJ, 626, 31
- Mücke et al. (2003) Mücke, A., et al. 2003, Astropart. Phys., 18, 593
- Nikishov (1962) Nikishov, A. I. 1962, Sov. Phys. JETP, 14, 393
- Petry et al. (2002) Petry, D., et al. 2002, ApJ, 580, 104
- Primack et al. (2001) Primack, J. R., et al. 2001, AIP Conf. Proc., 558, 463 (New York: AIP)
- Stecker et al. (1992) Stecker, F. W., De Jager, O. C., & Salamon, M. H. 1992, ApJ, 390, L49
- Stecker & Salamon (1996) Stecker, F. W., & Salamon, M. H. 1996, ApJ, 464, 600