EXAMINING THE SEYFERT – STARBURST CONNECTION WITH
ARCSECOND RESOLUTION RADIO CONTINUUM OBSERVATIONS
Abstract
We compare the arcsecond-scale circumnuclear radio continuum properties between five Seyfert and five starburst galaxies, concentrating on the search for any structures that could imply a spatial or causal connection between the nuclear activity and a circumnuclear starburst ring. No evidence is found in the radio emission for a link between the triggering or feeding of nuclear activity and the properties of circumnuclear star formation. Conversely, there is no clear evidence of nuclear outflows or jets triggering activity in the circumnuclear rings of star formation. Interestingly, the difference in the angle between the apparent orientation of the most elongated radio emission and the orientation of the major axis of the galaxy is on average larger in Seyferts than in starburst galaxies, and Seyferts appear to have a larger physical size scale of the circumnuclear radio continuum emission. The concentration, asymmetry, and clumpiness parameters of radio continuum emission in Seyferts and starbursts are comparable, as are the radial profiles of radio continuum and near-infrared line emission. The circumnuclear star formation and supernova rates do not depend on the level of nuclear activity. The radio emission usually traces the near-infrared Br and H2 1–0 S(1) line emission on large spatial scales, but locally their distributions are different, most likely because of the effects of varying local magnetic fields and dust absorption and scattering.
ACCEPTED FOR PUBLICATION IN THE ASTRONOMICAL JOURNAL
1 INTRODUCTION
Up to 10% of nearby galaxies have energetic, non-stellar Seyfert activity in their nuclei (e.g., Ho, Filippenko, & Sargent, 1997a). Currently it is unknown why this fraction is 10%, and not 100%. One of the most appealing explanations for this puzzle is the duty cycle hypothesis (e.g., Eracleous, Livio, & Binette, 1995). It can be speculated that all spiral galaxies (Seyfert activity appears almost exclusively in spiral galaxies) become active for a limited period of time in their lives. Since a typical age for a nearby spiral galaxy is 1010 years, and 10% of nearby spirals have Seyfert nuclei, the activity may last up to 109 years.
The central problem in feeding AGN activity is the supply of adequate fuel. While tidal disruption of stars in the vicinity of supermassive nuclear black holes is unlikely to be efficient enough to supply several M⊙yr-1, as is required for feeding quasar activity, the mass consumption rates in Seyferts are only on the order of 0.1 M⊙yr-1 (e.g., Bian & Zhao, 2003). Tidal disruption of stars may be a sufficient mechanism for maintaining LINER activity (Eracleous et al., 1995), but the only viable mechanism for feeding Seyfert activity appears to be the conversion of gas mass into radiation in accretion disks (Shlosman, Begelman, & Frank, 1990) that have been speculated to surround supermassive nuclear black holes. In addition to the possibility of nuclear bars, or “bars within bars”, magnetic braking in a circumnuclear ring can drive gas inflow towards a nucleus and its accretion disk (Beck et al., 1999, 2005).
Interstellar gas in the central region of a galaxy can come from at least two sources. First of these is mass loss from evolved stars. This mechanism may produce a few 0.1 M⊙yr-1 within the central few kpc (e.g., Faber & Gallagher, 1976). Another source of gas is from secular inflow, especially in a barred potential. Gravitational torques from bars are known to be capable of extracting angular momentum from the gas that piles up along the leading edge of the bar, and cause a secular inflow of gas towards the central region (e.g., Simkin et al., 1980; Noguchi, 1988; Barnes & Hernquist, 1991). If a dynamical resonance (the so-called inner Lindblad resonance, hereafter ILR; e.g., Contopoulos 1975; Athanassoula 1992) exists, gas will tend to pile up in a ring around the ILR radius (there can be 0, 1, or 2 ILRs, or in the case of a large central mass concentration, even a third ILR; gas tends to pile up and form a ring between the two outer ILRs, e.g., Knapen et al. 1995). Properties of such rings have been discussed in numerous papers. A good and comprehensive summary is given by Buta & Combes (1996).
The nuclear rings are often locations of vigorous star formation (SF). While the exact fraction of gas that is consumed by SF in these rings is not known yet (although it is likely to vary from galaxy to galaxy), it is clear that the circumnuclear rings play a crucial role in regulating the gas supply to the nucleus (e.g., Heller & Shlosman, 1996; Regan, Sheth, & Vogel, 1999). Therefore, it is of great importance to determine whether some properties of the circumnuclear rings, such as a special location of star forming regions, star forming rates, closeness to the nucleus, etc., are related to the activity class of the nucleus. Conversely, nuclear activity can have an impact on the properties of the starburst ring, e.g., in the form of star-forming activity in the circumnuclear ring triggered by a radio jet, as demonstrated on large-scale in Minkowski’s Object (e.g., Fragile et al., 2004). These issues can be studied by looking for similarities and/or differences in the ring properties and the strength of nuclear activity between Seyfert and starburst galaxies. Earlier studies of circumnuclear rings have largely concentrated on the use of ultraviolet, optical, or near-infrared (NIR) images and spectra to study the properties of SF in these regions (e.g., Benedict et al., 1993; Barth et al., 1995; Kotilainen et al., 1996a, b; Elmegreen et al., 1997, 1998; Buta, Crocker, & Byrd, 1999; Elmegreen et al., 1999; Buta et al., 2000; Kotilainen et al., 2000; Pérez–Ramírez et al., 2000; Reunanen et al., 2000; Kotilainen et al., 2001; Maoz et al., 2001; Alonso–Herrero, Ryder, & Knapen, 2001; Ryder, Knapen, & Takamiya, 2001). Direct observations of the molecular gas also exist (e.g., Sakamoto et al., 1995; Benedict et al., 1996), mostly via CO that can be used as a tracer of the more abundant molecular hydrogen with certain caveats, such as the uncertainty in the conversion of the CO luminosities into total molecular gas masses, but the spatial resolution in most CO studies has been insufficient to resolve the rings adequately.
An alternative and potentially more powerful way to study the properties of the circumnuclear rings is provided by high resolution radio continuum observations. Radio wavelengths are free of extinction effects that dust has in optical and, for high extinction, even in near-infrared images. The radio emission coming from the rings is believed to consist of two main components. First, thermal emission, tracing bremsstrahlung from free electrons in H II regions, thermalized by the optically thick medium. Second, nonthermal emission, coming from electrons spiraling in magnetic fields, either surrounding recent supernova remnants (seen in high resolution maps), or in the general magnetic field of the underlying disk galaxy (seen in low resolution, high sensitivity maps, e.g., Turner & Ho 1994), or in the enhanced magnetic field of the ring (Beck et al., 2005). Emission from AGN is also nonthermal. Nonthermal emission usually dominates the emission maps seen at 6 and 20 cm, whereas at shorter wavelengths the thermal fraction can be substantial or even dominate (e.g., Turner & Ho, 1994).
An interesting feature of radio continuum maps of several active galaxies is the strong point source in the nucleus, and jets or highly collimated outflows emanating from the nucleus. In Seyfert galaxies, these jets are usually seen at a few hundred pc scale (Schmitt et al., 2001), but they can extend to kpc scales (e.g., NGC 4258: van Albada & van der Hulst 1982; NGC 7479: Laine & Gottesman 1998). The orientation of the jets with respect to the rotation axis or disk plane of the galaxy has been observed to be fairly random (Schmitt et al., 1997). Such a collimated outflow has the potential of triggering SF in a circumnuclear region as hinted by, e.g., Bransford et al. (1998) and Minkowski’s Object (Fragile et al., 2004). The recent study by Knapen (2005) suggests that galaxies with an active nucleus may have rings more often than galaxies without such a nucleus. One of the main objectives of the current paper is to investigate if evidence for jets and triggering of SF exists among nearby Seyfert galaxies, and to contrast their circumnuclear properties to those of nearby starburst galaxies. The triggering of SF in starburst galaxies is most likely external to the circumnuclear region, as there is no strong nuclear outflow component.
Several previous investigations of the radio continuum morphology in the central regions of nearby disk galaxies have been performed (e.g., Collison et al., 1994; Saikia et al., 1994; Turner & Ho, 1994; Bransford et al., 1998; Forbes & Norris, 1998; Morganti et al., 1999; Beck et al., 2000; Nagar et al., 2000; Thean et al., 2000; Ho & Ulvestad, 2001; Beck et al., 2005). However, none of these earlier investigations either had a balanced sample between Seyfert and non-Seyfert galaxies, or supporting near-infrared line images of 2.166 m Br or 2.122 m H2 1–0 S(1) emission to study the star forming morphology and properties. Many of the previously listed studies also had resolution and sensitivity combinations that were not ideally suited to detecting extended but resolved circumnuclear structure, for which a resolution of order 1–2 arcseconds is needed, together with a sensitivity to structures tens of arcseconds in extent. Our new observations are ideal for the study of such structure. In addition, we have gathered data at several wavelengths, approximately matched in spatial resolution, to further improve the sensitivity to emission from different mechanisms at various spatial scales and to provide some information on the radio spectral indices at various locations in our targets.
2 SAMPLE AND OBSERVATIONS
Our sample consists of both Seyfert and starburst galaxies, all of which are either barred or merging systems, thus making recent gas inflow likely. We include all the nearby (within 100 Mpc) Seyfert, starburst or merging/interacting galaxies which have NIR line images of either 2.166 m Br or 2.122 m H2 1–0 S(1) emission or both available, and which do not have existing sensitive radio continuum observations at 1–2 arcsec resolution at 3.5, 6 or 20 cm. VLA sensitivity in the L-band (20 cm) improved by a factor of two in the early 1990s when the receivers were upgraded (P. Lilly and R. Perley, private communication). The C-band receivers have also improved, resulting in a sensitivity improvement, although it is not as dramatic as in the L-band. Therefore, in some cases we reobserved galaxies that had no VLA radio continuum observations at a comparable resolution since late 1980s.
General parameters of the ten galaxies that satisfied our sample selection criteria are listed in Table 1. Of our sample galaxies, five have Seyfert classifications (one Seyfert 1 and four Seyfert 2s) and five have starburst nuclei, and at least two are in merging or interacting systems. A sample of this size is useful in a pilot study such as ours to look for any trends and differences between the various nuclear activity classes. We do not distinguish between the various activity subclasses such as Seyfert 1 and Seyfert 2 galaxies in the following, but only contrast the properties of Seyfert galaxies against non-Seyfert galaxies.
| Galaxy | Hubble | Activity | Vhel | D | Bar Length | Deproj. Bar | NIR Data | |
|---|---|---|---|---|---|---|---|---|
| Type | Type | (km s-1) | (Mpc) | (mag) | (kpc) | Ellipticity | Available | |
| NGC 520 | S pec | Starburst (Merger) | 2281 | 27.8 | 12.2 | H2, Br | ||
| IC 342 | SAB(rs)cd | Starburst | 31 | 3.9 | 9.1 | 1.7 | 0.43 | H2, Br |
| NGC 4536 | SAB(rs)bc | Starburst | 1808 | 13.3 | 11.2 | 1.2 | 0.37 | H2 |
| NGC 6240a | I0: pec | Sy2 (Merger) | 7339 | 96.1 | 13.8 | H2 | ||
| NGC 6574a | SAB(rs)bc | Sy2 | 2282 | 35.0 | 12.8 | 1.7 | 0.47 | H2, Br |
| NGC 6764a | SB(s)bc | Sy2 | 2416 | 37.0 | 12.6 | 9.9 | 0.69 | H2, Br |
| NGC 7469 | (R’)SAB(rs)a | Sy1.2 | 4892 | 64.4 | 13.0 | 0.7 | 0.52 | Br |
| NGC 7479a | SB(s)c | Sy2 | 2381 | 32.4 | 11.6 | 7.5 | 0.74 | H2, Br |
| NGC 7714a | SB(s)b:pec | Starburst | 2798 | 36.9 | 13.0 | 7.7 | 0.52 | H2, Br |
| NGC 7771a | SB(s)a | Starburst | 4277 | 56.4 | 13.1 | 8.8 | 0.62 | H2, Br |
aGalaxy also observed at 3.5 or 6 cm.
Very Large Array (VLA) observations of the sample galaxies were taken during three separate observing sessions (see Table 2). The galaxies were mixed both among and within the two observing sessions to maximize the coverage. Weather conditions were excellent for the 6 cm run, while cloud cover was between 15% and 75% for the 3.5 and 20 cm runs. These wavelengths were selected because they give approximately comparable spatial resolutions when observed with the VLA in its A configuration (20 cm), B configuration (6 cm), and C configuration (3.5 cm). The 3.5 cm band was used instead of the 2 cm band because of its higher sensitivity. The large range of wavelengths also gives us some leverage to inspect differences in the distribution of thermal (3.5 cm) and non-thermal (20 cm) emission. The absolute flux calibration is based on 5–10 minute scans of 3C 48 and 3C 286. The target galaxy observations were bracketed between 1–2 minute scans of nearby phase calibrators, and their fluxes were bootstrapped to those of the primary calibrators. The derived fluxes for the phase calibrators were then compared to values found in the VLA calibrator flux density database to check their reasonableness. Uncertainties in the quoted fluxes are dominated by the uncertainty in setting the absolute flux scale, and are estimated to be less than 10%. Uncertainties in positions are estimated to be less than 01.
For maximum sensitivity we used both intermediate frequencies, with bandwidths of 50 MHz, and separated by 50 MHz. After minimal editing of the visibilities and calibration, we used the AIPS task IMAGR to Fourier transform the observed visibilities into brightness distribution maps on the sky. The “dirty” maps were deconvolved using the CLEAN procedure (Högbom, 1974; Clark, 1980) by placing “clean boxes” around the central area of the map (the galaxy) and around nearby background sources that may have sidelobes that cause additional noise in the mapped field. The images were cleaned down to about three times the theoretical root mean square (rms) noise limit of the maps. We used no tapering and set the ROBUST parameter in IMAGR to zero, resulting in maps which are a compromise between maximum resolution and maximum sensitivity. Our typical synthesized beam sizes, tabulated in Table 3, have FWHM values around 13 at 6 and 20 cm, and 25 at 3.5 cm. We applied phase-only self-calibration for the brightest sources in the sample, resulting in a slight improvement in the S/N ratio. The expected theoretical rms sensitivities were obtained in most cases where sidelobe contamination from background sources is not severe.
| Parameter | Session 1 | Session 2 | Session 3 |
|---|---|---|---|
| Dates | 1999 Jul 25, 27 | 1999 Nov 26 | 2000 Jun 3–4 |
| Configuration | A | B | C |
| Maximum number of antennas | 27 | 26 | 27 |
| Length of observations (hr) | 2.5, 4 | 3 | 2 |
| Frequency (GHz) | 1.4250 | 4.8601 | 8.4601 |
| Bandwidth (MHz) | 100 | 100 | 100 |
| Primary flux calibrator | 3C 286, 3C 48 | 3C 48 | 3C 286 |
| Assumed flux of primary flux calibrator (Jy) | 14.554, 16.319 | 5.516 | 5.181 |
3 RESULTS
3.1 Radio Structure and Power
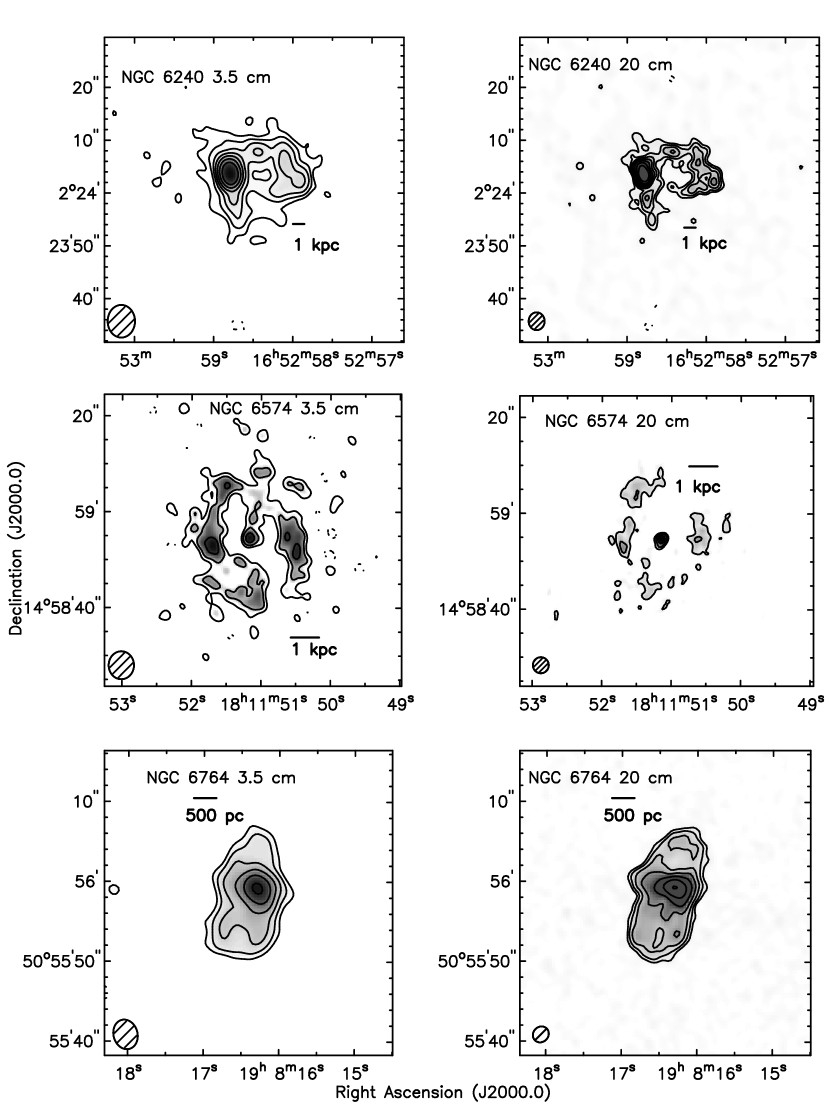
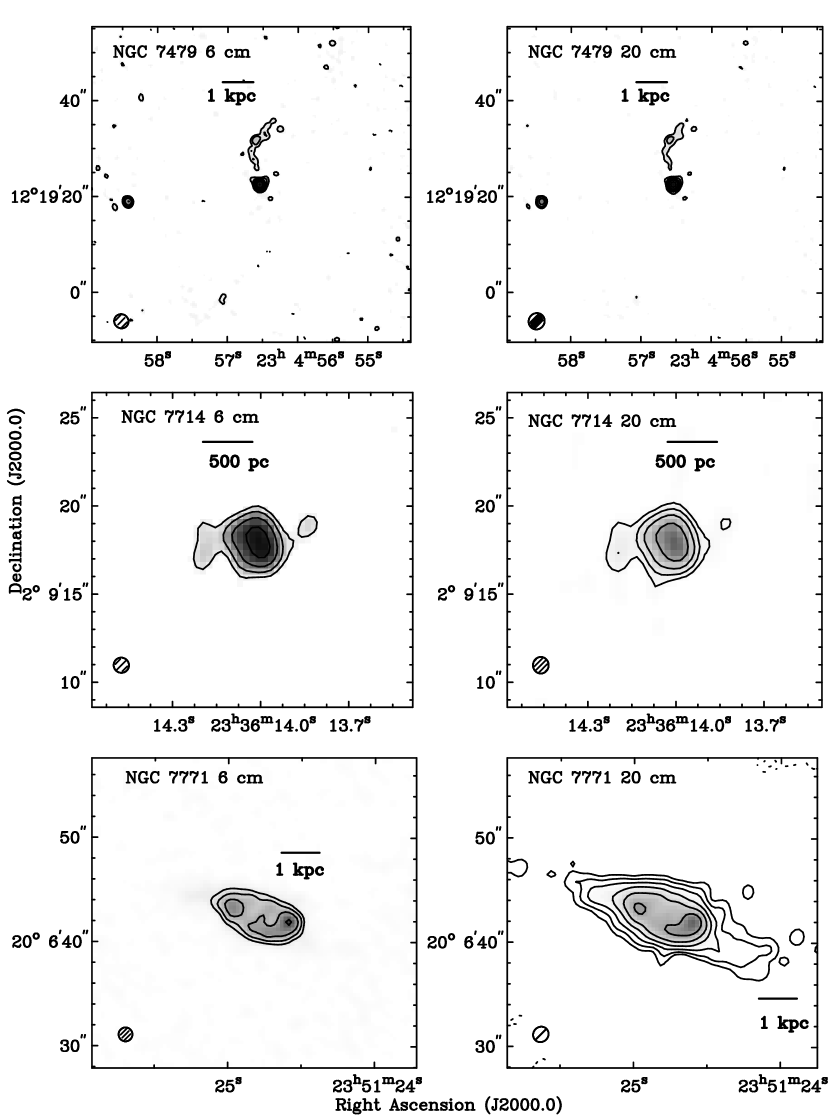
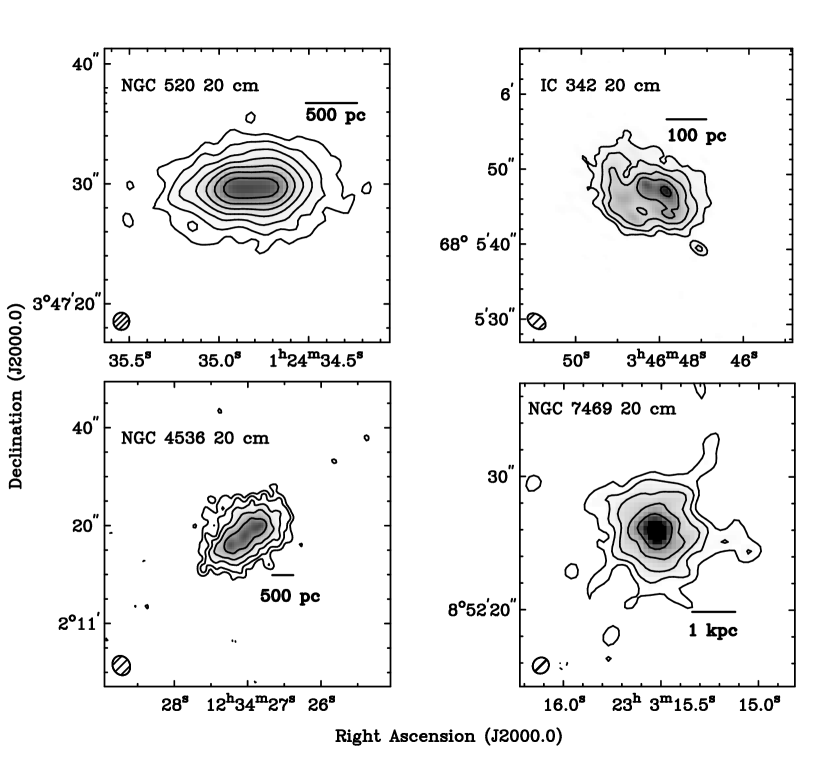
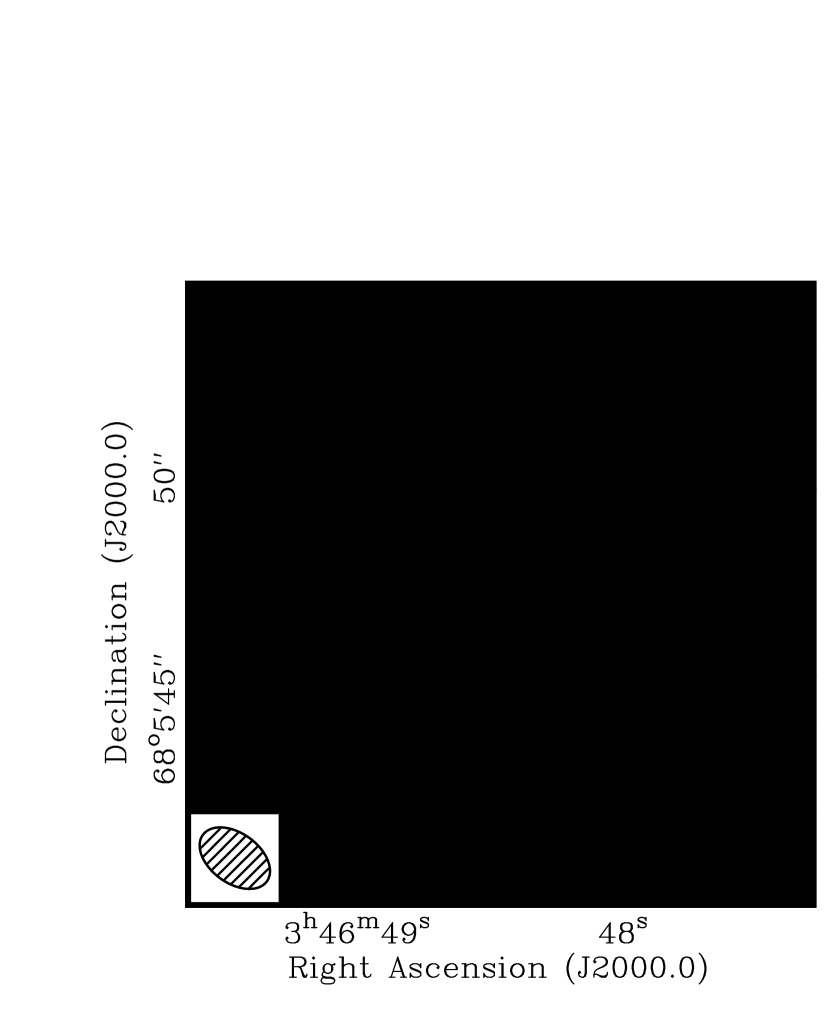
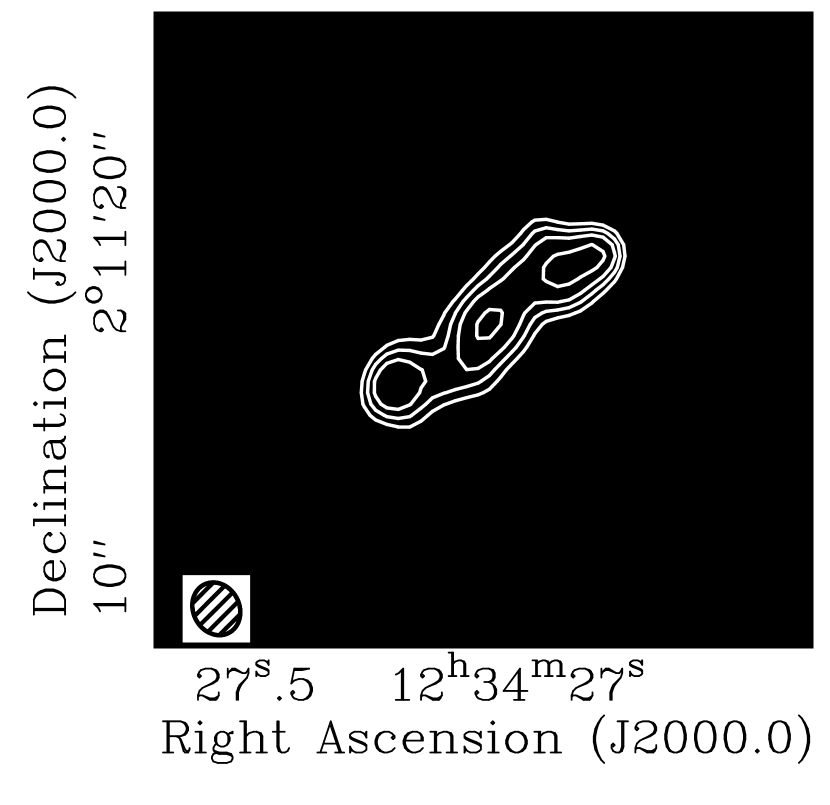
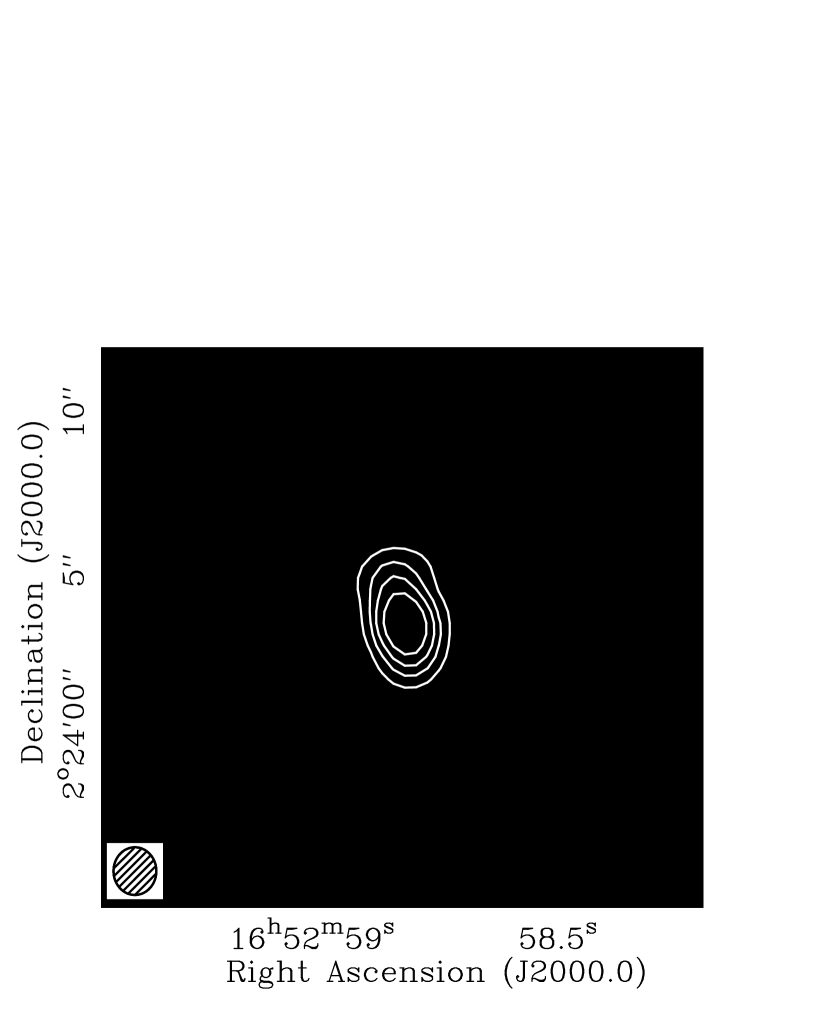
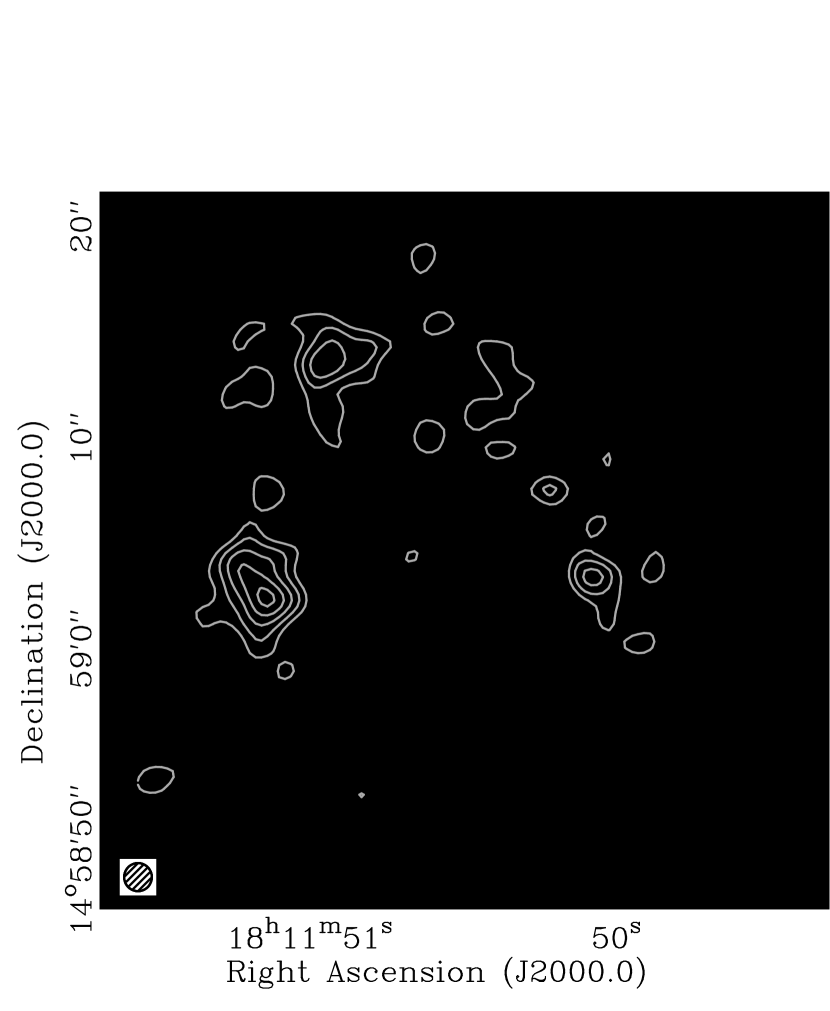
Gray-scale and contour images of the radio continuum emission at 3.5, 6, and 20 cm from our sample galaxies are presented in Figure 1. The integration times and several other parameters of the final maps are given in Table 3. Figure 2 shows the radial surface brightness profiles of 3.5, 6, and 20 cm radio continuum, H2 1–0 S(1) emission, and Br emission. In Figures 3–8 we show the radio continuum emission together with either molecular hydrogen H2 1–0 S(1) or Br emission maps, or both.
| Galaxy | Map Parameters | Source Parameters | ||||||||
|---|---|---|---|---|---|---|---|---|---|---|
| Int. Time | Beam | P. A. | rms | Total Flux | Total Flux | Log Total Radio | U/Ea | Morph. | ||
| (cm) | (sec) | (arcsec arcsec) | (deg) | (Jy bm-1) | (VLA; Jy) | (Single dish; Jy) | Power (W Hz-1) | |||
| NGC 520 | 20 | 700 | 1.44 1.33 | 0 | 65 | 0.170 | 0.158 | 22.2 | 0% | C |
| IC 342 | 20 | 810 | 1.70 1.07 | 54 | 90 | 0.131 | 2.25 | 20.2 | 0% | R, E |
| NGC 4536 | 20 | 660 | 1.67 1.42 | 29 | 51 | 0.131 | 0.126 | 21.4 | 0% | L, E |
| NGC 6240 | 20 | 760 | 1.48 1.33 | 0 | 43 | 0.108 | 0.59 | 23.1 | 29% | C, R |
| NGC 6240 | 3.5 | 700 | 2.72 2.28 | 0 | 66 | 0.115 | … | 23.1 | 40% | C, R |
| NGC 6574 | 20 | 3590 | 1.34 1.32 | 0 | 42 | 0.030 | … | 21.6 | 4% | C, R |
| NGC 6574 | 3.5 | 1940 | 2.33 2.11 | 0 | 29 | 0.026 | … | 21.6 | 2% | C, R |
| NGC 6764 | 20 | 780 | 1.39 1.26 | 135 | 53 | 0.101 | … | 22.2 | 12% | C, L |
| NGC 6764 | 3.5 | 1040 | 2.50 2.00 | 16 | 54 | 0.029 | … | 21.7 | 24% | C, L |
| NGC 7469 | 20 | 1080 | 1.40 1.29 | -46 | 211 | 0.181 | 0.192 | 23.0 | 18% | C, E |
| NGC 7479 | 20 | 610 | 1.38 1.32 | -32 | 29 | 0.005 | 0.100 | 20.8 | 50% | C, L |
| NGC 7479 | 6 | 1590 | 1.21 1.17 | 56 | 21 | 0.006 | 0.041 | 20.9 | 39% | C, L |
| NGC 7714 | 20 | 4770 | 1.38 1.30 | -2 | 83 | 0.0153 | 0.047 | 21.4 | 29% | C, E |
| NGC 7714 | 6 | 4340 | 1.28 1.26 | 58 | 95 | 0.0141 | … | 21.4 | 30% | C, E |
| NGC 7771 | 20 | 1040 | 1.33 1.24 | -45 | 26 | 0.0252 | 0.128 | 22.0 | 6% | R, E |
| NGC 7771 | 6 | 2270 | 1.16 1.15 | 0 | 21 | 0.0263 | 0.047 | 22.0 | 8% | R, E |
aRatio of unresolved to resolved emission flux densities. The nuclear source was fitted with a Gaussian and if its FWHM values were practically identical to the FWHM values of the beam, the nuclear source was called “unresolved.”
The morphology of the radio continuum emission varies from centrally peaked (NGC 520, NGC 7469, NGC 7714) to elongated or ring-like emission (IC 342, NGC 4536, NGC 6240, NGC 6574, NGC 7771) to outflows or jets (NGC 6764, NGC 7479). The orientations of the circumnuclear radio continuum structure at 20-cm and the position angle of the main disk of the underlying galaxy are given in Table 4, together with the projected difference between the two and the inclination angle. The major axis of the radio continuum emission was determined by fitting a two-dimensional Gaussian to the brightest point, after smoothing the image to 10 arcsec resolution, and used as the orientation of the radio emission. Most commonly the detected circumnuclear radio continuum structures are aligned close to the major axis of the galaxy, implying that they are most likely emission coming from synchrotron radiation from electrons spiraling in the magnetic fields of the disk. For NGC 7469 and NGC 7714 the orientation of the radio continuum emission was very difficult to determine, and therefore the discrepant values for these galaxies imply that there is only a more or less circular, extended nuclear component. The discrepant value for NGC 6240 is due to the peculiar western radio continuum loop, discussed in detail by Colbert, Wilson, & Hawthorn (1994). In NGC 6764 the almost perpendicular radio continuum emission suggests an outflow. The outflow will be discussed in more detail in another paper (S. Leon et al. 2005, in preparation). The Seyfert systems in our sample have an average difference of 60 degrees in the orientation of their radio continuum emission with respect to the position angle of the galaxy major axis. On the other hand, for the starburst galaxies the average value for the difference is 20 degrees, or only 8 degrees if we exclude the uncertain case of NGC 7714. Such a difference between Seyfert and starburst galaxies could be explained by the existence of out of plane radio jets and outflows that take place preferentially in Seyfert galaxies. Our sample is too small to meaningfully compare the results to those of Schmitt et al. (1997), who found that the nuclear radio continuum structures in Seyfert 2 galaxies appear to have a fairly arbitrary orientation with respect to the galaxy major axis.
| Galaxy | Orientat. of R.C. | Galaxy Position Angle | Difference | Major Axis Size | Inclination |
|---|---|---|---|---|---|
| (deg) | (deg) | (deg) | (kpc) | (deg) | |
| NGC 520 | 97 | 93 | 4 | 1.6 | 70 |
| IC 342 | 63 | 40 | 23 | 0.3 | 31 |
| NGC 4536 | 128 | 130 | 2 | 0.9 | 66 |
| NGC 6240 | 95 | 20 | 75 | 5.1 | 70 |
| NGC 6574 | 10 | 160 | 30 | 4.1 | 37 |
| NGC 6764 | 161 | 62 | 81 | 2.2 | 62 |
| NGC 7469 | 28 | 125 | 83 | 2.9 | 47 |
| NGC 7479 | 170 | 22 | 32 | 2.5 | 51 |
| NGC 7714 | 126 | 4 | 68 | 1.1 | 52 |
| NGC 7771 | 69 | 68 | 1 | 3.6 | 75 |
| Galaxy | Asymmetry | Clumpiness | Concentration |
|---|---|---|---|
| NGC 520 | 0.37 | 0.42 | 0.59 |
| IC 342 | 0.56 | 0.25 | 0.39 |
| NGC 4536 | 0.38 | 0.21 | 0.20 |
| NGC 6240 | 0.90 | 0.38 | 0.73 |
| NGC 6574 | 0.50 | 0.39 | 0.11 |
| NGC 6764 | 0.66 | 0.28 | 0.55 |
| NGC 7469 | 0.27 | 0.30 | 0.69 |
| NGC 7479 | 0.58 | 0.57 | 0.56 |
| NGC 7714 | 0.27 | 0.47 | 0.81 |
| NGC 7771 | 0.43 | 0.31 | 0.38 |
| Seyf. Avg. | 0.58 | 0.380.10 | 0.530.22 |
| Non-Seyf. Avg. | 0.40 | 0.330.10 | 0.470.21 |
In general, the radial radio and near-infrared line emission profiles follow each other (Figure 2). Exceptions are IC 342, where the high surface brightness near-infrared line emission extends to larger radii than the radio emission, NGC 6574, where Br emission has a peak that is not seen in the other three profiles, at radii around 10 arcsec from the center, and NGC 7771 where the Br profile rises from the nucleus within 2 arcsec, indicating the location of the starburst ring, while the other profiles are either constant or falling. The differences in the radio continuum morphology and near-IR line emission morphology are likely to be due to the varying the spatial distribution of dust absorption (near-IR lines) and magnetic fields (radio continuum). The radio profiles for galaxies which had radio observations at two wavelengths also follow each other well, except for NGC 6574. For NGC 6574 the starburst ring is better visible at 3.5 cm. No systematic differences are seen between the profile trends and the relative radial displacement of the various emissions between Seyfert and starburst galaxies.

The size scale of the radio continuum emission in kpc is also listed in Table 4. This was taken as the major axis length of the FWHM of the two-dimensional Gaussian fit to the 20-cm emission in an image smoothed to 10 arcsec resolution, except for galaxies which essentially only have a nuclear component and little extended emission. For these, and NGC 6574 where the extended emission is well separated from the nuclear emission, the 4-sigma contours in Figure 1 were used. The average scale size of the radio continuum emission in Seyferts is 3.4 kpc (rms 1.1 kpc) and in starburst galaxies 1.5 kpc (rms 1.1 kpc). However, two of the nearest galaxies are in the starburst sample, and the lack of information in our observations at large scales (resolved out by the interferometer) does not warrant us to conclude that the size scales of circumnuclear radio continuum emission are different between the Seyfert and starburst galaxies. However, this is an interesting result that warrants follow-up studies using larger samples that are selected to have galaxies at comparable distances.
In Table 1 we list the deprojected bar lengths and ellipticities for our sample galaxies when a bar was detected. The deprojection method was identical to that used by Laine et al. (2002). We note that the galaxies with ring-like morphologies (except the peculiar case of NGC 6240, see below) all have bars. It has been established quite well that bars create resonance rings in the circumnuclear area (e.g., Sellwood & Wilkinson, 1993, and references therein). The connection between the nuclear activity, bar properties, and circumnuclear rings is less well established. Within our small sample, four galaxies have long and strong (high ellipticity) bars (NGC 6764, NGC 7479, NGC 7714, and NGC 7771). Two of these are Seyferts and two are starbursts. Four of our sample galaxies have short and weak bars (IC 342, NGC 4536, NGC 6574, and NGC 7469). Again, two of these are Seyferts and two are starbursts. All the tabulated types of radio continuum morphologies are found among the galaxies with long and strong bars (centrally peaked, NGC 7714; linear “jet-like”, NGC 7479; ring-like, NGC 7771; and outflow, NGC 6764). Ring, linear, and centrally peaked radio continuum morphologies are also found among the galaxies with short and weak bars.
The distance-independent radio powers at 20 cm are listed in Table 3. One should note that these powers are measured within widely varying physical sizes in the galaxies (from 400 pc in IC 342 to 9.8 kpc in NGC 6240, see Table 4). It appears that the Seyfert galaxies are slightly more powerful than the starburst galaxies in radio wavelengths. The merging system NGC 6240 has the largest radio power. There also appears to be a slight tendency towards higher radio powers among the more strongly barred galaxies. This is in agreement with the result of Beck et al. (2002) who found that the average surface brightness in radio continuum correlates with the relative bar length.
Table 3 also includes an attempt to estimate the fraction of the radio continuum emission coming from the nuclear unresolved component, after fitting a Gaussian to it to estimate its flux density. In all cases, the extended emission dominates. Three out of five non-Seyfert galaxies have no unresolved component, while the average fraction of flux contributed by the unresolved component is about 25% for the Seyfert galaxies.
Finally, Table 5 shows the CAS (Concentration, C, Asymmetry, A, and Clumpiness, S) measurements at 20 cm for all the sample galaxies. These measurements were made in a way similar to that in Conselice (2003). Concentration was measured in 3 and 10 arcsec radius apertures. In cases where the central structure is clearly elliptical (NGC 520, NGC 4536, NGC 7771) the measurements were made in elliptical annuli aligned along the major axis of the structure and having a major axis length of 3 and 10 arcsec. Naturally, since the distances of the galaxies vary by a large factor, these apertures measure different physical scales, but we consider that it is more important to measure the concentration regardless of the physical scale, since in almost all galaxies most of the detected radio continuum emission lies in scales 10–20 arcsec or less. The galaxies with the highest concentration indices are NGC 7771, NGC 6240, and NGC 7469, as also seen in the radio continuum emission figures. The asymmetry was calculated by rotating the image by 180 degrees, then subtracting the rotated image from the original, taking the absolute value of the difference, and dividing the result by the original image. In addition, we only considered regions that had emission at higher than 4-sigma level in the original image (which was thus used as a mask). If a galaxy was perfectly symmetric, then the asymmetry index would have a value of zero. High values indicate a large degree of asymmetry. In NGC 7469 we used 8-sigma as the threshold for masking. The most asymmetric galaxy is NGC 6240 with its one-sided emission structure. Clumpiness was calculated by subtracting an image smoothed to 5 arcsec resolution from the original image, then dividing the result by the original image. Thus, clumpy galaxies will have large clumpiness index values. The uncertainties in the measured quantities are estimated to be 0.15 for asymmetry, 0.1 for clumpiness, and 0.05 for concentration.
The average asymmetry, clumpiness, and concentration are not statistically different between Seyfert and non-Seyfert galaxies (Table 5). Therefore, we do not find any differences in the circumnuclear CAS properties in our sample of Seyfert and starburst galaxies.
3.2 Star Formation and Radio Emission
We searched the literature for SF and supernova (SN) rates in the central regions of our sample galaxies. The results are displayed in Table 6. The given numbers have been adjusted to our adopted distances as given in Table 1. Unfortunately, it was not possible to find the SF and SN information for all the sample galaxies. The SN rate was estimated from Br fluxes together with starburst models, or from radio continuum (usually at 20 cm). Since there exists a relationship between Br and non-thermal radio continuum fluxes, the two methods are tied to each other. We expect Type II supernovae to be the main contributors to the cosmic rays emitting the observed radio continuum in the circumnuclear starburst regions (e.g., Pannuti, 2000). Note that the nonthermal radio continuum emission intensity strongly depends on the strength of the magnetic field which may also be enhanced in the starburst regions (Beck et al., 2005). The SF rates in our sample galaxies vary between quiescent SF (a few tenths of M☉ yr-1) to several M☉ yr-1. The SF rates between Seyfert and starburst galaxies do not have any obvious differences. It is also well known that many Seyfert 2 galaxies have associated circumnuclear starbursts (e.g., Pogge, 1989). Most of the SN rates are between 0.01 and 0.15 yr-1, and there is no obvious difference between Seyferts and starbursts. The highest SN rate, perhaps not surprisingly, is in the merging system NGC 6240.
| Galaxy | SF Rate | SN Rate | Reference | SF Rel. RC |
| (M⊙ yr-1) | (yr-1) | |||
| NGC 520 | 10 | 0.1 | 1 | coincident |
| IC 342 | 0.42 | 0.05 | 2, 3 | |
| NGC 4536 | … | 0.01 | 4 | clumpier RC |
| NGC 6240 | 278 | 2.8 | 5, 6 | extra RC loop |
| NGC 6574 | 2.3 | 0.01 | 7 | Br “bar” not seen in RC |
| NGC 6764 | 0.4 | 0.01 | 8 | outflow seen in RC and molecular gas |
| NGC 7469 | 29 | 0.33 | 9, 10 | |
| NGC 7479 | 0.6 | … | 11 | extra radio jet seen in RC |
| NGC 7714 | 20 | 0.15 | 1 | coincident |
| NGC 7771 | 10 | 0.06 | 12 |
We also studied the morphology and location of SF, traced mostly by Br emission, with respect to the radio continuum emission. The results are again given in Table 6. No clear trend can be seen. While the star formation is coincident with the radio continuum emission in a few galaxies, there are SF features seen in only one image, but not the other. This again suggests that radio continuum, especially at 6 and 20 cm, is not a reliable tracer of the location of SF activity, but it traces the overall magnetic fields of the galaxy where electrons released in SN events spiral and produce synchrotron radiation (Beck et al., 2005). Magnetic fields are only important if the nonthermal fraction of the emission is significant. Below we have estimated the contribution of the thermal emission for the galaxies which had 3.5-cm observations.
3.3 Notes on Individual Galaxies
3.3.1 NGC 520
NGC 520 is a merger system, presumably in an intermediate stage of merging, according to Toomre (1977). The primary nucleus (the southeast nucleus) lies behind an intricate dust lane (Laine et al., 2003), and the optical, including H, emission is highly extinguished there (Bernlöhr, 1993; Laine et al., 2003). However, the decreasing extinction in NIR allows the detection of Br emission in the nuclear area (Kotilainen et al., 2001). The radio continuum emission is much more extended than the Br emission, but the highest intensity, elongated radio continuum emission region coincides well with the Br emission (see Fig. 3). Since the origin of Br emission is SF, and the 20 cm radio continuum is most likely nonthermal emission from electrons generated by supernovae in starburst regions, this spatial coincidence is expected. The H2 emission is slightly more extended than the Br emission in NGC 520. There is no sign of circumnuclear ring structures either in radio continuum or in optical images. This is most likely due to the fact that the galaxy disk is highly inclined to the line of sight (Sanders et al., 1988). Our new data are more than a factor of two deeper than the Hummel et al. (1987) data taken in the same VLA configuration. The emission can be traced reliably within a 12 arcsec 8 arcsec area in our image, whereas the Hummel et al. (1987) map (only 6 cm shown, no 20 cm data shown) shows a structure of only 6 arcsec 2.5 arcsec in extent. Our new 20-cm image shows more extended emission and hints at clumpy structure at lower emission levels, not seen in the 20-cm VLA map published by Condon et al. (1990). Earlier sub-arcsec resolution VLA radio continuum observations at 2 cm (Carral, Turner, & Ho, 1990), 6 cm (Condon et al., 1982), and 20 cm (Beswick et al., 2003) show a highly flattened and elongated multicomponent structure, corresponding to the highest intensity radio continuum structure seen in our 20 cm VLA image. The extended emission that we see in our map is resolved out in the Beswick et al. (2003) 20 cm map.
3.3.2 IC 342
IC 342 is the closest actively star-forming large spiral galaxy that has an almost face-on orientation to our line-of-sight. Bauer et al. (2003) suggest that the recent starburst of at least 0.5 M⊙ yr-1 in IC 342 was quite different from the archetypal starbursts, since there is a lack of hot gas and luminous infrared emission. The nuclear cluster in IC 342 presumably formed in a starburst about 60 Myr ago (Böker, Förster–Schreiber, & Genzel, 1997, 1999). The registration of the radio continuum image with the H2 1–0 S(1) line image (from Böker et al., 1997) in Figure 4 is uncertain because of the lack of absolute coordinate information in the latter image. We matched the position of the most intense emission on the northwest side of the ring, and checked that the northeast emission feature matches spatially. Assuming the registration that we used is correct, the ring-like structure in radio continuum matches well with a similar structure seen in molecular hydrogen emission, and also in other line images shown by Böker et al. (1997). Böker et al. (1997) explained the ring as the inner Lindblad resonance ring of a weak stellar bar. A ring-like structure is also seen in optical HST -band (Böker et al., 1999) and archival H images, although the emission maxima in optical seem to anticorrelate with the radio and near-IR emission maps. This ring-like structure is bounded from outside by strong dust lanes, seen in optical HST images. The overall structure in our map is similar to the earlier 20-cm radio continuum map made at a comparable resolution by Condon et al. (1982), and the 6-cm map in Turner & Ho (1983). However, our maps are more sensitive and therefore we are able to see fainter structures. Our new map has a higher signal-to-noise ratio than the 3 cm and 6 cm observations by Becklin et al. (1980).
3.3.3 NGC 4536
NGC 4536 is another nearby starburst galaxy. The molecular hydrogen 1–0 S(1) emission near the center was investigated by Davies, Sugai, & Ward (1997; see also Fig 5). They saw a strong NIR continuum peak in the nucleus, but the molecular hydrogen emission has peaks distributed in a pseudo-ring structure around the nucleus. Archival HST images taken in near the - and -band show that the radio continuum clumps are spatially correlated with SF regions in the spiral arms that are close to the nucleus in projection, and not the nucleus itself. The radio continuum observations of Vila et al. (1990) at 6-cm show a similar overall structure with peaks outside the nucleus, but their image has a much lower sensitivity than our new data. Our new VLA data at 20 cm are at least a factor of three deeper than the older Vila et al. (1990) data and show extended emission and three peaks lined up in the central region. Similarly, our observation is more sensitive than the 20-cm observation of Condon et al. (1982), allowing us to see fainter structures.
3.3.4 NGC 6240
NGC 6240 is a famous merging system, where two nuclei are close to merging together. The overall nuclear area of this system has LINER (Veilleux et al., 1995) and Seyfert 2 (e.g., Rafanelli et al., 1997) classifications. Two components are seen in sub-arcsec resolution radio continuum images (e.g., Carral et al., 1990; Beswick et al., 2001; Gallimore & Beswick, 2004), but our 1–2 arcsec resolution data do not resolve the two merging nuclei, either at 3.5 cm or at 20 cm. In fact, Gallimore & Beswick (2004) see even three radio components in VLBA observations of the nuclear region, two of which are likely to be Seyfert nuclei, based on their radio powers and brigthness temperatures, and one which could be a radio supernova. One of the Seyfert nuclei also has jet-like extensions. According to Lira et al. (2002) the AGN component has a bolometric luminosity of about 5 1045 erg s-1, making NGC 6240 a very powerful Seyfert galaxy. Only one peak is seen in the H2 line observations of van der Werf et al. (1993), who interpret the central peak to be located between the two nuclei as a result of a strong collision shock in the ISM (see Fig. 6). The recent H2 1–0 S(1) observations by Max et al. (2005) show a bridge of warm molecular gas between the northern and southern active nuclei. A similar offset of the peak from the nuclei is seen in the maps of Tecza et al. (2000). The [Fe II] 1.64 m and Br emission, on the other hand, coincide with the two nuclei (van der Werf et al., 1993; Tecza et al., 2000). The SF activity in the nuclear region was recently studied by Pasquali et al. (2004), who found extremely high SF and SN rates in the nucleus (see Table 6). Gerssen et al. (2004) studied the high resolution morphology using HST NICMOS and WFPC2 observations. They see up to four nuclear components, and a superwind from a nuclear starburst roughly in the east–west direction. Recent Chandra observations of the nucleus of NGC 6240 have revealed two main emission peaks, implying the existence of two supermassive black holes, associated with the two merging nuclei (Komossa et al., 2003). The high SF and SN rates presumably drive a powerful superwind. The radio continuum emission in the nuclear region is most likely a combination of synchrotron emission from electrons created by the high SN rate, and non-thermal emission from the active nuclei (Beswick et al., 2001). Scaling the 20 cm emission (assuming it is all nonthermal and using a spectral dependence of S -0.6, 0.6 being a typical spectral index for the galaxies in our sample that had both 6 cm and 20 cm images) to 3.5 cm and subtracting it we estimate that a considerable fraction of the emission at 3.5 cm can be thermal, up to 60%. However, the spectral index of the non-thermal emission down to 3.5 cm is not known for NGC 6240.
The most peculiar structure in this system is the extended western “arm” of radio continuum emission, which has several embedded peaks. This morphology has been interpreted as a result of synchrotron emission from a superwind, driven by the intense starburst in the nucleus (Colbert et al., 1994). Cosmic rays are generated in SF regions and propagate into the magnetic features. Our observation of the radio continuum morphology (the angle between the P.A. of the underlying galaxy and the radio continuum emission) supports such a scenario. It is likely that the superwind seen in detail in the arcsec-resolution HST images of Gerssen et al. (2004), is related to the peculiar radio continuum structure. We note that NGC 6240 is the most radio powerful galaxy in our sample, and has the highest SF and SN rates, together with nuclear activity. Our new 3.5-cm data have a similar resolution to the 3.5-cm data discussed by Colbert et al. (1994). We show our new data set for comparison with the old data. Antonucci (1985) published 6-cm data at a comparable resolution. Those data reveal a similar overall morphology as our map at 20 cm, but at a much lower sensitivity.
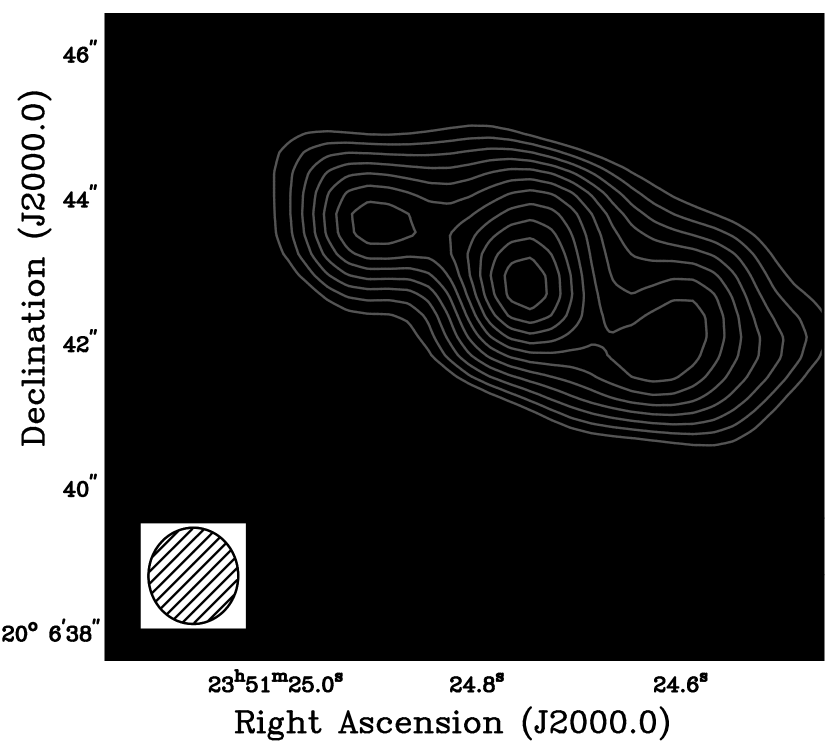
3.3.5 NGC 6574
NGC 6574 is a nearby Seyfert 2 galaxy. It is the only galaxy in our sample that displays a central point-like radio continuum component, a circumnuclear ring, and a connecting radio continuum feature between the two. Note that the ring was not detected in the early VLA high resolution radio continuum observations of Vila et al. (1990), most likely because of inadequate sensitivity. Our new data are a factor of five more sensitive than the old data published by Vila et al. (1990). The “jet” is one-sided and is only at the 3 level in the 20-cm map (Figure 7). At 3.5 cm, where no previous high resolution data exist to our knowledge, there is a connection between the nucleus and the circumnuclear ring on the opposite side of the nucleus at 6 level. This “jet” has a major-axis radius of about 10 arcsec (just under 2 kpc). These “jets” lie close to the major axis of the galaxy, and therefore are unlikely to represent any outflows perpendicular to the galaxy disk. Interestingly, there is moderate strength H2 emission near the end of the southern “jet” (see Fig. 7). An estimate of the thermal emission in the 3.5 cm image, constructed in a similar way to what was described above for NGC 6240, also shows that there is likely to be a substantial thermal component to the 3.5 cm emission in the ring north of the nucleus. The Br emission at this location is weak, so the northeastern radio continuum bridge is unlikely to be related to a “jet” striking the circumnuclear ring and triggering of SF there. The nucleus seems to have only nonthermal radiation at 3.5 cm, while elsewhere in the ring the thermal contribution could be up to 50%, based on estimating the nonthermal contribution from the 20 cm image by scaling it down to 3.5 cm with a spectral index of 0.6. There appears to be a nuclear stellar (and perhaps gaseous, seen by Kotilainen et al. 2000) bar at a position angle of about 150 degrees, inside the ring. The strongest radio continuum emission occurs in the ring east of the nucleus, as does the strongest Br and H2 1–0 S(1) emission (see Fig. 7). There is a fairly good coincidence between the H2 1–0 S(1) and radio continuum emission, although there is a region of moderately strong radio continuum emission south–southeast of the nucleus in the ring that does not show up in the near-infrared line emission. However, the absence of any detected H2 emission there is likely to be due to the narrow bandwidth of the Fabry–Perot interferometer filter used in the observations of Kotilainen et al. (2000). An archival HST WFPC2 ultraviolet image at 3000 Å shows a patchy star-forming ring, but the detailed spatial correlation with the strongest radio and NIR line emission is poor within the ring.
3.3.6 NGC 6764
There is a remarkable outflow structure clearly revealed by our radio continuum images of NGC 6764, approximately perpendicular to the galaxy major axis, and therefore probably perpendicular to the plane of the galaxy (see Figure 1). The only other earlier data at comparable resolution at 20 cm were published by Condon et al. (1982), but those data have a sensitivity that is a factor of two worse than in our new data. The 6-cm and 21-cm Westerbork maps by Baum et al. (1993) have a lower spatial resolution and sensitivity than our maps. Our map shows clear cavities in the radio continuum emission, not shown by the Condon et al. (1982) map. Our 3.5-cm map is the first high resolution map showing the radio continuum morphology at that wavelength. Despite the outflow morphology, the SF and SN rates are not remarkably high, and therefore it is possible that continuous SF models give too low SF rates, and there actually was a starburst near the nucleus about 3–5 Myr ago, as suggested by Schinnerer et al. (2000), who also discuss the molecular gas outflow in this galaxy. There appears to be little thermal emission in NGC 6764 at 3.5 cm, based on the scaling of the 20 cm emission with a spectral index of 0.6. Since this galaxy has a relatively strong stellar bar, there is a clearly identifiable mechanism to bring fuel to the central active region. H2 1–0 S(1) and Br emission in NGC 6764 is relatively weak (J. Kotilainen et al., unpublished). The nucleus of NGC 6764 has activity of Seyfert 2 or LINER type while also having a clear starburst signature (Rubin et al., 1975; Gonçalves et al., 1999). The bolometric luminosity of the nucleus in NGC 6764 is about 5 1043ergs s-1 (Eckart et al., 1996), including both the starburst and non-stellar component.
3.3.7 NGC 7469
NGC 7469 has a Seyfert 1.2 nucleus and a starburst ring of diameter 3 arcsec around the nucleus (Miles et al., 1996) is seen in a well-resolved WFPC2 image (Malkan et al., 1997). In radio continuum at 1–2 arcsec resolution the nucleus shows up as an unresolved point source which is surrounded by diffuse emission (see Figure 1). The ring is not resolved in our radio continuum images. Condon (1980) shows a 6-cm image, but no 20-cm data. His 6-cm map suffers from a highly elongated beam. Ulvestad, Wilson, & Sramek (1981) show a 6-cm map at 1–2 arcsec resolution, but it suffers from an elongated beam, and shows suspicious features not seen in our new 20-cm map. Unger et al. (1987) show a 20-cm map at about 1.5–2 arcsec resolution from observations taken in 1983. Their map has a lower S/N than our new map, and a poorer spatial resolution, and their map does not show the extended emission as well as our new map. Sub-arcsecond resolution radio continuum images by Wilson et al. (1991), Colina et al. (2001), Thean et al. (2001), and Lal, Shastri, Gabuzda (2004) resolved the nuclear and ring components, but those maps do not show the extended emission seen in our new map. VLBI observations have shown that the nucleus actually consists of three emitting regions aligned in the east–west direction (Lonsdale et al., 2003). ROSAT observations (Perez–Olea & Colina, 1996) also show centrally-peaked emission, somewhat similar to the radio continuum morphology in our new image at 20 cm. NIR line imaging observations show hints of the starburst ring at a radius of about 1.5 arcsec (Genzel et al., 1995). The radio power of NGC 7469 is among the highest in our sample, probably reflecting the powerful Seyfert 1 nucleus. The bolometric luminosity is about 8 1044 ergs s-1 (Lonsdale et al., 2003). The star formation rate in the nucleus, using continuous SF models, is also very high, around 30 M⊙yr-1 (Genzel et al., 1995).
3.3.8 NGC 7479
Neff & Hutchings (1992) present a 20-cm image taken with VLA in A configuration in 1989, and therefore, in comparable resolution to our new data. However, our new 20-cm map has a higher sensitivity due to VLA L-band sensitivity improvement in the early 90s by a factor of two. Ho & Ulvestad (2001) published comparable resolution maps at both 6 and 20 cm. We choose to show the map from our observations, and it can be compared to that displayed in Figure 15 of Ho & Ulvestad (2001). The jet-like structure of NGC 7479, seen in our Figure 1, was noted by Laine & Gottesman (1998), and is the subject of a detailed study with polarized radio continuum emission (Beck & Laine, in preparation). The jet-like feature probably has a magnetic origin. However, there is no clear evidence for jet-like features that would connect to the circumnuclear region, and trigger activity there. The jet-like structure has a total extent of several kpc, if it lies in the galaxy plane. However, it is more likely that it is an out-of-plane structure (Beck & Laine, in preparation). The radio continuum has a point-like nucleus that is unresolved even in sub-arcsec resolution MERLIN radio continuum observations (S. Laine, unpublished). The nucleus was classified as Seyfert 1.9 by Ho et al. (1997b) and LINER by Keel (1983). The unpublished NIR line observations show a nuclear disk (with a diameter of about 3 arcsec) of H2 1–0 S(1) emission. The center also has a molecular gas disk seen in CO observations (Laine et al., 1999), which peaks at the position of the radio continuum peak, within the uncertainties. Archival HST NICMOS and WFPC2 images show a strong dust lane approaching from the northwest and continuing to within a few tens of pc from the moderately bright nucleus. No circumnuclear ring has been detected within the strong stellar bar. The SF estimate is uncertain due to the large amount of dust and gas near the nucleus.
3.3.9 NGC 7714
NGC 7714 is a nearby interacting starburst galaxy. There is a strong nuclear and circumnuclear starburst. The Br emission (and the H2 1–0 S(1) emission) has an extension towards east–southeast, also hinted by our radio continuum images at 6 and 20 cm (see Figure 1). This coincides with a spiral arm -like star forming feature seen in an HST WFPC2 F606W image (Smith, Struck, & Nowak, 1999). In addition to the NIR line features, our radio continuum images show a point source about three arcseconds to the west-northwest of the nuclear component, perhaps hinted at in the H2 1–0 S(1) image of Kotilainen et al. (2001). Continuous SF models give a very high star formation rate for NGC 7714, 20 M⊙ yr-1 (Kotilainen et al., 2001). An earlier 6-cm image by Weedman (1981) has a much lower S/N, and shows suspicious structures not seen in our new, higher sensitivity data. The 6-cm image in Stine (1992) does not show the same structures that are apparent in our new images, due to a different contrast in gray-scale and contour spacing.
3.3.10 NGC 7771
NGC 7771 is another interacting starburst galaxy that has a clear circumnuclear starburst ring. However, this galaxy is highly inclined (75°) to the line of sight. The southwestern side of the ring has the strongest radio continuum emission both at 6 cm and 20 cm, as well as in Br emission (Fig. 8; NIR data from Reunanen et al. 2000). Our data are a factor of five deeper than earlier 6-cm observations at comparable resolution by Batuski, Hanisch, & Burns (1992). Sub-arcsecond resolution radio continuum observations have resolved the ring into numerous components, and they also reveal a nuclear radio continuum component (Neff & Hutchings, 1992). Note that the more extended emission that we see in our new data are resolved out in these higher resolution observations. The constant SF model would require very high SF rates, and therefore it is more likely that the SF took place in a starburst 6–7 Myr ago (Reunanen et al., 2000). A very recent starburst in this galaxy was also suggested by Smith et al. (1999), who performed a case study of SF in the circumnuclear area of this galaxy, using new near-infrared data and existing high resolution radio images.
4 SUMMARY
Our sample of ten starburst, Seyfert, and merging or interacting galaxies has revealed a mixed morphology in their circumnuclear regions. Ring, linear, and “jet-like” structures, and nuclear point sources are seen in all three types of galaxies. We looked carefully for the connection between the nucleus and the surrounding region, to obtain further clues about what makes galaxies active. Our results reinforce the notion that there is no unambiguous feature even in the radio continuum emission that would indicate how the nuclear activity and the surrounding 1-kpc scale circumnuclear region are causally linked to each other, or how they would evolve together. The active nuclei do not reveal any jets or other channels by which they would trigger SF in the surrounding disk or ring. Nor does there seem to be any particular features in the circumnuclear rings or disks that could be used as indicators of nuclear activity. Studies at other wavelengths have also concluded that there are no obvious causal or spatial connections between the nuclear activity and the properties of the circumnuclear region (Storchi-Bergmann et al., 2001; Martini et al., 2003; Marquez et al., 2004).
We have tabulated the radio powers in the circumnuclear region of our sample galaxies. Seyfert galaxies appear to have slightly larger average radio powers. In galaxies that have a core component, the ratio of the core component to circumnuclear extended radio continuum emission is typically between 30% and 40%, independent of the activity or interaction class of the galaxy. The physical size of the circumnuclear radio emission region is typically 1–2 kpc, although there is a hint that Seyferts may have larger circumnuclear radio emission sizes than non-Seyferts. There is no correlation between the AGN bolometric luminosity and the radio morphology. For example, the Seyferts with the largest AGN luminosities in our sample (NGC 6240 and NGC 7469) exhibit different morphologies. NGC 6240 possesses small-scale jets and a nuclear outflow, which is likely connected to the peculiar western radio continuum loop. NGC 7469 has an aligned multicomponent radio continuum structure seen with VLBI observations, but its circumnuclear radio morphology seen in our 1.4 arcsec resolution observations does not present any specific structures, only a nuclear component with some diffuse emission around it. The AGN with lower bolometric luminosities have a widely varying radio continuum structure as well. NGC 6574 has a circumnuclear radio continuum ring, NGC 6764 has an outflow structure in radio continuum, and finally NGC 7479 has peculiar large-scale radio “jets.” A nuclear starburst exhibits itself in various ways in the radio continuum morphology. NGC 6764 has a clear outflow morphology, while NGC 6240 has a peculiar loop structure on one side of the nucleus, possibly as a result of a superwind from several supernova explosions in the nucleus (Colbert et al., 1994). Perhaps the most intriguing structure is seen in NGC 7479, which has a jet-like morphology, together with a core component, but no extended nuclear starburst region. This galaxy has been speculated to be experiencing a minor merger (Laine & Heller, 1999). It also has a massive molecular disk around the nucleus (Laine et al., 1999). Future research is warranted into investigating any connection between a minor merger, the nuclear activity, and the radio “jet.”
We have compared the radial surface brightness profiles of radio emission and Br and/or H2 line emission. While the starburst rings show up clearly in the Br emission, we see no systematic differences between the Seyfert and starburst galaxies in these profiles. We also calculated the CAS parameters for our sample galaxies. Again, the average concentration, asymmetry, and clumpiness parameters are not significantly different between Seyfert and starburst galaxies. The orientation of the radio continuum emission differs from the orientation of the galaxy major axis more in Seyferts than in starbursts. We have also used SF and SN rates found in the literature to estimate how they depend on the distribution of radio continuum emission and the activity class of the galaxy. We have inspected the correlation of the SF and SN rates with the strength non-stellar nuclear activity or interaction class, but found no clear trends.
Finally, we have compared the radio continuum morphology to that of NIR line emission morphologies, including Br and H2 line emission, when available. We find that the bulk of the radio continuum usually traces the sum of the Br and H2 line emission fairly reliably. However, several extranuclear radio continuum emission features not visible in the NIR line images were found, including the jet-like structures and the outflow-type structures. These differences are likely caused by the effects of dust absorption and scattering (affecting near-IR emission) and the spatial distribution and strength of magnetic fields (affecting radio continuum emission).
Our results will be extended and validated in a follow-up study that includes a much larger sample of Seyfert and starburst galaxies. The information content of the radio continuum observations will be increased by including polarization information. Unfortunately, such observations are time-expensive, and the next step we intend to take includes a detailed study of the magnetic origin of the jet-like structure in NGC 7479.
References
- Alonso–Herrero et al. (2001) Alonso–Herrero, A., Ryder, S. D., & Knapen, J. H. 2001, MNRAS, 322, 757
- Antonucci (1985) Antonucci, R. R. J. 1985, ApJS, 59, 499
- Athanassoula (1992) Athanassoula, E. 1992, MNRAS, 259, 345
- Baker et al. (1977) Baker, J. R., Haslam, C. G. T., Jones, B. B., & Wielebinski, R. 1977, A&A, 59, 261
- Barnes & Hernquist (1991) Barnes, J. E., & Hernquist, L. E. 1991, ApJ, 370, L65
- Barth et al. (1995) Barth, A. J., Ho, L. C., Filippenko, A. V., & Sargent, W. L. 1995, AJ, 110, 1009
- Batuski et al. (1992) Batuski, D. J., Hanisch, R. J., & Burns, J. O. 1992, AJ, 103, 1077
- Baum et al. (1993) Baum, S. A., O’Dea, C. P., Dallacassa, D., de Bruyn, A. G., & Pedlar, A. 1993, ApJ, 419, 553
- Bauer et al. (2003) Bauer, F. E., Brandt, W. N, & Lehmer, B. 2003, AJ, 126, 2797
- Beck et al. (1999) Beck, R., Ehle, Shoutenkov, V,., Shukurov, A., & Sokoloff, D. 1999, Nature, 397, 324
- Beck et al. (2005) Beck, R., Fletcher, A., Shukurov, A., Snodin, A., Sokoloff, D. D., Ehle, M., Moss, D., & Shoutenkov, V. 2005, A&A, in press (astro-ph/0508485)
- Beck et al. (2000) Beck, S. C., Turner, J. L., & Kovo, O. 2000, AJ, 120, 244
- Beck et al. (2002) Beck, R., Shoutenkov, V., Ehle, M., Harnett, J. I., Haynes, R. F., Shukurov, A., Sokoloff, D. D., & Thierbach, M. 2002, A&A, 391, 83
- Becklin et al. (1980) Becklin, E. E., Gatley, I., Matthews, K., Neugebauer, G., Sellgren, K., Werner, M. W., & Wynn-Williams, C. G. 1980, ApJ, 236, 441
- Benedict et al. (1993) Benedict, G. F., et al. 1993, AJ, 105, 1369
- Benedict et al. (1996) Benedict, G. F., Smith, B. J., & Kenney, J. D. P. 1996, AJ, 111, 1861
- Bernlöhr (1993) Bernlöhr, K. 1993, A&A, 270, 20
- Beswick et al. (2001) Beswick, R. J., Pedlar, A., Mundell, C. G., & Gallimore, J. F. 2001, MNRAS, 325, 151
- Beswick et al. (2003) Beswick, R. J., Pedlar, A., Clemens, M. S., & Alexander, P. 2003, MNRAS, 346, 424
- Bian & Zhao (2003) Bian, W.-H., & Zhao, Y.-H. 2003, PASJ, 55, 599
- Böker et al. (1997) Böker, T., Förster–Schreiber, N. M., & Genzel, R. 1997, AJ, 114, 1883
- Böker et al. (1999) Böker, T., van der Marel, R. P., & Vacca, W. D. 1999, AJ, 118, 831
- Bransford et al. (1998) Bransford, M. A., Appleton, P. N, Heisler, C. A., Norris, R. P., & Marston, A. P. 1998, ApJ, 497, 133
- Buta & Combes (1996) Buta, R., & Combes, F. 1996, Fundam. Cosmic Phys., 17, 95
- Buta et al. (1999) Buta, R., Crocker, D. A., & Byrd, G. G. 1999, AJ, 118, 2071
- Buta et al. (2000) Buta, R., Treuthardt, P., Byrd, G. G., & Crocker, D. A. 2000, AJ, 120, 1289
- Carral et al. (1990) Carral, P., Turner, J. L., & Ho, P. T. P. 1990, ApJ, 362, 434
- Clark (1980) Clark, B. G. 1980, A&A, 89, 377
- Colbert et al. (1994) Colbert, E. J. M., Wilson, A. S., & Bland–Hawthorn, J. 1994, ApJ, 436, 89
- Colina et al. (2001) Colina, L., Alberdi, A., Torrelles, J. M., Panagia, N., & Wilson, A. S. 2001, ApJ, 553, L19
- Collison et al. (1994) Collison, P. M., Saikia, D. J., Pedlar, A., Axon, D. J., & Unger, S. W. 1994, MNRAS, 268, 203
- Condon (1980) Condon, J. J. 1980, ApJ, 242, 894
- Condon & Broderick (1988) Condon, J. J., & Broderick, J. J., 1988, AJ, 96, 30
- Condon et al. (1982) Condon, J. J., Condon, M. A., Gisler, G., & Puschell, J. J. 1982, ApJ, 252, 102
- Condon et al. (1991) Condon, J. J., Frayer, D. T., & Broderick, J. J. 1991, AJ, 101, 362
- Condon et al. (1990) Condon, J. J., Helou, G., Sanders, D. B., & Soifer, B. T. 1990, ApJS, 73, 359
- Conselice (2003) Conselice, C. J. 2003, ApJS, 147, 1
- Contopoulos (1975) Contopoulos, C. 1975, ApJ, 201, 566
- Crosthwaite et al. (2000) Crosthwaite, L. P., Turner, J. L., & Ho, P. T. P. 2000, AJ, 119, 1720
- Crosthwaite et al. (2001) Crosthwaite, L. P., Turner, J. L., Hurt, R. L., Levine, D. A., Martin, R. N., & Ho, P. T. P. 2001, AJ, 122, 797
- Davies et al. (1997) Davies, R. I., Sugai, H., & Ward, M. J. 1997, MNRAS, 291, 314
- de Vaucouleurs et al. (1991) de Vaucouleurs G., de Vaucouleurs A., Corwin H. G. Jr., Buta R. J., Paturel G., & Fouque, P., 1991, Third Reference Catalogue of Bright Galaxies (New York: Springer)
- Eckart et al. (1996) Eckart, A., Cameron, M., Boller, Th., Krabbe, A., Blietz, M., Nakai, N., Wagner, S. J., & Sternberg, A. 1996, ApJ, 472, 588
- Elmegreen et al. (1997) Elmegreen, D. M., Chromey, F. R., Santos, M., & Marshall, D. 1997, AJ, 114, 1850
- Elmegreen et al. (1998) Elmegreen, D. M., Chromey, F. R., & Warren, A. R. 1998, AJ, 116, 2834
- Elmegreen et al. (1999) Elmegreen, D. M., Chromey, F. R., Sawyer, J. E., & Reinfeld, E. L. 1999, AJ, 118, 777
- Eracleous et al. (1995) Eracleous, M., Livio, M., & Binette, L. 1995, ApJ, 445, L1
- Faber & Gallagher (1976) Faber, S. M., & Gallagher, J. S. 1976, ApJ, 204, 365
- Forbes & Norris (1998) Forbes, D. A., & Norris, R. P. 1998, MNRAS, 300, 757
- Fragile et al. (2004) Fragile, P. C., Murray, S. D., Anninos, P., & van Breugel, W. 2004, ApJ, 604, 74
- Gallimore & Beswick (2004) Gallimore, J. F., & Beswick, R. 2004, AJ, 127, 239
- Genzel et al. (1995) Genzel, R., Weitzel, L., Tacconi–Garman, L. E., Blietz, M., Cameron, M., Krabbe, A., & Lutz, D. 1995, ApJ, 444, 129
- Gerssen et al. (2004) Gerssen, J., van der Marel, R. P., Axon, D., Mihos, J. C., Hernquist, L., & Barnes, J. E. 2004, AJ, 127, 75
- Gonçalves et al. (1999) Gonçalves, A. C., Véron–Cetty, & M.–P., Véron, P. 1999, A&AS, 135, 437
- Grosbøl (1985) Grosbøl, P. 1985, A&ASuppl. Ser., 60, 261
- Heller & Shlosman (1996) Heller, C. H., & Shlosman, I. 1996, ApJ, 471, 143
- Ho et al. (1997a) Ho, L. C., Filippenko, A. V., & Sargent, W. L. W. 1997a, ApJ, 487, 568
- Ho et al. (1997b) Ho, L. C., Filippenko, A. V., & Sargent, W. L. W. 1997b, ApJS, 112, 315
- Ho & Ulvestad (2001) Ho, L. C., & Ulvestad, J. S. 2001, ApJS, 133, 77
- Högbom (1974) Högbom, J. A. 1974, A&AS, 15, 417
- Hummel et al. (1987) Hummel, E., van der Hulst, J. M., Keel, W. C., & Kennicutt, R. C., Jr. 1987, A&A, Suppl. Ser., 70, 517
- Jogee et al. (2005) Jogee, S., Scoville, N. Z., & Kenney, J. D. P. 2005, ApJ, submitted
- Keel (1983) Keel, W. C. 1983, ApJS, 52, 229
- Knapen (2005) Knapen, J. H. 2005, A&A, 429, 141
- Knapen et al. (1995) Knapen, J. H., Beckman, J. E., Heller, C. H., Shlosman, I., & de Jong, R. S. 1995, ApJ, 454, 623
- Komossa et al. (2003) Komossa, S., Burwitz, V., Hasinger, G., Predehl, P., Kaastra, J. S., & Ikebe, Y. 2003, ApJ, 582, L15
- Kotilainen et al. (1996a) Kotilainen, J. K., Forbes, D. A., Moorwood, A. F. M., van der Werf, P. P., & Ward, M. J. 1996a, A&A, 313, 771
- Kotilainen et al. (1996b) Kotilainen, J. K., Moorwood, A. F. M., Ward, M. J., & Forbes, D. A. 1996b, A&A, 305, 107
- Kotilainen et al. (2000) Kotilainen, J. K., Reunanen, J., Laine, S., & Ryder, S. D. 2000, A&A, 353, 834
- Kotilainen et al. (2001) Kotilainen, J. K., Reunanen, J., Laine, S., & Ryder, S. D. 2001, A&A, 366, 439
- Laine & Gottesman (1998) Laine, S., & Gottesman, S. T. 1998, MNRAS, 297, 1041
- Laine & Heller (1999) Laine, S., & Heller, C. H. 1999, MNRAS, 308, 557
- Laine et al. (1999) Laine, S., Kenney, J. D. P., Yun, M. S., & Gottesman, S. T. 1999, ApJ, 511, 709
- Laine et al. (2002) Laine, S., Shlosman, I., Knapen, J. H., & Peletier, R. F. 2002, ApJ, 567, 97
- Laine et al. (2003) Laine, S., van der Marel, R. P., Rossa, J., Hibbard, J. E., Mihos, J. C., Böker, T., & Zabludoff, A. I. 2003, AJ, 126, 2717
- Lal et al. (2004) Lal, D. V., Shastri, P, & Gabuzda, D. C. 2004, A&A, 425, 99
- Lira et al. (2002) Lira, P., Ward, M. J., Zezas, A., & Murray, S. S. 2002, MNRAS, 333, 709
- Lonsdale et al. (2003) Lonsdale, C. J., Lonsdale, C. J., Smith, H. E., & Diamond, P. J. 2003, ApJ, 592, 804
- Malkan et al. (1997) Malkan, M. A., Gorjian, V., & Tam, R. 1997, ApJS, 117, 25
- Maoz et al. (2001) Maoz, D., Barth, A. J., Ho, L. C., Sternberg, A., & Filippenko, A. V. 2001, AJ, 121, 3048
- Marquez et al. (2004) Márquez, I., et al. 2004, A&A, 416, 475
- Martin & Friedli (1997) Martin, P., & Friedli, D. 1997, A&A, 326, 449
- Martini et al. (2003) Martini, P., Regan, M. W., Mulchaey, J. S., & Pogge, R. W. 2003, ApJ, 589, 774
- Max et al. (2005) Max, C. E., Canalizo, G., MacIntosh, B. A., Raschke, L, Whysong, D., Antonucci, R., & Schneider, G. 2005, ApJ, 621, 738
- Miles et al. (1996) Miles, J. W., Houck, J. R., Hayward, T. L., & Ashby, M. L. N. 1996, ApJ, 465, 191
- Mirabel & Sanders (1988) Mirabel, I. F., & Sanders, D. B. 1988, ApJ, 335, 104
- Morganti et al. (1999) Morganti, R., Tsvetanov, Z. I., Gallimore, J., & Allen, M. G. 1999, A&AS, 137, 457
- Nagar et al. (2000) Nagar, N. M., Falcke, H., Wilson, A. S., & Ho, L. C. 2000, ApJ, 542, 186
- Neff & Hutchings (1992) Neff, S. G., & Hutchings, J. B. 1992, AJ, 103, 1746
- Noguchi (1988) Noguchi, M. 1988, A&A, 203, 259
- Nordgren et al. (1997) Nordgren, T. E., Chengalur, J. N., Salpeter, E. E., & Terzian, Y. 1997, AJ, 114, 77
- Pannuti (2000) Pannuti, T. G. 2000, Ph.D. thesis, Univ. of New Mexico
- Pasquali et al. (2004) Pasquali, A., Gallagher, J. S., & de Grijs, R. 2004, A&A, 415, 103
- Perez–Olea & Colina (1996) Perez–Olea, D. E., & Colina, L. 1996, ApJ, 468, 191
- Pérez–Ramírez et al. (2000) Pérez–Ramírez, D. M., Peletier, R. F., Knapen, J. H., Laine, S., Doyon, R., & Nadeau, D. 2000, MNRAS, 317, 234
- Pogge (1989) Pogge, R. 1989, ApJ, 345, 730
- Rafanelli et al. (1997) Rafanelli, P., Schulz, H., Barbieri, C., Komossa, S., Mebold, U., Baruffolo, A., & Radovich, M. 1997, A&A, 327, 901
- Regan et al. (1999) Regan, M. W., Sheth, K., & Vogel, S. N. 1999, ApJ, 526, 97
- Reunanen et al. (2000) Reunanen, J., Kotilainen, J. K., Laine, S., & Ryder, S. D. 2000, ApJ, 529, 853
- Rubin et al. (1975) Rubin, V. C., Thonnard, R., Ford, W. K. 1975, ApJ, 199, 31
- Ryder et al. (2001) Ryder, S. D., Knapen, J. H., & Takamiya, M. 2001, MNRAS, 323, 663
- Saikia et al. (1994) Saikia, D. J., Pedlar, A., Unger, S. W., & Axon, D. J. 1994, MNRAS, 270, 46
- Sakamoto et al. (1995) Sakamoto, K., Okumura, S., Minezaki, T., Kobayashi, Y, & Wada, K. 1995, AJ, 110, 2075
- Sakamoto et al. (1999) Sakamoto, K., Okumura, S. K., Ishizuki, S., & Scoville, N. Z. 1990, ApJS, 124, 403
- Sanders et al. (1988) Sanders, D. B., Scoville, N. Z., Sargent, A. I., & Soifer, B. T. 1988, ApJ, 324, L55
- Schinnerer et al. (2000) Schinnerer, E., Eckart, A., & Boller, Th. 2000, ApJ, 545, 205
- Schmitt et al. (1997) Schmitt, H. R., Kinney, A. L., Storchi–Bergmann, T., & Antonucci, R. 1997, ApJ, 477, 623
- Schmitt et al. (2001) Schmitt, H. R., Ulvestad, J. S., Antonucci, R. R. J., & Kinney, A. L. 2001, ApJS, 132, 199
- Sellwood & Wilkinson (1993) Sellwood, J. A., & Wilkinson A., 1993, Rep. Prog. Phys., 56, 173
- Shlosman et al. (1990) Shlosman, I., Begelman, M. C., & Frank, J. 1990, Nature, 345, 679
- Simkin et al. (1980) Simkin, S. M., Su, H. J., & Schwarz, M. P. 1980, ApJ, 237, 404
- Smith et al. (1999) Smith, B. J., Struck, C., & Nowak, M. A. 2005, AJ, 129, 1350
- Smith et al. (1999) Smith, D. A., Herter, T., Haynes, M. P., & Neff, S. G. 1999, ApJ, 510, 669
- Smith et al. (1998) Smith, H. E., Lonsdale, C. J., & Lonsdale, C. J. 1998, ApJ, 492, 137
- Sramek (1975) Sramek, R. 1975, AJ, 80, 771
- Stine (1992) Stine, P. C. 1992, ApJS, 81, 49
- Storchi-Bergmann et al. (2001) Storchi-Bergmann, T., González Delgado, R. M., Schmitt, H. R., Cid Fernandes, R., & Heckman, T. 2001, ApJ, 559, 147
- Tacconi et al. (1999) Tacconi, L. J., Genzel, R., Tecza, M., Gallimore, J. F., Downes, D., & Scoville, N. Z. 1999, ApJ, 524, 732
- Tecza et al. (2000) Tecza, M., Genzel, R., Tacconi, L. J., Anders, S., Tacconi-Garman, L. E., & Thatte, N. 2000, ApJ, 537, 178
- Thean et al. (2000) Thean, A., Pedlar, A., Kukula, M. J., Baum, S. A., & O’Dea, C. P. 2000, MNRAS, 314, 573
- Thean et al. (2001) Thean, A. H. C., Gillibrand, T. I, Pedlar, A., & Kukula, M. J., 2001, MNRAS, 327, 36
- Toomre (1977) Toomre, A. 1977, in “The Evolution of Galaxies and Stellar Populations,” ed. B. M. Tinsley & R. B. Larson (New Haven: Yale Univ.), 401
- Tully (1988) Tully, R. B. 1988, Nearby Galaxies Catalog, (Cambridge: Cambridge Univ. Press)
- Turner & Ho (1983) Turner, J. L., & Ho, P. T. P. 1983, ApJ, 268, L79
- Turner & Ho (1994) Turner, J. L., & Ho, P. T. P. 1994, ApJ, 421, 122
- Turner & Hurt (1992) Turner, J. L., & Hurt, R. L. 1992, ApJ, 384, 72
- Ulvestad et al. (1981) Ulvestad, J. S., Wilson, A. S., & Sramek, R. A. 1981, ApJ, 247, 419
- Unger et al. (1987) Unger, S. W., Lawrence, A., Wilson, A. S., Elvis, M.; & Wright, A. E. 1987, MNRAS, 228, 521
- van Albada & van der Hulst (1982) van Albada, G. D., & van der Hulst, J. M. 1982, A&A, 115, 263
- van der Werf et al. (1993) van der Werf, P. P., Genzel, R., Krabbe, A., Blietz, M., Lutz, D., Drapatz, S., Ward, M. J., & Forbes, D. A. 1993, ApJ, 405, 522
- Veilleux et al. (1995) Veilleux, S., Kim, D.–C., Sanders, D. B., Mazzarella, J. M., & Soifer, B. T. 1995, ApJS, 98, 171
- Vila et al. (1990) Vila, M. B., Pedlar, A., Davies, R. D., Hummel, E., & Axon, D. J. 1990, MNRAS, 242, 379
- Weedman (1981) Weedman, D. W., Feldman, F. R., Balzano, V. A., Ramsey, L. W., Sramek, R. A., & Wuu, C.-C. 1981, ApJ, 248, 105
- Wilson et al. (1991) Wilson, A. S., Helfer, T. T., Haniff, C. A., Ward, & M. J. 1991, ApJ, 381, 79
- Yun & Hibbard (2001) Yun, M. S., & Hibbard, J. E. 2001, ApJ, 550, 104