A Method for Determining the Physical Properties of the Coldest Known Brown Dwarfs
Abstract
We present a method for measuring the physical parameters of the coldest T-type brown dwarfs using low resolution near infrared spectra. By comparing H2O- and H2-sensitive spectral ratios between empirical data and theoretical atmosphere models, and calibrating these ratios to measurements for the well-characterized 2–5 Gyr companion brown dwarf Gliese 570D, we derive estimates of the effective temperatures and surface gravities for 13 mid- and late-type field T dwarfs. We also deduce the first quantitative estimate of subsolar metallicity for the peculiar T dwarf 2MASS 0937+2931. Derived temperatures are consistent with prior estimates based on parallax and bolometric luminosity measurements, and examination of possible systematic effects indicate that the results are robust. Two recently discovered late-type T dwarfs, 2MASS 09392448 and 2MASS 11142618, both appear to be 50 K cooler than the latest-type T dwarf, 2MASS 0415-0935, and are potentially the coldest and least luminous brown dwarfs currently known. We find that, in general, higher surface gravity T dwarfs have lower effective temperatures and luminosities for a given spectral type, explaining previously observed scatter in the Teff/spectral type relation for these objects. Masses, radii and ages are estimated for the T dwarfs in our sample using the evolutionary models of Burrows et al.; we also determine masses and radii independently for eight T dwarfs with measured luminosities. These two determinations are largely consistent, lending support to the validity of evolutionary models at late ages. Our method is well suited to large samples of faint brown dwarfs, and can ultimately be used to directly measure the substellar mass function and formation history in the Galaxy.
Subject headings:
stars: low mass, brown dwarfs — stars: fundamental parameters — stars: individual (2MASS J09373487+2931409, 2MASS J093935482448279, 2MASS J111451332618235, Gliese 570D)1. Introduction
The spectral energy distributions of the coldest known stars and brown dwarfs, L dwarfs and T dwarfs (Kirkpatrick et al., 1999; Burgasser et al., 2002b; Geballe et al., 2002), are complex, dominated by broad, overlapping gaseous and condensate molecular absorption features. The strengths of these features depend on a combination of photospheric temperature, gas pressure and composition (e.g., Burrows & Sharp 1999; Lodders & Fegley 2002), which in turn are related to the effective temperature (Teff), surface gravity () and metallicity ([M/H]) of a brown dwarf. Nonequilibrium effects (e.g., vertical mixing, cloud coverage) may also play an important role in molecular (Fegley & Lodders, 1996; Saumon et al., 2003) and condensate (Ackerman & Marley, 2001; Burgasser et al., 2002a) abundances. The combined influence of these parameters on the spectra of L and T dwarfs is only beginning to be explored through the study of low mass, substellar objects in young clusters and stellar associations (Lucas et al., 2001; Gorlova et al., 2003; McGovern et al., 2004) and ultracool subdwarfs (Burgasser et al., 2003a; Scholz, Lodieu & McCaughrean, 2004), although systematic studies have yet to be achieved.
Disentangling the properties of Teff, surface gravity and metallicity is a principal goal of substellar astrophysics. These parameters can be used to infer masses, radii and ages for individual sources (e.g., Mohanty, Jaywardhana & Basri 2004), allowing, in the long term, direct measurement of the substellar mass function (MF) and star formation history for field objects in the Solar Neighborhood (Chabrier, 2003; Burgasser, 2004; Allen et al., 2005). In the short term, Teff, and [M/H] measurements for young cluster or companion brown dwarfs enable tests of evolutionary models (Mohanty et al., 2004a).
Gravity and metallicity effects are particularly relevant for interpreting the spectral energy distributions of the coldest T dwarfs, spectral types T6 and later. These objects, with Teff 1000 K (Golimowski et al., 2004), lack the complicating influence of photospheric condensates common in late-type M dwarfs, L dwarfs and the earliest-type T dwarfs (Tsuji, Ohnaka, & Aoki, 1996; Ackerman & Marley, 2001; Allard et al., 2001). They exhibit good correlation between spectral type and Teff (Dahn et al., 2002; Tinney, Burgasser, & Kirkpatrick, 2003; Golimowski et al., 2004; Nakajima et al., 2004; Vrba et al., 2004). Surface gravity and metallicity effects are therefore readily distinguished by the presence of spectral or photometric anomalies. One case in point is the peculiar T6 dwarf 2MASS 0937+2931111Source designations in this article are abbreviated in the manner 2MASS hhmmddmm; the suffix is the sexagesimal Right Ascension (hours and minutes) and declination (degrees and arcminutes) at J2000 equinox. Full designations are provided in Table A Method for Determining the Physical Properties of the Coldest Known Brown Dwarfs. (Burgasser et al., 2002b), a brown dwarf believed to have a high surface gravity and/or subsolar metallicity (Burgasser et al., 2002b, 2003b; Burrows et al., 2002; Knapp et al., 2004). 2MASS 0937+2931 is 0.5–1.0 mag bluer than similarly-classified T dwarfs; and its spectrum exhibits a suppressed -band peak, an extremely red 0.8–1.0 spectral slope, enhanced FeH absorption at 0.99 , and an absence of K I doublet lines at 1.17 and 1.25 , all unusual for a mid-type T dwarf. Several other late-type T dwarfs exhibit similar color and spectral peculiarities (Burgasser, McElwain, & Kirkpatrick, 2003; Burgasser et al., 2004b; Knapp et al., 2004). However, quantitative analysis of these effects, in the form of specific surface gravity and metallicity measurements, has been limited (Burrows et al., 2002; Knapp et al., 2004).
In this article, we present a method for disentangling Teff, and [M/H] effects in the near infrared spectra of the latest-type T dwarfs. Our method, based on the comparison of calibrated near infrared flux ratios measured on low resolution spectral data and theoretical models, yields strong constraints on these physical parameters and a means of estimating masses, radii and ages for individual field brown dwarfs. In 2 we describe the sample and spectroscopic observations obtained with the SpeX spectrograph (Rayner et al., 2003) mounted on the 3m NASA Infrared Telescope Facility (IRTF). We identify and compare spectral variations observed in these low resolution near infrared spectra, and discuss qualitatively how these features are associated with differences in Teff, and [M/H]. In 3, we examine these same effects with theoretical models, and characterize spectral trends. In 4, we describe our method, and present Teff and estimates for 13 field brown dwarfs and constraints for two others; we also deduce subsolar metallicity estimates for two sources including 2MASS 0937+2931. We demonstrate the consistency of our Teff values with previous determinations based on parallax and luminosity measurements, and examine potential systematic effects. In 5, we derive mass, radius and age estimates for our T dwarfs using the evolutionary models of Burrows et al. (1997); and independently determine masses and radii for eight sources with published luminosity measurements. We discuss the results in 6, focusing on new insights on the Teff/spectral type relation for T dwarfs and potential applications of our method for various brown dwarf studies. Results are summarized in 7.
2. Observations
2.1. The Sample
Our primary spectral sample was composed of 16 T dwarfs identified by Strauss et al. (1999); Burgasser et al. (1999, 2002b, 2004b); Tsvetanov et al. (2000); Geballe et al. (2002); Burgasser, McElwain, & Kirkpatrick (2003); Knapp et al. (2004); and Tinney et al. (2005) in the Two Micron All Sky Survey (Cutri et al., 2003, hereafter 2MASS) and the Sloan Digital Sky Survey (York et al., 2000, hereafter SDSS). The empirical properties of these sources are listed in Table A Method for Determining the Physical Properties of the Coldest Known Brown Dwarfs. The sample was selected to span types T5.5 to T8, based on the unified classification scheme of Burgasser et al. (2005), and excludes known binaries (Burgasser et al., 2003c, Burgasser et al. in prep.). Eight of these objects have parallax measurements from Dahn et al. (2002); Tinney, Burgasser, & Kirkpatrick (2003); and Vrba et al. (2004); all but one has a reported proper motion. Apparent 2MASS -band magnitudes for these sources range from 14.7 to 16.3 mag.
2.2. Near Infrared Spectroscopy
Six of the T dwarfs in our sample – 2MASS 0034+0523, 2MASS 0243-2453, 2MASS 0415-0935, 2MASS 1231+0847, Gliese 570D and 2MASS 2228-4310 – have been previously observed with SpeX (Burgasser et al., 2004b). The remaining sources were observed during three runs on 2004 March 11–12, 2004 July 23 and 2004 September 7 (UT). A log of observations is provided in Table 2. Conditions during the March run were clear and dry with typical seeing of 07. Conditions during July were also clear with excellent seeing (04–07). Light cirrus was present during the September observations, but seeing was again excellent (05–07).
Spectral data for all of the sources in our sample (including those previously observed) were obtained using the SpeX prism dispersed mode, which provides low resolution 0.7–2.5 spectra in a single order. This setting minimizes spectral color errors commonly incurred through order stitching (e.g., McLean et al. 2003), yielding an accurate measure of the broad band spectral energy distribution. For all observations, the 05 slit was employed and rotated to the parallactic angle, resulting in a spectral resolution and dispersion across the chip of 20–30 Å pixel-1. Multiple exposures of 180 s were obtained in an ABBA dither pattern along the slit. Flux calibration was made through observations of nearby A0 V stars obtained immediately before or after the target observation and at similar airmasses (). Internal flat field and Ar arc lamps were observed after each flux calibrator star for pixel response and wavelength calibration. All spectral data were reduced using the SpeXtool package version 3.2 (Vacca et al., 2003; Cushing, Vacca, & Rayner, 2004) using standard settings. Further details on the experimental design and data reduction are given in Burgasser et al. (2004b).
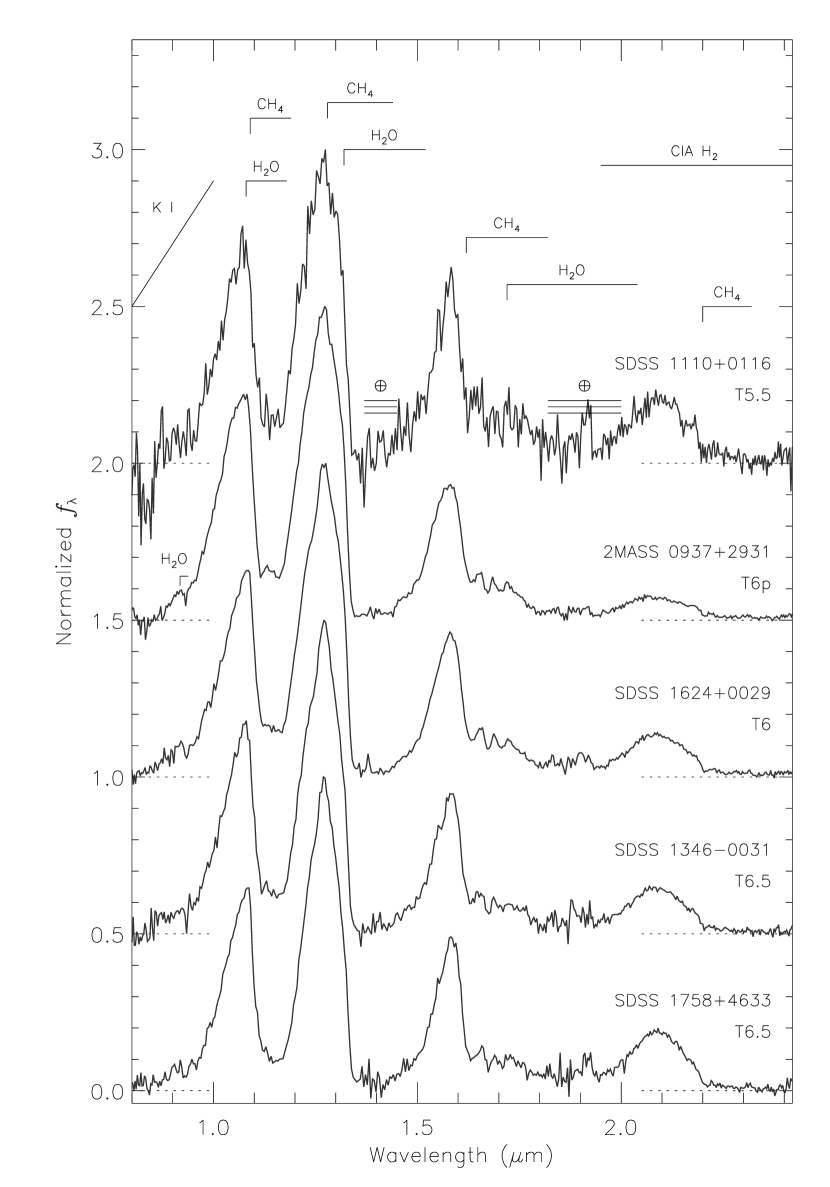
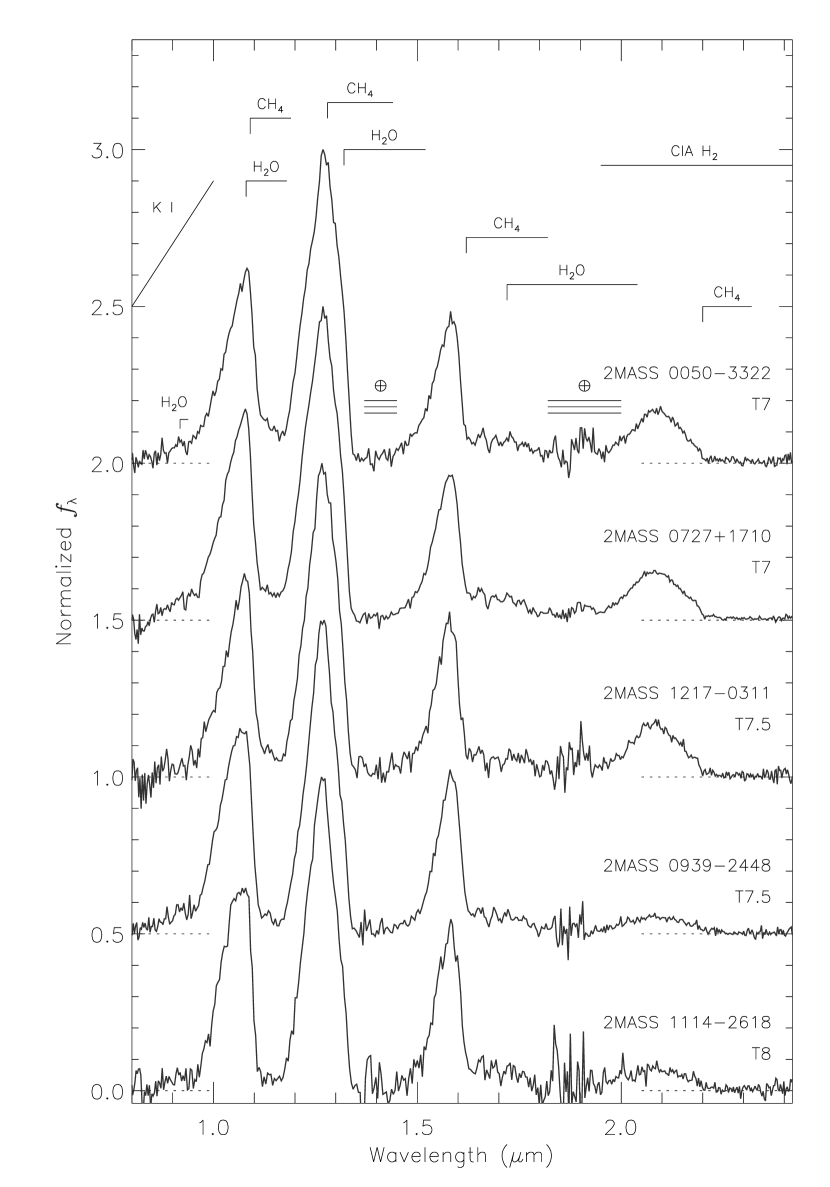
The reduced spectra of the newly observed T dwarfs are shown in Figure 1. Readily apparent are the deep molecular bands of H2O and CH4 that shape the 1.05 (-band), 1.27 (-band), 1.6 (-band) and 2.1 (-band) flux peaks, the defining features of T dwarf near infrared spectra. The spectra are also shaped by the pressure-broadened red wings of the 0.77 K I doublet shortward of 1 and collision-induced H2 absorption at -band, both of which are discussed in detail below. Finer atomic line features, including the 1.17 and 1.25 K I doublets, are unresolved in these data. Further discussion on the spectral characteristics of T dwarfs can be found in Burgasser et al. (2002b, 2003b); Geballe et al. (2002); McLean et al. (2003); Knapp et al. (2004); Nakajima et al. (2004); Cushing, Rayner, & Vacca (2005); and Kirkpatrick (2005).
2.3. Spectral Signatures of Surface Gravity and Metallicity
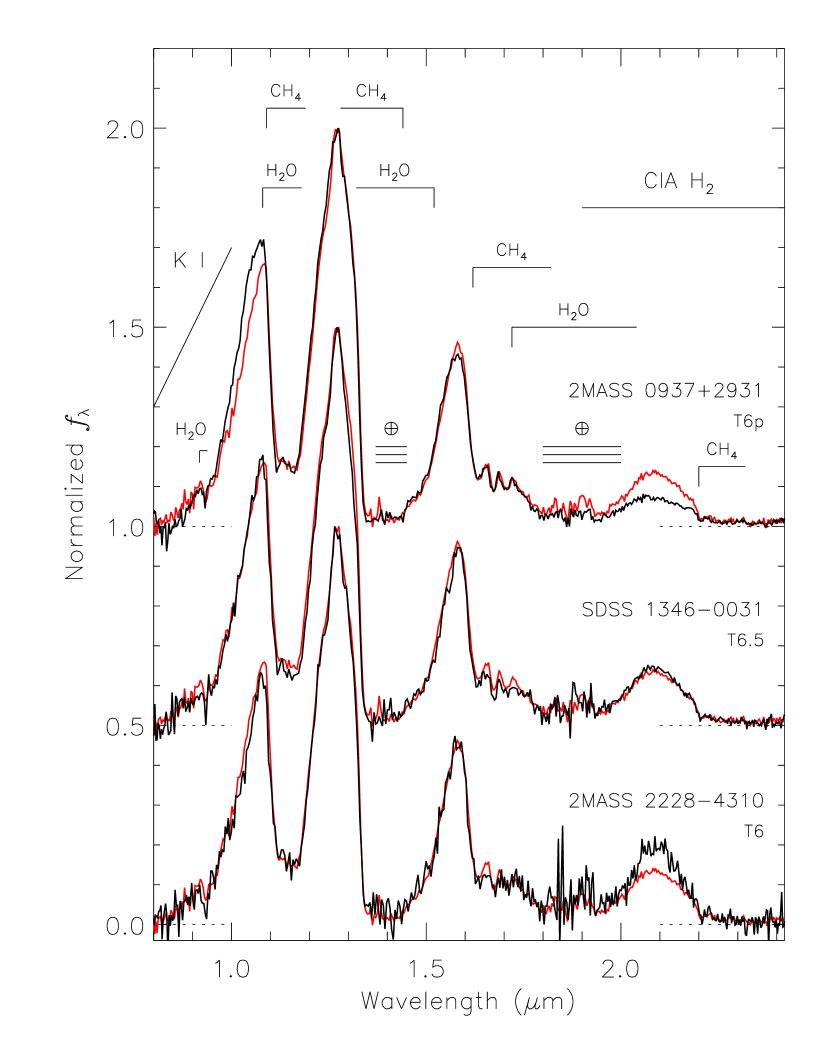
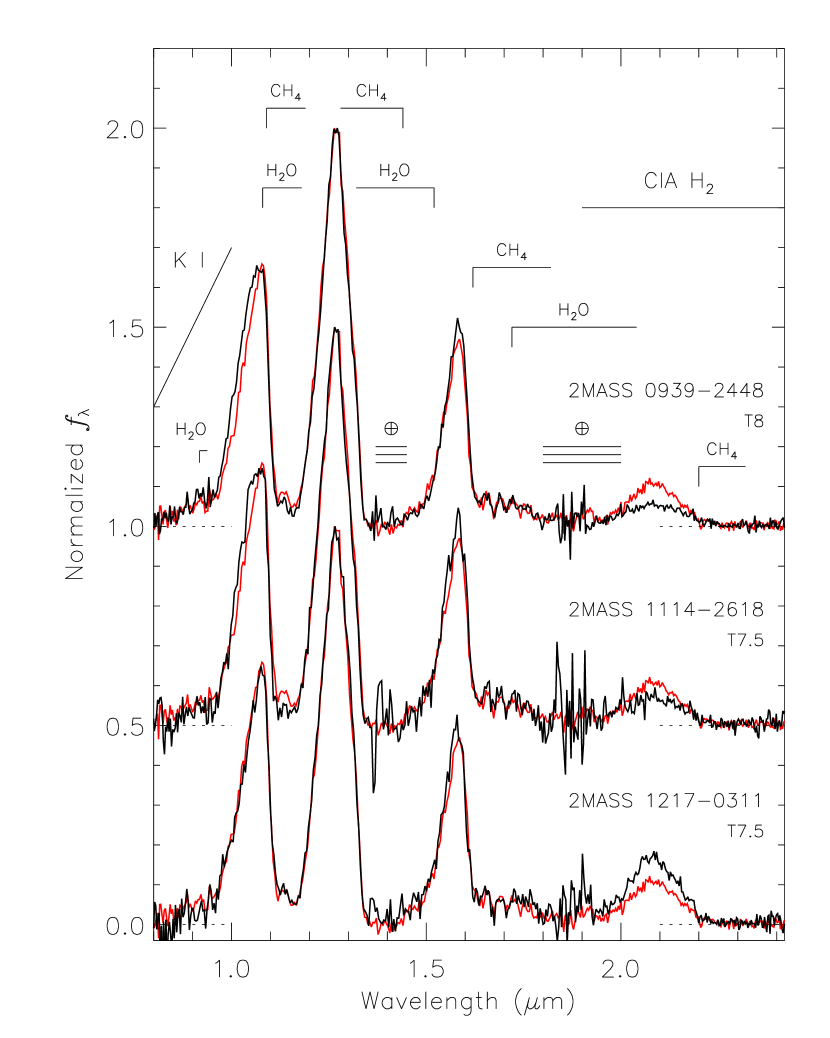
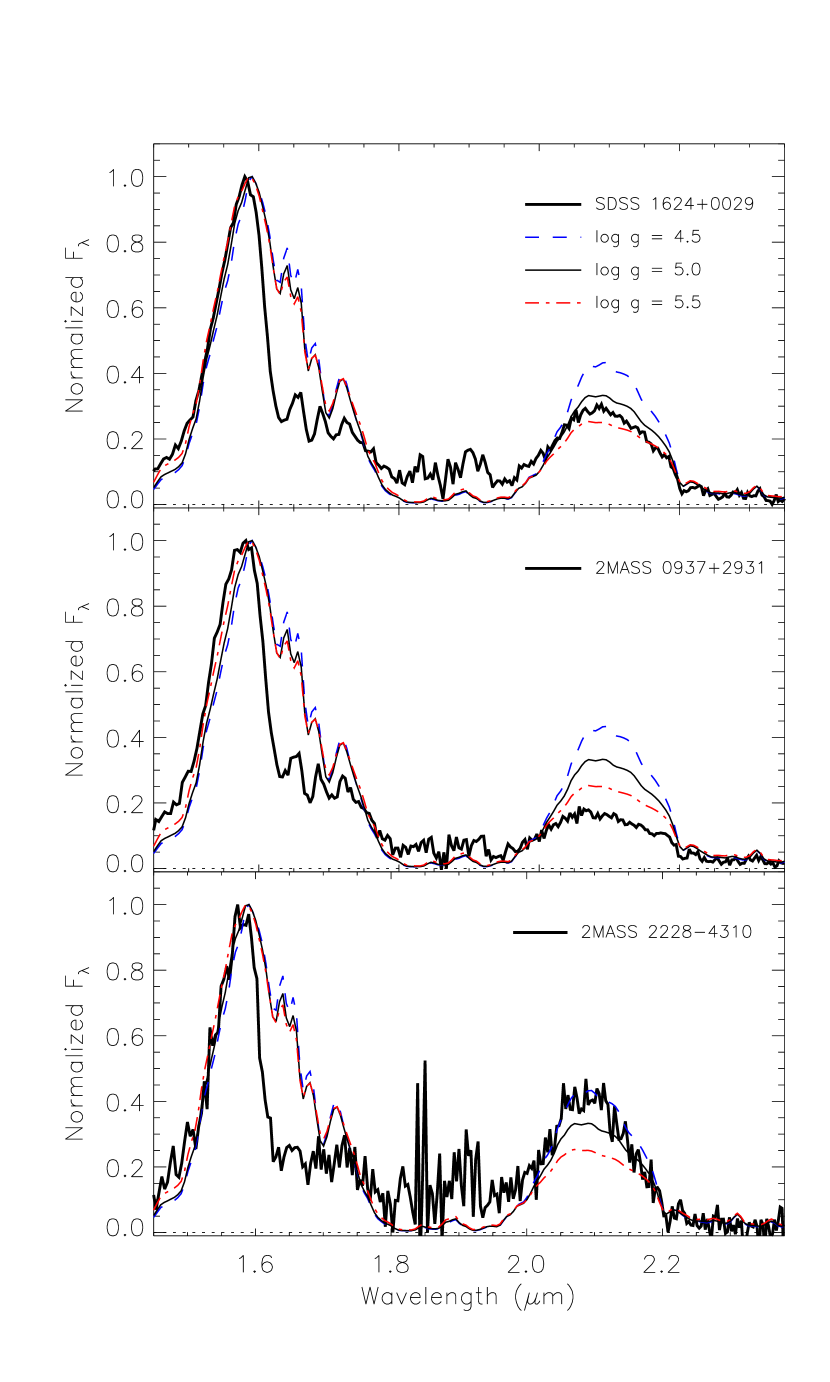
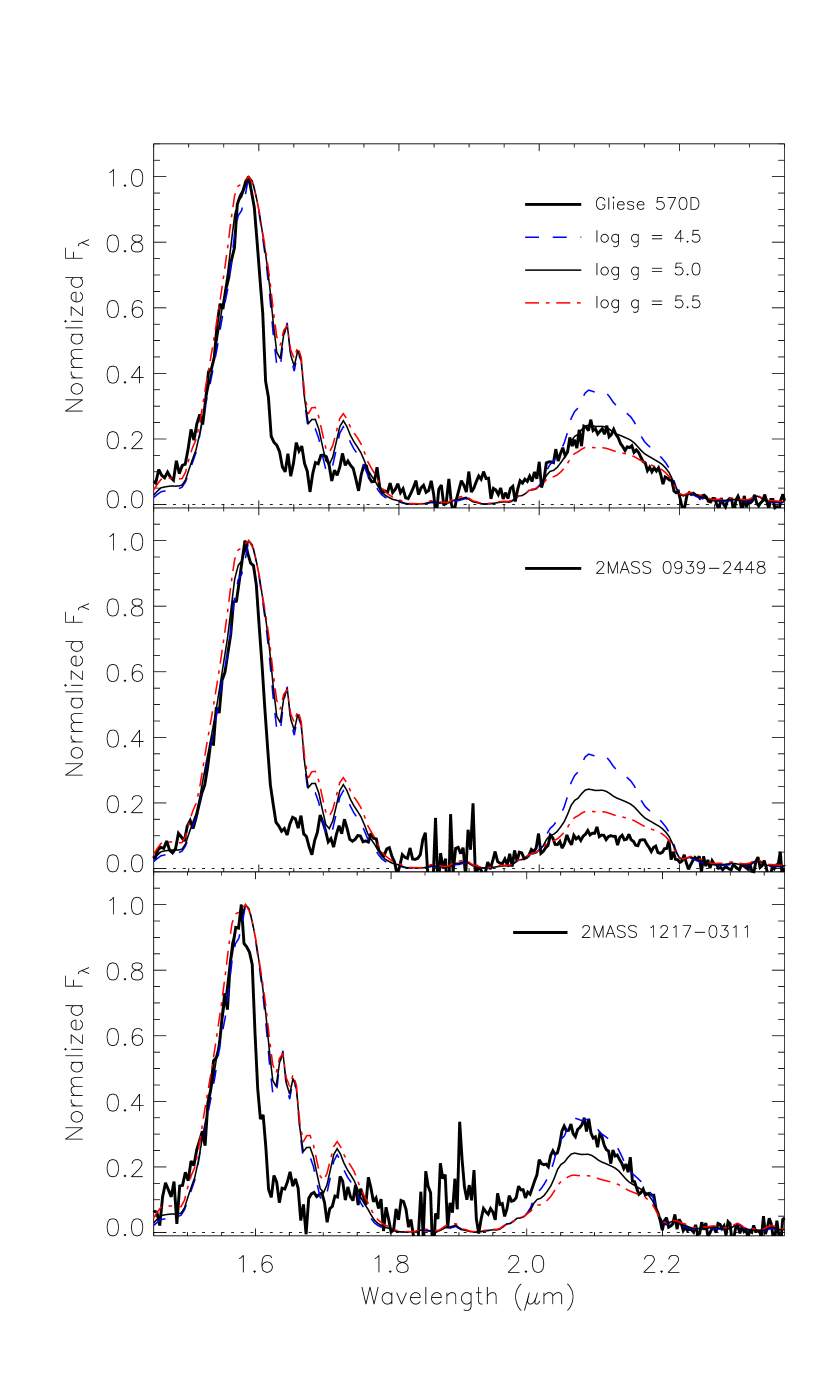
Variations in the near infrared spectral features of T dwarfs are generally synchronized with spectral type – later subtypes exhibit both stronger H2O and CH4 bands and bluer near infrared colors. However, slight deviations to these trends exist, and are apparent when one compares sources with similar spectral types, as in Figure 2. Displayed in the left panel of this figure are the normalized spectra of three T6/T6.5 dwarfs, 2MASS 0937+2931, SDSS 13460031 and 2MASS 22284310, overlain on that of the T6 spectral standard SDSS 1624+0029 (Burgasser et al., 2005). While H2O and CH4 bands are similar among these spectra, clear differences are seen in the relative brightness of the -band flux peak and the shape of the -band peak. In particular, 2MASS 0937+2931 exhibits weaker -band emission and a broader -band flux peak as compared to SDSS 1624+0029, while 2MASS 22284310 has stronger -band emission. Similar deviations are also seen among the three T7.5/T8 dwarfs 2MASS 09392448, 2MASS 11142618 and 2MASS 12170311 when compared to the similarly classified Gliese 570D.
What gives rise to these deviations? Shortward of the -band spectral peak, the dominant absorbers in T dwarf spectra are the pressure-broadened wings of the K I and Na I fundamental doublet lines centered at 0.77 and 0.59 , respectively (Tsuji, Ohnaka, & Aoki, 1999; Burrows, Marley, & Sharp, 2000; Allard et al., 2003; Burrows & Volobuyev, 2003). These features strengthen with later spectral type throughout the L and T dwarf sequences (Kirkpatrick et al., 1999; Reid et al., 2000; Burgasser et al., 2003b). The broad wings of the alkali lines, induced by kinematic perturbations by other chemical species (most importantly H2 and He), are enhanced in higher pressure () and higher density atmospheres. As atmospheric pressure scales as (where is the optical depth and the Rosseland mean opacity), higher pressure photospheres () are achieved in brown dwarfs with higher surface gravities and/or metal-deficient atmospheres (reduced ). For these sources, line broadening theory (Allard et al., 2003; Burrows & Volobuyev, 2003) predicts the strongest absorption close to the line centers, resulting in steep 0.8–1.0 spectral slopes due to red wing of the K I doublet.
The -band peak, while molded by H2O and CH4 bands at 1.8 and 2.2 , is dominated by another pressure-sensitive feature, collision-induced H2 absorption (Linsky, 1969; Saumon et al., 1994; Borysow, Jørgensen, & Zheng, 1997). The induced 1-0 quadrupolar moment of this molecule produces a broad, featureless absorption centered near 2.1 . Like the K I wings, H2 absorption arises from kinematic perturbations and is therefore enhanced in the higher pressure and higher density atmospheres present on high surface gravity and/or low metallicity brown dwarfs.
While deviations in the strengths of the K I and H2 features have previously been linked to gravity and metallicity variations in T dwarfs (Burgasser et al., 2002b, 2003b; Burrows et al., 2002; Leggett et al., 2003; Knapp et al., 2004), Figure 2 demonstrates that these features are correlated. The steeper K I wings and enhanced H2 absorption exhibited in the spectra of 2MASS 0937+2931, 2MASS 09392448 and 2MASS 11142618 are both indicative of higher pressure photospheres; while the weaker H2 absorption in the spectra of 2MASS 22284310 and 2MASS 12170311 indicate low pressure photospheres.
In contrast, the congruence of the CH4 and H2O bands for similarly classified T dwarfs suggests that gravity and metallicity effects for these features are minimal. The observed correlation between Teff and spectral type, the latter based on the strengths of the molecular bands, links H2O and CH4 to temperature. However, gas pressure does regulate the atmospheric abundance of CH4 and H2O in the principle reaction CO + 3H2 CH4 + H2O (Fegley & Lodders, 1996; Burrows & Sharp, 1999), while metallicity modulates both CH4 and H2O abundances (Lodders & Fegley, 2002). Hence, nearly all of the major absorption features in T dwarf spectra are affected in some manner by Teff, and [M/H].
3. Spectral Models
To further investigate the physical origins of the spectral peculiarities described above, we have examined a new suite of brown dwarf spectral models that incorporate differences in Teff, surface gravity and metallicity. The models, developed by the Tucson group (Burrows, Marley, & Sharp, 2000; Burrows et al., 2002; Burrows, Sudarsky & Lunine, 2003; Burrows, Sudarsky & Hubeny, 2005), are self-consistent, non-gray atmospheres incorporating up-to-date molecular opacities as described in Burrows et al. (2001). The atmospheres are assumed to be free of condensate dust species, consistent with prior modelling results (Tsuji, Ohnaka, & Aoki, 1999; Allard et al., 2001), following the prescription of condensate rainout as described in Burrows & Sharp (1999, see also Lodders 1999). Modified Lorentzian profiles with an ad-hoc, smooth cutoff are used to model the line broadening of the Na I and K I doublets (Burrows, Marley, & Sharp, 2000). Nonequilibrium mixing effects (Saumon et al., 2003) are not considered. A full description of these models is given in Burrows et al. (2002).
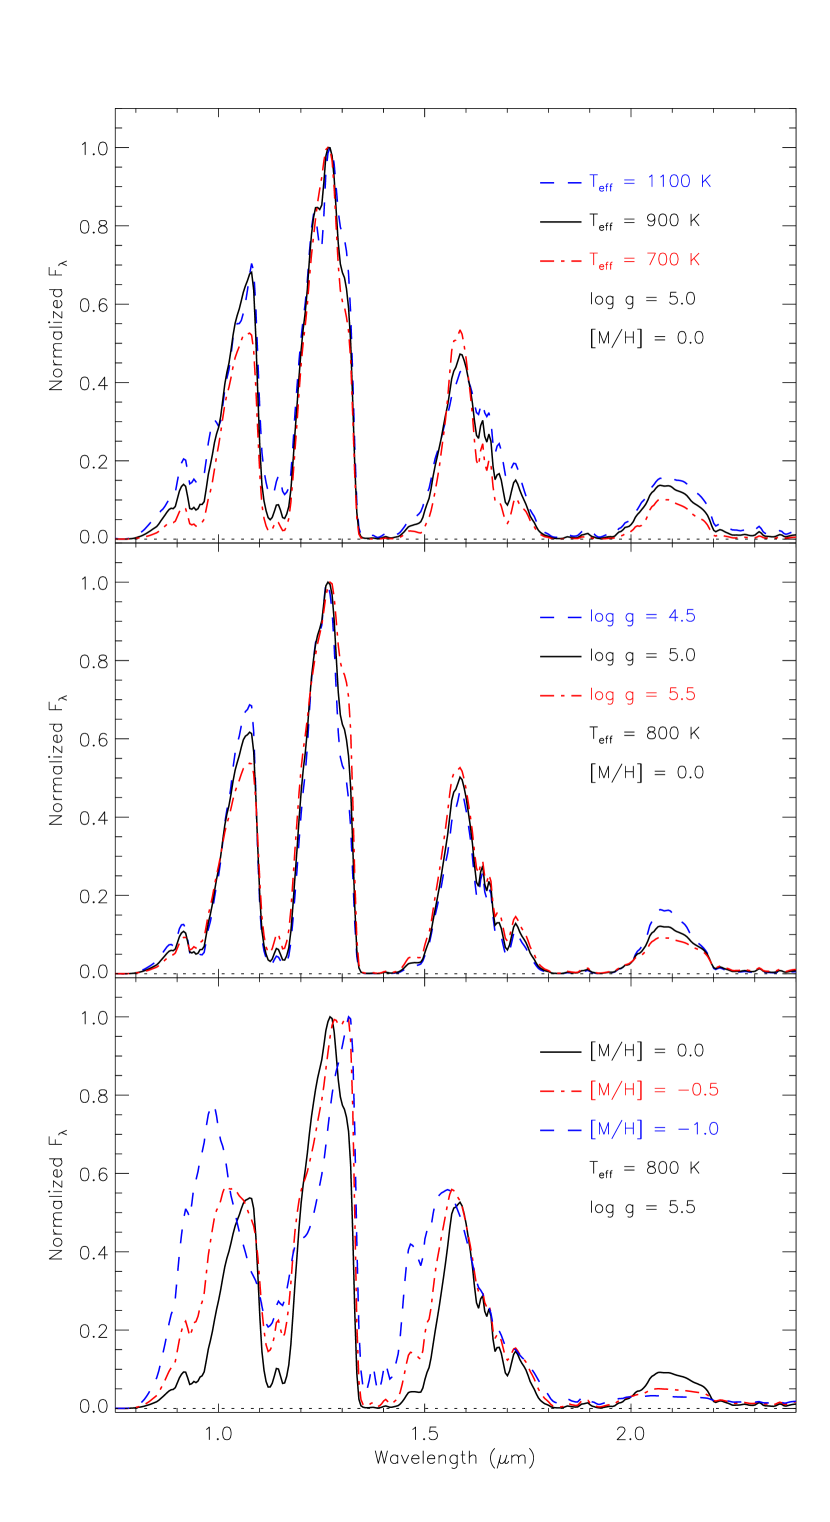
Figure 3 compares three sequences of these spectral models varying Teff, and [M/H], respectively. The spectral resolution of the models has been degraded using a Gaussian kernel to match the resolution of the SpeX prism data. There is general agreement in the overall spectral morphologies of the models and observed data; however, important discrepancies are present. Most prominent of these is the shape of the 1.6 CH4 band, reflecting continued deficiencies in the near infrared opacities of this molecule for which only low temperature (300 K) laboratory measurements have been obtained (Saumon et al. 2000; however, see Homeier et al. 2003). These opacities also detrimentally affect absorption features at 1.1 and 1.3 , although bands at 2.2 and 3.3 have been found to be adequately reproduced (M. Cushing, 2005, priv. comm.). In addition, the line-broadening theory employed by these models predates more recent calculations by Burrows & Volobuyev (2003), which predict a sharper cutoff for the red K I wing at 1.0 , in contrast to the modified Lorentzian profile used here which is relatively flat over the 0.9–1.0 waveband. As a result, alkali opacity at shorter wavelengths in the models is reduced (note the stronger 0.92 H2O as compared to the data) while the 1.05 -band peak is more suppressed in the models than observed.
The top panel of Figure 3 shows temperature variations for solar metallicity and cm s-2 models. The trends in this sequence reflect those observed in T dwarf spectra as a function of spectral type; i.e., strengthening H2O and CH4 bands producing more acute triangular flux peaks, and stronger absorption shortward of 1 and at -band. The increasing depths of the molecular bands with cooler effective temperatures is largely a consequence of the increased column depth, and therefore total opacity, of the associated gas species.
The middle panel compares surface gravity variations in the Teff = 800 K, solar metallicity models. Here, spectral variations are strongest at the - and -band flux peaks, although H2O and CH4 absorptions at 1.1 and 1.3 , and the -band peak, are also affected. The -band peak is suppressed in higher surface gravity models, consistent with the enhanced H2 absorption expected in higher pressure photospheres. On the other hand, surface gravity variations at the -band peak do not match the observed trends. The highest surface gravity model exhibits reduced 1.05 flux relative to 1.27 , contrary to the brighter and broadened -band peaks seen in the empirical data. We attribute this discrepancy to the outdated alkali line broadening profile employed in these models, and leave analysis of this feature to a future study.
The similarity of surface gravity modulations of the -band flux peak in the theoretical models to variations in the spectral data shown in Figure 2 is highlighted in Figure 4, which shows a similar sequence of T6/T6.5 and T7.5/T8 dwarfs but overlain on the Teff = 1000 and 800 K solar metallicity models, respectively. Inequities in the 1.6 CH4 band notwithstanding, the spectral models reproduce reasonably well the relative variations observed in the -band flux peaks, although both 2MASS 0937+2931 and 2MASS 0939-2448 exhibit stronger -band suppression than the highest surface gravities permitted by the models.
The bottom panel of Figure 3 compares metallicity effects at fixed surface gravity () and temperature (Teff = 800 K) for [M/H] = 0, and . The higher surface gravity examined here is appropriate for old brown dwarf members of the metal-poor Galactic thick disk and halo populations. Spectral variations are far more extreme in this case. The -band peak is suppressed at lower metallicities, as expected for enhanced H2 absorption. At the same time, emergent flux appears to be relatively enhanced shortward of 1 , due to reduced Na and K abundances and their corresponding opacities. The specific shape of the spectrum at these wavelengths should be treated with caution, however, given the older line broadening theory used in the models. Shifts in the - and -band peak wavelengths are due to reduced H2O abundances and increased collision-induced H2 absorption extending into the -band. Overall, these spectral variations are more substantial than those seen in the empirical data, a sign that significant subsolar metallicities ([M/H] ) are not present among the T dwarfs examined here. However, the broadened -band peaks and strong -band suppression in the spectra of 2MASS 0937+2931, 2MASS 09392448 and 2MASS 11142618 do hint at slightly subsolar metallicities for these sources.
4. Measuring Physical Properties from T Dwarf Spectra
4.1. The Method
The spectral models confirm that the pressure-sensitive H2 and K I absorptions are more strongly influenced by surface gravity effects than the absorption bands of H2O and CH4, while the latter vary more strongly with Teff, at least for the temperature regime considered here. By contrasting the strengths of these features, it should be possible in principle to extract the effective temperatures and surface gravities of these objects. In practice, this pursuit has proven problematic due to persistent inadequacies in molecular opacities and corresponding systematic errors in the models (e.g., Burgasser et al. 2004a). What is required is a means of calibrating the spectral models using one or more empirical fiducials.
Fortunately, such a fiducial exists in the T dwarf Gliese 570D (Burgasser et al., 2000). This widely-separated ( = 258 = 1530 AU), common proper motion brown dwarf companion to the nearby (5.910.06 pc; ESA 1997) Gliese 570ABC system has both distance and luminosity measurements that are empirically well constrained. The age of this system is estimated to be 2–5 Gyr based on a comparison of age, activity and kinematic relations for the K and M stellar components (Burgasser et al., 2000; Geballe et al., 2001). The K4 V primary has a near-solar metallicity ([Fe/H] = 0.00–0.16; Feltzing & Gustafsson 1998; Thoren & Feltzing 2000; Allende Prieto & Lambert 2000). Assuming coevality, Gliese 570D is one of the few T dwarfs with both age and metallicity constraints. Geballe et al. (2001) derive fairly precise temperature (Teff = 784–824 K) and surface gravity ( (1–2) cm s-2) estimates, the former based on the measured luminosity and a model-dependent radius, the latter based on brown dwarf evolutionary models (Burrows et al., 1997).
Using Gliese 570D as our empirical fiducial, our procedure was then as follows. The strengths of the major H2O bands and relative fluxes of the spectral peaks were measured for both the empirical data sample and theoretical models using the following ratios:
| (1) |
| (2) |
| (3) |
| (4) |
and
| (5) |
where denotes the integrated flux between wavelengths and (in microns). The first two ratios are identical to those defined for the near infrared classification of T dwarfs; the spectral region sampled by these is shown in Figure 5 of Burgasser et al. (2005, note that ratios sampling the poorly modelled CH4 bands are not considered here). The ratio has also been used previously to examine variations in H2 absorption (Burgasser et al., 2004b, 2005). The and color ratios are defined here for first time. Measurements of these ratios on the empirical data are given in Table 3.
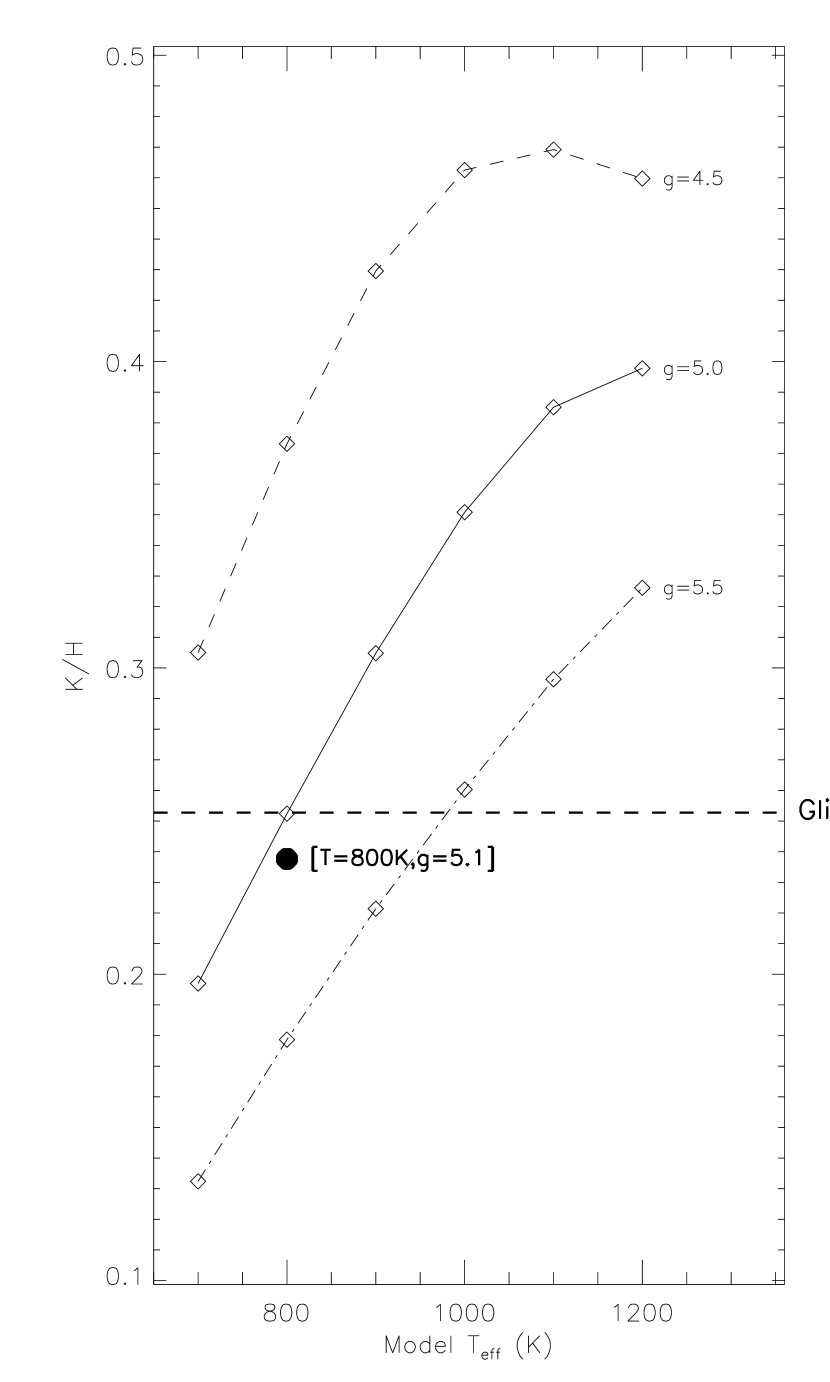
A series of H2O and ratios for the solar metallicity models are shown in Figure 5. Both ratios vary according to differences in Teff and , although gravity variations are stronger in the color ratio. Gravity variations also affect the two ratios in opposite ways; higher gravity models yield large H2O values (implying weaker absorption) and smaller values (implying weaker -band emission). Similar trends are seen with the H2O and ratios, respectively. All of these trends are consistent with the qualitative properties of the model spectra shown in Figure 3.
Calibration of the model ratios was achieved by correcting these values to those measured from the SpeX spectrum of Gliese 570D. Adopting Teff = 800 K and = 5.1 for this source, we computed the corresponding model ratios by linear interpolation. Correction factors, listed at the bottom of Table 3, were defined as the ratio of the spectral data measurement to the model value. For four of the ratios, model values differ by less than 20%; the H2O index, on the other hand, requires a 60% correction. The correction factors were applied to all of the solar metallicity model ratios, regardless of Teff or gravity, and therefore represents a first order calibration of the models.
In principle, any of the ratios defined in Eqns. 1–5 could be used for comparison to the spectral data. We restrict our primary analysis to the H2O index, which requires a smaller correction factor than H2O; and the index, which gives a quantitative measure of the behavior demonstrated in Figure 4. The corrected model ratios were resampled in steps of 20 K in Teff and 0.1 dex in by linear interpolation. Then, for each spectrum, we identified the region in Teff and phase space for which the corrected model ratios agreed with the empirical ratios, assuming a 10% uncertainty (see 4.3).
Figures 6 and 7 illustrate these matches. The H2O and ratios each constrain a set of Teff and values that span the model parameter space diagonally; e.g., agreement in the H2O ratios span low temperatures and high surface gravities to high temperatures and low surface gravities. The ratios match an orthogonal phase space. The intersection of these phase spaces provides an unambiguous constraint on both Teff and .
4.2. Results
4.2.1 Teff and Estimates
Table 4 lists the ranges of Teff and constrained by the two ratios for each source in our sample. For 13 of the 16 sources (including Gliese 570D), these values are well defined, with typical uncertainties of 40–60 K in Teff and 0.1–0.3 dex in . For three of the T dwarfs, 2MASS 0937+2931, 2MASS 09392448 and 2MASS 11142618, no phase space intersection was found. The case of 2MASS 0937+2931 is discussed in further detail below. For 2MASS 09392448 and 2MASS 11142618, close examination of Figures 6 and 7 suggests that phase space intersections are possible at lower Teffs than those spanned by our model set; i.e., for Teff 700 K. This is intriguing, since we derive Teff = 740–760 K for the T8 2MASS 04150935, currently the coldest and lowest luminosity brown dwarf known (Burgasser et al., 2002b; Golimowski et al., 2004; Vrba et al., 2004). Parallax measurements can determine whether 2MASS 09392448 and 2MASS 11142618 are in fact colder and fainter brown dwarfs.
Are these temperatures and surface gravities reasonable? Eight of the T dwarfs in our sample have prior Teff determinations from Golimowski et al. (2004) and Vrba et al. (2004) based on parallax and bolometric luminosity () measurements; these values are listed in Table 4. In all eight cases, our derived Teffs are consistent. This agreement may have much to do with the large Teff estimate ranges from Golimowski et al. (2004) and Vrba et al. (2004), as high as 300 K, due to uncertainties in the radii adopted to compute Teff from . Our Teff estimates are typically in the middle or high end of the ranges from these studies. The only surface gravity estimates for field T dwarfs reported to date are those of Knapp et al. (2004), based on a comparison of near infrared colors to atmosphere models by Marley et al. (2002). In this case, we find that our estimates are systematically 0.3–0.5 dex higher than the Knapp et al. values. As the latter are stated without uncertainties, we simply point out this discrepancy for further study.
4.2.2 A Subsolar Metallicity for 2MASS 0937+2931
The parameter spaces for 2MASS 0937+2931 do not intersect in Figure 6, but it appears that they would if higher surface gravities were modelled. However, surface gravities larger than are restricted by the interior physics (Burrows et al., 1997). An alternate hypothesis is that the spectrum is influenced by a third parameter, namely metallicity.
We can quantitatively test this case by introducing metallicity variations into the model set. Applying the same corrections to the model ratios as above (i.e., assuming Gliese 570D has [M/H] = 0), linearly interpolating between the [M/H] = 0 and [M/H] = models in 0.1 dex steps for 700 Teff 1200 K and 5.0 5.5, and performing the same comparative analysis, we derive the series of parameter phase spaces (effectively slices of a three dimensional parameter phase volume) shown in Figure 8. We find that, for the case of 2MASS 0937+2931, the phase spaces intersect for metallicities [M/H] , 780 Teff 860 and 5.0 5.5. Lower metallicities may also be feasible at lower surface gravities. One other source in our sample, 2MASS 0034+0523, also exhibits intersecting parameter spaces for slightly subsolar metallicities, [M/H] . This object has also been noted for its strong -band suppression (Burgasser et al., 2004b).
Our analysis represents the first quantitative constraints of metallicity for a brown dwarf, and are consistent with prior qualitative conclusions. However, the derived values should be treated with caution for reasons other than the fidelity of the theoretical models. Constraining the three parameters Teff, and [M/H] cannot be done unambiguously using only two spectral ratios; at least one additional constraint is required. A promising candidate is the ratio, as the metal-poor models shown in Figure 5 exhibit significant variations at these short wavelengths. We defer more thorough examination of this third index until such time as the current generation of spectral models incorporate a more rigorous line broadening theory.
4.3. Assessing Systematic Effects
While the Teff and estimates made here are reasonable and generally consistent with prior work, it is important to identify and characterize any source of systematic error that may skew the results. Such systematic effects can arise from the calibration or quality of the spectral data, the choice and calibration of the spectral ratios used and limitations of the spectral models themselves. We examine these effects here in detail.
4.3.1 Flux Calibration of the Spectral Data
Accurate measurement of color ratios such as assumes that the spectral data portrays the true color of the source, which brings into question possible reddening of the observed spectrum and the accuracy of the overall flux calibration. Interstellar reddening can generally be ruled out for our sample as all of the sources lie at distances of 20 pc or less. A more local source of reddening, differential color refraction through our atmosphere, has been mitigated by observing the sources with the slit aligned at the parallactic angle. We therefore assume that both of these effects are negligible.
Systematic errors incurred in the flux calibration can be quantified by comparing spectrophotometric colors for the data to published photometry. We examined , and colors on the Mauna Kea Observatory system (MKO; Simons & Tokunaga 2002; Tokunaga, Simons & Vacca 2002) using photometry from Geballe et al. (2001); Leggett et al. (2002); and Knapp et al. (2004); and , and colors from 2MASS (Table A Method for Determining the Physical Properties of the Coldest Known Brown Dwarfs). Spectrophotometric colors were determined by integrating the appropriate filter profile (combined with telescope and instrumental optical response curves for 2MASS photometry; see III.1.b.i in Cutri et al. 2003) over the near infrared spectra of each T dwarf and that of the A0 V star Vega (Bergeron, Wesemael, & Beauchamp, 1995, see also Stephens & Leggett 2003). We found no systematic differences for any of the photometric and spectrophotometric colors on both systems, and typical deviations were 5% or less for the more accurate MKO photometry. For those few sources with color offsets significantly greater than their photometric uncertainties (2MASS 02432453, 2MASS 0727+1710 and SDSS 1758+4633 have 3 deviations in MKO ), differences were at most 15%. Hence, we conclude that the 10% uncertainties adopted for the color ratios adequately compensates for uncertainties in the flux calibration.
4.3.2 Spectral Noise
Molecular band ratios are generally insensitive to color errors in the overall spectrum, but deep absorption bands can be affected by spectral noise. This is manifested by variations in the measured flux at the bottom of the bands where signal-to-noise (S/N) is minimal. To explore the impact of this effect, we performed a Monte Carlo experiment, measuring the H2O ratio on the combined spectrum of Gliese 570D plus a Gaussian noise component scaled to S/N = 10–200 at the -band peak. A total of 10 000 trials were run over a uniform range of S/N. We found no systematic deviations in the H2O ratios for S/N 10, but scatter among the values increased in the noisier spectra, approaching 10% for S/N = 40. All of our spectra have S/N 50 at the -band peak with the exception of SDSS 1110+0116, which has S/N 20. Hence, we find that our adopted 10% uncertainties for the measured H2O ratios incorporate noise effects sufficiently, although derived values for SDSS 1110+0116 may be more uncertain.
4.3.3 Choice of Spectral ratios
The use of the H2O and ratios in our analysis above was justified by the sensitivity of these ratios to Teff and variations in the models, the magnitude of the calibration correction required and the fidelity of the models in these spectral regions. However, we can also consider how the results change if a different set of ratios are employed. We repeated our analysis with four pairings among the H2O, H2O, and ratios. Again, we found no significant or systematic differences in the derived Teff and values amongst our sample, although parameters for individual sources differed by as much as 160 K and 0.6 dex, respectively. Typical deviations were of order 65 K in Teff and 0.15 dex in , which we adopt as estimates of systematic uncertainty.
4.3.4 Calibration of the Spectral ratios
The calibration of the spectral ratios hinges largely on the assumed physical properties for our calibrator source Gliese 570D. But how sensitive are the results to these adopted parameters? By varying the assumed Teff and for Gliese 570D by 25 K and 0.1 dex, respectively, consistent with the range of values found by Geballe et al. (2001), we found mean offsets of 35 K and 0.1 dex in the derived parameters for the field sources. These offsets were independent; changing the adopted Teff of Gliese 570D had no impact on the derived surface gravities, and vice versa. Hence, we estimate that additional systematic uncertainties of 35 K and 0.1 dex in Teff and , respectively, accommodate uncertainties in the physical parameters of our comparison source.
4.3.5 Choice of Spectral Models
Many of the potential systematic effects involving the choice and calibration of the spectral ratios would be eliminated if the models accurately reproduced the observed spectra. As limitations in the opacities prevent this, we must also consider how dependent our results are on the choice of spectral models used. We therefore repeated our analysis using the COND models of Allard et al. (2001). Calibration of the spectral ratios was performed in the same manner as with the Tucson models, yielding somewhat different correction values. While deviations typically of order 50 K and 0.1 dex were found when comparing derived Teff and between the model sets, these deviations were not systematic. Hence, we conclude that the choice of spectral model does not systematically change our results.
In summary, we find no systematic deviations in our method that would lead to skewed estimates of Teff and , although systematic uncertainties of order 50–100 K and 0.1–0.25 dex may be present.
5. Mass, Radius and Age Estimates
5.1. Evolutionary Models
According to brown dwarf evolutionary theory, the temperature and surface gravity of a brown dwarf at a given time is directly related to its mass and age assuming a given composition222We ignore for this discussion metallicity effects in the evolution of a brown dwarf, in addition to other variations related to rotation, magnetic activity, accretion or binary interaction that can also modulate the observed parameters and evolution of a brown dwarf.. This implies that if Teff and are known, estimates for the latter, more fundamental physical properties could be derived on an individual basis. This is demonstrated graphically in Figure 9, which compares the derived Teff and values for 14 of our sources (excluding 2MASS 09392448 and 2MASS 11142618) to solar metallicity evolutionary models from Burrows et al. (1997). Table 5 lists the range of masses and ages, and the corresponding radii, derived from this comparison. Our sample appears to span a broad range of masses (0.02–0.07 M☉) and ages (1–10 Gyr), consistent with a random sample drawn from the local Galactic environment. At late ages, brown dwarf radii are fairly constant, so mass and surface gravity are almost directly related. Hence, our lowest (highest) surface gravity objects are also the least (most) massive and youngest (oldest). Note in particular the placement of 2MASS 0937+2931, which appears to be the most massive and oldest in the sample. On the other hand, our analysis suggests that the low surface gravity T dwarfs SDSS 1758+4633 and 2MASS 22284310 may have masses less than 0.03 M☉ and ages less than 1 Gyr.
How reliable are these estimates? An independent check of the derived ages can be made by examining the kinematics of our sample. Three dimensional space velocities have not yet been measured for the T dwarfs examined here; a rough analysis can be made, however, by examining their tangential velocities, . Of the 14 sources in our sample with age estimates, 13 have proper motion measurements and eight have parallax measurements. For 2MASS 0034+0523, 2MASS 00503322, 2MASS 1231+0847 and 2MASS 22284310 we adopted spectrophotometric distance estimates from Burgasser, McElwain, & Kirkpatrick (2003) and Tinney et al. (2005); a distance for SDSS 1110+0116 was estimated using absolute MKO and magnitude/spectral type relations from Golimowski et al. (2004). Dividing the 13 T dwarfs into those with mean estimated ages less than 2 Gyr (young) and older than 2 Gyr (old), we computed the mean () and standard deviation () for each age group. For the young sources, = 38 km s-1 and = 20 km s-1, while for the old sources = 51 km s-1 and = 31 km s-1. The larger mean motion and greater scatter in velocities for the latter group is consistent with an older mean age. However, a rigorous examination of the three dimensional velocities is required before a conclusive assessment can be made.
5.2. Independent Mass and Radius Estimates
The masses and ages of the objects in our sample as derived from the evolutionary models appear to be reasonable and consistent with their overall properties. However, these values must be considered with caution as they are susceptible to systematic errors in both the atmosphere and interior models. Disagreements in mass and radius estimates between these two types of models have been suggested in a few young systems (Mohanty, Jaywardhana & Basri, 2004b; Close et al., 2005, however, see Luhman, Stauffer & Mamajek 2005), and such systematic deviations may be present at late ages as well. Fortunately, masses and radii can be determined independently of the evolutionary models for those brown dwarfs with bolometric luminosity measurements, as follows.
The surface gravity of a solid body, , is applicable for brown dwarf photospheres since the vertical scaleheight of this region (a few km; Griffith & Yelle 1999) is insignificant compared to the radius of the brown dwarf itself (0.1 R km). Combining this with the definition of Teff, , yields
and
These equations rely only on the Teff and values obtained from the spectral models and the measured luminosities, and not on any evolutionary model (c.f., Mohanty, Jayawardhana & Basri 2004)
Luminosities for field brown dwarfs have been compiled by a number of studies (Geballe et al., 2001; Dahn et al., 2002; Nakajima et al., 2004; Cushing, Rayner, & Vacca, 2005); here we focus on the results of Golimowski et al. (2004) and Vrba et al. (2004). Seven of the T dwarfs in our sample have luminosity determinations from these studies; Golimowski et al. also adopt the Teff and determinations of Gliese 570D from Geballe et al. (2001). The corresponding masses and radii derived from Eqns. 5.2 and 5.2, and listed in Table 5, generally agree with those derived from the evolutionary models. Figure 10 shows a comparison of mass and radius values derived from the Vrba et al. luminosities to the Burrows et al. (1997) theoretical isochrones. With the exception of SDSS 13460031333The large radius derived for SDSS 13460031 could arise if the source is an unresolved binary, although systematic effects cannot be ruled out., derived values lie between the 1 and 10 Gyr isochrones, as expected for a Galactic disk sample. More importantly, features in the theoretical brown dwarf mass-radius relationship are reproduced, including the radius minimum of 0.08 R☉ for larger masses and the trend toward larger radii for lower mass brown dwarfs (Burrows et al., 1997; Chabrier & Baraffe, 2000). These agreements are promising, and suggest that brown dwarf evolutionary tracks are robust at late ages.
Are these values truly independent of the evolutionary models? Not entirely, since the Teff and determinations hinge on the adopted values for Gliese 570D, which themselves are partly dependent on the evolutionary models. Teff was derived for this source by Geballe et al. (2001) using the integrated observed flux (over 0.83–2.52 ), a bolometric correction determined from spectral models (but consistent with more recent empirical determinations; Golimowski et al. 2004), the measured parallax of the Gliese 570 system, and a radius adopted from evolutionary models. In the last case, the radii of brown dwarfs at the age of Gliese 570D are predicted to be roughly constant, varying by less than 20% for masses of 0.02–0.07 M☉; are determined by well-understood interior physics; and have been empirically tested at the low-mass end with transiting extrasolar planets (e.g., Burrows et al. (2004)). Hence, Teff for Gliese 570D can be considered to be empirically robust. Its surface gravity, on the other hand, was derived solely from evolutionary theory. However, given the largely constant radii of old brown dwarfs (R 0.1 R☉), and assuming a mass in the brown dwarf range (0.02–0.07 M☉) yields cm s-2, consistent with the adopted model-dependent value. Hence, the adopted Teff and for Gliese 570D are only weakly tied to evolutionary models, so that the derived parameters for other T dwarfs can provide, at mimimum, semiempirical tests of these models.
Two of the objects in our sample, 2MASS 04150935 and 2MASS 0937+2931, are worth additional comment as their luminosities from Golimowski et al. (2004) and Vrba et al. (2004) are significantly discrepant. As a result, Eqns. 5.2 and 5.2 yield very different masses and radii for these sources. Golimowski et al. determined luminosities for individual brown dwarfs by integrating the total measured flux over 0.8–5.0 microns (for those sources with measured -band photometry), assuming a Rayleigh-Jeans tail for longer wavelengths (with corrections for molecular absorption between 4 and 15 ), and using measured parallaxes. Vrba et al. apply a bolometric correction as a function of spectral type (computed by Golimowski et al.) to absolute -band magnitudes. For 2MASS 04150935, the slight differences between these methods yields a lower luminosity from Golimowski et al. (by a factor of 3.5), resulting in a similar mass but a much smaller radius (0.0830.003 R☉) than that derived from the Vrba et al. measure (0.0920.004 R☉). The former estimate is outside of the Burrows et al. (1997) model parameter space. Similarly, Golimowski et al. deduce a higher luminosity for 2MASS 0937+2931 than Vrba et al., and the corresponding mass (0.1180.018 M☉) and radius (0.1140.008 R☉) are well outside of the parameter space encompassed by the evolutionary models. In both cases, the Vrba et al. luminosities yield values consistent with the models. This is intriguing, since both 2MASS 04150935 and 2MASS 0937+2931 have measured -band photometry, and the corresponding luminosities from Golimowski et al. are expected to be more accurate. These deviations may indicate systematic errors in the luminosity determinations of either Golimowski et al. or Vrba et al., or in our Teff and surface gravity estimates. This is not entirely unexpected for the apparently metal-poor T dwarf 2MASS 0937+2931. However, in order to assess the origin of these deviations, and whether they actually indicate problems in the evolutionary models, the number and quality of luminosity measurements for low temperature T dwarfs must clearly be improved.
6. Discussion
6.1. The Temperature Scale of Late-type T Dwarfs
Disentangling the parameters Teff and for T dwarf spectra enables a more refined examination of the Teff/spectral type relation for these objects, a useful function for constraining atmospheric properties as well as distance estimation. Typically, these relations are tied to luminosity measurements and an assumed radius, or range of radii for sources with unknown ages (Dahn et al., 2002; Tinney, Burgasser, & Kirkpatrick, 2003; Golimowski et al., 2004; Vrba et al., 2004). Studies have shown that late-type T dwarfs with identical spectral types can exhibit significant differences in their estimated Teffs. We formally recognize this as the additional influence of surface gravity.
Figure 11 compares the derived Teffs for the sources in our sample to their spectral types. Objects with low and moderate surface gravities, , exhibit a tight trend of decreasing Teff with increasing spectral type, largely consistent with the Golimowski et al. (2004) Teff/spectral type relation. Higher surface gravity objects, in particular 2MASS 0034+0523 and 2MASS 0937+2931, have Teffs that are 150–250 K cooler for their spectral types. This behavior can be understood by the interplay between Teff and on the major H2O bands, the depths of which determine in part T spectral types. T dwarfs with higher surface gravities have weaker H2O bands, and hence earlier spectral types, at a given Teff; consequently, they would appear to have lower Teffs for a given spectral type. This gravity trend is also present when comparing luminosities, as the oldest, most massive brown dwarfs (which have the highest surface gravities) can have radii that are 10-15% smaller than 1–3 Gyr brown dwarfs (Burrows et al., 1997). Coupled with 10–20% lower Teffs, old brown dwarfs can be up to three times fainter than their younger field counterparts. This is precisely the deviation Vrba et al. (2004) finds in the luminosity of 2MASS 0937+2931 as compared to other T6 dwarfs (Golimowski et al. 2004 find a somewhat smaller deviation). Hence, luminosity and/or Teff measurements for a consistently classified sample could provide a means of segregating young and old systems.
6.2. Improving Temperature and Surface Gravity Determinations
The method outlined here is in some sense a response to the current limitations of the spectral models. As the models improve in accuracy, direct spectral comparisons should eventually be sufficient to determine the physical parameters of field brown dwarfs. On the other hand, our spectral index comparison method could also be improved by using additional empirical calibrators such as Gliese 570D. Additional calibrators would enable higher order corrections to the model ratios, reducing systematic effects. Such empirical constraints can be taken one step further: a sufficiently sampled parameter space of calibrator sources could enable the determination of Teff and values independent of the spectral models. To do this, several more companion brown dwarfs with independent age and metallicity determinations, and/or binary (particularly eclipsing) systems with measured orbital parameters, are required. While Gliese 570D is currently the only such calibrator source in the late T dwarf regime, three closely-separated late-type T dwarf binaries have been identified for which mass measurements are feasible (Burgasser et al., 2003c, Burgasser et al. in prep.); and one T dwarf binary, Epsilon Indi Bab (Scholz et al., 2003; McCaughrean et al., 2004) is also a companion to a nearby 0.8–2 Gyr K5 V star. There are also several ongoing searches for wide brown dwarf companions to nearby and young stars (e.g., Chauvin et al. 2004, 2005; Neuhäuser et al. 2005). Identification of several such calibration stars would provide an empirical ladder for determining the physical properties of field brown dwarfs, and a critical test for both spectral and evolutionary models.
Can we also extend this technique to earlier spectral types; e.g., L dwarfs and early-type T dwarfs? In these regimes, spectral energy distributions are strongly affected by photospheric condensates, giving rise to what many consider to be a fourth “dust” parameter (e.g., in Ackerman & Marley (2001) and Marley et al. (2002); Tcr in Tsuji (2005); in Burrows, Sudarsky & Hubeny (2005)) which may vary with the photospheric gas properties or other secondary effects, such as rotation. In principle, the method outlined here could be extended into the L and early T dwarf regime by incorporating this fourth parameter, employing suitable dust cloud models and enlarging the sample of empirical calibration stars. In practice, this approach may prove more difficult as brown dwarf cloud formation remains a poorly understood process (e.g., Helling et al. 2004). Nevertheless, Teff, and dust content determinations would be particularly useful for understanding the unusual transition where L and T dwarfs when photospheric dust is rapidly depleted (Dahn et al., 2002; Burgasser et al., 2002a; Knapp et al., 2004).
6.3. Applications of the Method
The ability to determine masses and ages for individual brown dwarfs is clearly a boon to statistical studies of these objects, particularly the Galactic substellar MF and formation history. Constraints on these fundamental relations have largely been statistical in nature because of the difficulty in determining masses and ages for field sources (Reid et al., 1999; Chabrier, 2003; Burgasser, 2004; Allen et al., 2005). Using the method described here, both distributions can be built up directly from individual sources in a sample, assuming that careful consideration is made of selection effects. While current samples of late-type T dwarfs are too small for a robust analysis of this kind (Burgasser et al., 2002b; Knapp et al., 2004), searches for cold brown dwarfs from wide and deep near infrared surveys such as the UKIRT Infrared Deep Sky Survey444See http://www.ukidss.org/index.html. (Warren, 2002) may make MF and age distribution measurements feasible in the near future.
In the more immediate term, Teff and measurements, and corresponding mass and age estimates, are useful for identifying and characterizing young, low mass objects in young star forming regions. According to current evolutionary models, T dwarfs with ages 10 Myr can have masses of only a few Jupiter masses (MJup). Several young cluster brown dwarf candidates have been identified in recent years, including the late-type T dwarf S Orionis 70 (Zapatero Osorio et al., 2002; Martín & Zapatero Osorio, 2003). Direct comparison of spectral data to theoretical models have suggested a very low surface gravity for this source, , indicative of a young, very low mass (3 MJup) brown dwarf which has not yet fully contracted. However, such direct spectral comparison has been shown to be flawed for late T spectral types in general (Burgasser et al., 2004a). A calibrated spectral ratio comparison could provide a more robust assessment of the physical properties of this and other low mass candidates, and verify their cluster membership. Furthermore, with luminosity measurements, independent determinations of mass and age would provide semiempirical constraints on the evolutionary models from which mass estimates are currently derived. Such independent assessments are necessary to validate the existence of so-called “planetary-mass” brown dwarfs in these young star forming regions.
7. Summary
We have devised a method for measuring the effective temperatures and surface gravities for the lowest luminosity T-type brown dwarfs, by the comparison of calibrated spectral ratios measured on low resolution near infrared spectral data and theoretical models. Using this method, we have derived Teff and estimates for 14 T5.5–T8 field brown dwarfs, and a subsolar metallicity estimate for the peculiar T dwarf 2MASS 0937+2931. Two other sources in our sample, 2MASS 09392448 and 2MASS 11142618, appear to have Teff 700 K, and are potentially the coldest brown dwarfs currently known. We find no evidence of systematic effects in our method, and the agreement of our Teff determinations with prior studies suggests that our results are robust. We also find that the scatter observed in Teff/spectral type relations likely arises from surface gravity effects, as higher surface gravity objects have a lower Teff at a given spectral type. Masses, radii and ages are derived for objects in our sample using the Burrows et al. (1997) evolutionary models, while independent mass and radius determinations are made for eight T dwarfs with luminosity measurements. Broad agreement between these values suggests that current brown dwarf evolutionary models are accurate at late ages, although this must be verified through improved luminosity determinations.
The comparative technique described here is a useful tool for determining the physical properties of the lowest-luminosity brown dwarfs, making efficient use of low resolution, and therefore more sensitive, spectroscopy. As such, it is a promising method for characterizing large samples arising from deep surveys, enabling a direct determination of the Galactic substellar MF and formation history. While our method remains tied to the current generation of spectral models, susceptible to persistent opacity deficiencies, the increased use of fiducial calibrators will ultimately enable a wholly empirical approach, allowing critical tests of atmospheric and evolutionary theories in addition to the characterization of individual brown dwarfs in the vicinity of the Sun.
References
- Ackerman & Marley (2001) Ackerman, A. S., & Marley, M. S. 2001, ApJ, 556, 872
- Allard et al. (2001) Allard, F., Hauschildt, P. H., Alexander, D. R., Tamanai, A., & Schweitzer, A. 2001, ApJ, 556, 357
- Allard et al. (2003) Allard, N. F., Allard, F.; Hauschildt, P. H., Kielkopf, J. F., & Machin, L. 2003, A&A, 411, L473
- Allen et al. (2005) Allen, P. R., Koerner, D. W., Reid, I. N., & Trilling, D. E. 2005, ApJ, 625, 385
- Allende Prieto & Lambert (2000) Allende Prieto, C., & Lambert, D. L. 2000, AJ, 119, 2445
- Bergeron, Wesemael, & Beauchamp (1995) Bergeron, P., Wesemael, F., & Beauchamp, A. 1995, PASP, 107, 1047
- Borysow, Jørgensen, & Zheng (1997) Borysow, A., Jørgensen, U. G., & Zheng, C. 1997, A&A, 324, 185
- Burgasser (2004) Burgasser, A. J. 2004, ApJS, 155, 191
- Burgasser et al. (2005) Burgasser, A. J., Geballe, T. R., Leggett, S. K., Kirkpatrick, J. D., Golimowski, D. A., & Fan, X. 2005, ApJ, submitted
- Burgasser et al. (2003a) Burgasser, A. J., Kirkpatrick, J. D., Burrows, A., Liebert, J., Reid, I. N., Gizis, J. E., McGovern, M. R., Prato, L., & McLean, I. S. 2003a, ApJ, 592, 1186
- Burgasser et al. (2003b) Burgasser, A. J., Kirkpatrick, J. D., Liebert, J., & Burrows, A. 2003b, ApJ, 594, 510
- Burgasser et al. (2004a) Burgasser, A. J., Kirkpatrick, McGovern, M. R., McLean, I. S., Prato, L., & Ried, I. N. 2004a, ApJ, 604, 827
- Burgasser et al. (2003c) Burgasser, A. J., Kirkpatrick, J. D., Reid, I. N., Brown, M. E., Miskey, C. L., & Gizis, J. E. 2003c, ApJ, 586, 512
- Burgasser et al. (2002a) Burgasser, A. J., Marley, M. S., Ackerman, A. S., Saumon, D., Lodders, K., Dahn, C. C., Harris, H. C., & Kirkpatrick, J. D. 2002a, ApJ, 571, L151
- Burgasser, McElwain, & Kirkpatrick (2003) Burgasser, A. J., McElwain, M. W., & Kirkpatrick, J. D. 2003, AJ, 126, 2487
- Burgasser et al. (2004b) Burgasser, A. J., McElwain, M. W., Kirkpatrick, J. D., Cruz, K. L., Tinney, C. G., & Reid, I. N. 2004b, AJ, 127, 2856
- Burgasser et al. (1999) Burgasser, A. J., et al. 1999, ApJ, 522, L65
- Burgasser et al. (2000) —. 2000, ApJ, 531, L57
- Burgasser et al. (2002b) —. 2002b, ApJ, 564, 421
- Burrows et al. (2002) Burrows, A., Burgasser, A. J., Kirkpatrick, J. D., Liebert, J., Milsom, J. A., Sudarsky, D., & Hubeny, I. 2002, ApJ, 573, 394
- Burrows et al. (2001) Burrows, A., Hubbard, W. B., Lunine, J. I., & Liebert, J. 2001, Rev. of Modern Physics, 73, 719
- Burrows et al. (2004) Burrows, A., Hubeny, I., Hubbard, W. B., Sudarsky, D., & Fortney, J. J. 2004, ApJ, 610, L53
- Burrows, Marley, & Sharp (2000) Burrows, A., Marley, M. S., & Sharp, C. M. 2000, ApJ, 531, 438
- Burrows & Sharp (1999) Burrows, A., & Sharp, C. M. 1999, ApJ, 512, 843
- Burrows, Sudarsky & Hubeny (2005) Burrows, A., Sudarsky, D., & Hubeny, I. 2005, ApJ, submitted
- Burrows, Sudarsky & Lunine (2003) Burrows, A., Sudarsky, D., & Lunine, J. I. 2003, ApJ, 596, 587
- Burrows & Volobuyev (2003) Burrows, A., & Volobuyev, M. 2003, ApJ, 583, 985
- Burrows et al. (1997) Burrows, A., et al. 1997, ApJ, 491, 856
- Chabrier (2003) Chabrier, G. 2003, PASP, 115, 763
- Chabrier & Baraffe (2000) Chabrier, G., & Baraffe, I. 2000, ARA&A, 38, 337
- Chauvin et al. (2004) Chauvin, G., Lagrange, A.-M., Dumas, C., Zuckerman, B., Mouillet, D., Song, I., Beuzit, J.-L., & Lowrance, P. 2004, A&A, 425, L29
- Chauvin et al. (2005) Chauvin, G., Lagrange, A.-M., Zuckerman, B., Dumas, C., Mouillet, D., Song, I., Beuzit, J.-L., Lowrance, P., & Bessell, M. S. 2005, A&A, 438, L29
- Close et al. (2005) Close, L. M., Lenzen, R., Guirado, J. C., Nielsen, E. L., Mamajek, E. E., Brandner, W., Hartung, M., Lidman, C., & Biller, B. 2005, Nature, 433, 286
- Cushing, Rayner, & Vacca (2005) Cushing, M. C., Rayner, J. T., & Vacca, W. D. 2005, ApJ, 623, 1115
- Cushing, Vacca, & Rayner (2004) Cushing, M. C., Vacca, W. D., & Rayner, J. T. 2004, PASP, 116, 362
- Cutri et al. (2003) Cutri, R. M., et al. 2003, Explanatory Supplement to the 2MASS All Sky Data Release
- Dahn et al. (2002) Dahn, C. C., et al. 2002, AJ, 124, 1170
- ESA (1997) ESA, 1997, The Hipparcos and Tycho Catalogues, ESA SP-1200
- Fegley & Lodders (1996) Fegley, B., & Lodders, K. 1996, ApJ, 472, L37
- Feltzing & Gustafsson (1998) Feltzing, S., & Gustafsson, B. 1998, A&AS, 129, 237
- Geballe et al. (2001) Geballe, T. R., Saumon, D., Leggett, S. K., Knapp, G. R., Marley, M. S., & Lodders, K. 2001, ApJ, 556, 373
- Geballe et al. (2002) Geballe, T. R., et al. 2002, ApJ, 564, 466
- Golimowski et al. (2004) Golimowski, D. A., et al. 2004, AJ, 127, 3516
- Gorlova et al. (2003) Gorlova, N. I., Meyer, M. R., Rieke, G. H., & Liebert, J. 2003, ApJ, 593, 1074
- Griffith & Yelle (1999) Griffith, C. A., & Yelle, R. V. 1999, ApJ, 519, L85
- Helling et al. (2004) Helling, Ch., Klein, R., Woitke, P., Nowak, U., & Sedlmayr, E. 2004, A&A, 423, 657
- Homeier, Hauschildt & Allard (2003) Homeier, D., Hauschildt, P. H., & Allard, F. 2003, in Brown Dwarfs, Proceedings of IAU Symposium #211, ed. E. Martín (San Francisco: ASP), p. 419
- Kirkpatrick (2005) Kirkpatrick, J. D. 2005, ARA&A, 43, 195
- Kirkpatrick et al. (1999) Kirkpatrick, J. D., et al. 1999, ApJ, 519, 802
- Knapp et al. (2004) Knapp, G., et al. 2004, AJ, 127, 3553
- Leggett et al. (2003) Leggett, S. K., Golimowski, D. A., Fan, X., Geballe, T. R., & Knapp, G. R. 2003, in 12th Cambridge Workshop on Cool Stars, Stellar Systems, and the Sun, eds. A. Brown, G. M. Harper, & T. R. Ayres, (Boulder: University of Colorado), p. 120
- Leggett et al. (2002) Leggett, S. K., et al. 2002, ApJ, 564, 452
- Linsky (1969) Linsky, J. L. 1969, ApJ, 156, 989
- Lodders (1999) Lodders, K. 1999, ApJ, 519, 793
- Lodders & Fegley (2002) Lodders, K., & Fegley, B. 2002, Icarus, 155, 393
- Lucas et al. (2001) Lucas, P. W., Roche, P. F., Allard, F., & Hauschildt, P. H.. 2001, MNRAS, 326, 695
- Luhman, Stauffer & Mamajek (2005) Luhman, K. L., Stauffer, J. R., & Mamajek, E. E. 2005, 628, L69
- Marley et al. (2002) Marley, M. S., Seager, S., Saumon, D., Lodders, K., Ackerman, A. S., Freedman, R., & Fan, X. 2002, ApJ, 568, 335
- Martín & Zapatero Osorio (2003) Martín, E. L., & Zapatero Osorio, M. R. 2003, ApJ, 593, L113
- McCaughrean et al. (2004) McCaughrean, M., Close, L. M., Scholz, R.-D., Lenzen, R., Biller, B., Brandner, W., Hartung, M., & Lodieu, N. 2004, A&A, 413, 1029
- McGovern et al. (2004) McGovern, M., Kirkpatrick, J. D., McLean, I. S., Burgasser, A. J., Prato, L., & Lowrance, P. J. 2004, ApJ, 600, 1020
- McLean et al. (2003) McLean, I. S., McGovern, M. R., Burgasser, A. J., Kirkpatrick, J. D., Prato, L., & Kim, S. 2003, ApJ, 596, 561
- Mohanty et al. (2004a) Mohanty, S., Basri, G., Jayawardhana, R., Allard, F., Hauschildt, P., & Ardila, D. 2004, ApJ, 609, 854
- Mohanty, Jaywardhana & Basri (2004b) Mohanty, S., Jayawardhana, R., & Basri, G. 2004, ApJ, 609, 885
- Nakajima et al. (2004) Nakajima, T., Tsuji, T., & Yanagisawa, K. 2004, ApJ, 607, 499
- Neuhäuser et al. (2005) Neuhäuser, R., Guenther, E. W., Wuchterl, G., Mugrauer, M., Bedalov, A., & Hauschildt, P. H. 2005, A&A, 435, L13
- Rayner et al. (2003) Rayner, J. T., Toomey, D. W., Onaka, P. M., Denault, A. J., Stahlberger, W. E., Vacca, W. D., Cushing, M. C., & Wang, S. 2003, PASP, 155, 362
- Reid et al. (2000) Reid, I. N., Kirkpatrick, J. D., Gizis, J. E., Dahn, C. C., Monet, D. G., Williams, R. J., Liebert, J., & Burgasser, A. J. 2000, AJ, 119, 369
- Reid et al. (1999) Reid et al. 1999, ApJ, 521, 613
- Saumon et al. (1994) Saumon, D., Bergeron, P., Lunine, J. I., Hubbard, W. B., & Burrows, A. 1994, ApJ, 424, 333
- Saumon et al. (2000) Saumon, D., Geballe, T. R., Leggett, S. K., Marley, M. S., Freedman, R. S., Lodders, K., Fegley, B., Jr., & Sengupta, S. K. 2000, ApJ, 541, 374
- Saumon et al. (2003) Saumon, D., Marley, M. S., Lodders, K., & Freedman, R. S. 2003, in Brown Dwarfs, Proceedings of IAU Symposium #211, ed. E. Martín (San Francisco: ASP), p. 345
- Scholz, Lodieu & McCaughrean (2004) Scholz, R.-D., Lodieu, N., & McCaughrean, M. J. 2004, A&A, 428, L25
- Scholz et al. (2003) Scholz, R.-D., McCaughrean, M. J., Lodieu, N., & Kuhlbrodt, B. 2003, A&A, 398, L29
- Simons & Tokunaga (2002) Simons, D. A., & Tokunaga, A. T. 2002, PASP, 114, 169
- Stephens & Leggett (2004) Stephens, D. C., & Leggett, S. K. 2004, PASP, 116, 9
- Strauss et al. (1999) Strauss, M. A., et al. 1999, ApJ, 522, L61
- Thoren & Feltzing (2000) Thoren, P., & Feltzing, S. 2000, A&A, 363, 692
- Tinney et al. (2005) Tinney, C. G., Burgasser, A. J., McElwain, M. W., & Kirkpatrick, J. D. 2005, AJ, in press
- Tinney, Burgasser, & Kirkpatrick (2003) Tinney, C. G., Burgasser, A. J., & Kirkpatrick, J. D. 2003, AJ, 126, 975
- Tokunaga, Simons & Vacca (2002) Tokunaga, A. T., Simons, D. A., & Vacca W. D. 2002, PASP, 114, 180
- Tsuji (2005) Tsuji, T. 2005, ApJ, 621, 1033
- Tsuji, Ohnaka, & Aoki (1996) Tsuji, T., Ohnaka, K., & Aoki, W. 1996, A&A, 305, L1
- Tsuji, Ohnaka, & Aoki (1999) —. 1999, ApJ, 520, L119
- Tsvetanov et al. (2000) Tsvetanov, Z. I., et al. 2000, ApJ, 531, L61
- Vacca et al. (2003) Vacca, W. D., Cushing, M. C., & Rayner, J. T. 2003, PASP, 155, 389
- Vrba et al. (2004) Vrba, F. J., et al. 2004, AJ, 127, 2948
- Warren (2002) Warren, S. 2002, SPIE, 4836, 313
- York et al. (2000) York, D. G., et al. 2000, AJ, 120, 1579
- Zapatero Osorio et al. (2002) Zapatero Osorio, M. R., Béjar, V. J. S., Martí, E. L., Rebolo, R., Barrado y Navascuès, D., Mundt, R., Eislöffel, J., & Caballero, J. A. 2002, ApJ, 578, 536


| J2000 CoordinatesaaRight Ascension () and declination () at equinox J2000 from the 2MASS All Sky Data Release Point Source Catalog (Cutri et al., 2003). | 2MASS Photometry | ||||||||
|---|---|---|---|---|---|---|---|---|---|
| Name | SpT | RefbbDiscovery, parallax and proper motion references. | |||||||
| (mas) | ( yr-1) | ||||||||
| (1) | (2) | (3) | (4) | (5) | (6) | (7) | (8) | (9) | (10) |
| 2MASS J00345157+0523050 | T6.5 | 00h34m5157 | +0523050 | 15.540.05 | 15.440.08 | 16.2 | 0.680.06 | 1 | |
| 2MASS J005019943322402 | T7 | 00h50m1994 | 3322402 | 15.930.07 | 15.840.19 | 15.240.19 | 1.50.1 | 2 | |
| 2MASS J024313712453298 | T6 | 02h43m1371 | 2453298 | 15.380.05 | 15.140.11 | 15.220.17 | 944 | 0.3550.004 | 3,4 |
| 2MASS J041519540935066 | T8 | 04h15m1954 | 0935066 | 15.700.06 | 15.540.11 | 15.430.20 | 1743 | 2.2550.003 | 3,4 |
| 2MASS J07271824+1710012 | T7 | 07h27m1824 | +1710012 | 15.600.06 | 15.760.17 | 15.560.19 | 1102 | 1.2970.005 | 3,4 |
| 2MASS J09373487+2931409 | T6p | 09h37m3487 | +2931409 | 14.650.04 | 14.700.07 | 15.270.13 | 1634 | 1.6220.007 | 3,4 |
| 2MASS J093935482448279 | T8 | 09h39m3548 | 2448279 | 15.980.11 | 15.800.15 | 16.6 | 1.150.06 | 2 | |
| SDSS J111010.01+011613.1 | T5.5 | 11h10m1001 | +0116130 | 16.340.12 | 15.920.14 | 15.1 | 0.340.10 | 2,5 | |
| 2MASS J111451332618235 | T7.5 | 11h14m5133 | 2618235 | 15.860.08 | 15.730.12 | 16.1 | 3.050.04 | 2 | |
| 2MASS J12171100311131 | T7.5 | 12h17m1110 | 0311131 | 15.860.06 | 15.750.12 | 15.9 | 912 | 1.05710.0017 | 6,7 |
| 2MASS J12314753+0847331 | T5.5 | 12h31m4753 | +0847331 | 15.570.07 | 15.310.11 | 15.220.20 | 1.610.07 | 1,2,8 | |
| SDSS J134646.45003150.4 | T6.5 | 13h46m4634 | 0031501 | 16.000.10 | 15.460.12 | 15.770.27 | 682 | 0.5160.003 | 9,7 |
| Gliese 570D | T7.5 | 14h57m1496 | 2121477 | 15.320.05 | 15.270.09 | 15.240.16 | 169.31.7 | 2.0120.004 | 10,11 |
| SDSS J162414.37+002915.6 | T6 | 16h24m1436 | +0029158 | 15.490.05 | 15.520.10 | 15.5 | 922 | 0.38320.0019 | 12,13 |
| SDSS J175805.46+463311.9 | T6.5 | 17h58m0545 | +4633099 | 16.150.09 | 16.250.22 | 15.470.19 | 8 | ||
| 2MASS J222828894310262 | T6 | 22h28m2889 | 4310262 | 15.660.07 | 15.360.12 | 15.300.21 | 0.310.03 | 14 | |
References. — (1) Burgasser et al. (2004b); (2) Tinney et al. (2005); (3) Burgasser et al. (2002b); (4) Vrba et al. (2004); (5) Geballe et al. (2002); (6) Burgasser et al. (1999); (7) Tinney, Burgasser, & Kirkpatrick (2003); (8) Knapp et al. (2004); (9) Tsvetanov et al. (2000); (10) Burgasser et al. (2000); (11) HIPPARCOS (ESA, 1997); (12) Strauss et al. (1999); (13) Dahn et al. (2002); (14) Burgasser, McElwain, & Kirkpatrick (2003).
| Source | UT Date | (s) | Calibrator Star | SpT | |
|---|---|---|---|---|---|
| (1) | (2) | (3) | (4) | (5) | (6) |
| 2MASS 00503322 | 2004 Sep 07 | 1.69 | 1440 | HD 225200 | A0 V |
| 2MASS 0727+1710 | 2004 Mar 10 | 1.00 | 1280 | HD 56386 | A0 Vn |
| 2MASS 0937+2931 | 2004 Mar 11 | 1.02 | 720 | HD 89239 | A0 V |
| 2MASS 09392448 | 2004 Mar 12 | 1.43 | 1080 | HD 81694 | A0 V |
| SDSS 1110+0116 | 2004 Mar 11 | 1.14 | 1800 | HD 97585 | A0 V |
| 2MASS 11142618 | 2004 Mar 12 | 1.75 | 1080 | HD 98949 | A0 V |
| 2MASS 12170311 | 2004 Mar 11 | 1.13 | 720 | HD 109309 | A0 V |
| SDSS 13460031 | 2004 Mar 12 | 1.09 | 720 | HD 116960 | A0 V |
| SDSS 1624+0029 | 2004 Mar 12 | 1.06 | 720 | HD 136831 | A0 V |
| SDSS 1758+4633 | 2004 Jul 23 | 1.22 | 720 | HD 158261 | A0 V |
| Source | SpT | H2O | H2O | |||
|---|---|---|---|---|---|---|
| (1) | (2) | (3) | (4) | (5) | (6) | (7) |
| 2MASS 0034+0523 | T6.5 | 0.103 | 0.229 | 0.100 | 0.218 | 0.456 |
| 2MASS 00503322 | T7 | 0.104 | 0.266 | 0.180 | 0.388 | 0.363 |
| 2MASS 02432453 | T6 | 0.145 | 0.297 | 0.197 | 0.406 | 0.444 |
| 2MASS 04150935 | T8 | 0.041 | 0.183 | 0.131 | 0.255 | 0.382 |
| 2MASS 0727+1710 | T7 | 0.085 | 0.224 | 0.164 | 0.351 | 0.427 |
| 2MASS 0937+2931 | T6p | 0.151 | 0.316 | 0.076 | 0.174 | 0.539 |
| 2MASS 09392448 | T8 | 0.038 | 0.149 | 0.059 | 0.117 | 0.493 |
| SDSS 1110+0116 | T5.5 | 0.152 | 0.303 | 0.217 | 0.379 | 0.497 |
| 2MASS 11142618 | T7.5 | 0.039 | 0.177 | 0.076 | 0.150 | 0.482 |
| 2MASS 12170311 | T7.5 | 0.066 | 0.207 | 0.179 | 0.366 | 0.374 |
| 2MASS 1231+0847 | T5.5 | 0.181 | 0.271 | 0.157 | 0.328 | 0.451 |
| SDSS 13460031 | T6.5 | 0.131 | 0.278 | 0.156 | 0.351 | 0.430 |
| Gliese 570D | T7.5 | 0.063 | 0.198 | 0.116 | 0.253 | 0.397 |
| SDSS 1624+0029 | T6 | 0.154 | 0.280 | 0.142 | 0.311 | 0.422 |
| SDSS 1758+4633 | T6.5 | 0.101 | 0.247 | 0.200 | 0.411 | 0.400 |
| 2MASS 22284310 | T6 | 0.157 | 0.293 | 0.204 | 0.440 | 0.383 |
| CorrectionsaaScale factors applied to model ratios to bring them into agreement with measurements for Gliese 570D assuming Teff = 800 K and = 5.1; See 4.1. | 1.173 | 1.567 | 0.952 | 1.064 | 0.883 |
| Published Values | |||||||
|---|---|---|---|---|---|---|---|
| Source | SpT | Teff | [M/H] | TeffaaTeff from Golimowski et al. (2004). | TeffbbTeff from Vrba et al. (2004). | cc from Knapp et al. (2004). | |
| (K) | (cm s-2) | (K) | (K) | (cm s-2) | |||
| (1) | (2) | (3) | (4) | (5) | (6) | (7) | (8) |
| 2MASS 0034+0523 | T6.5 | 820–860 | 5.4–5.5 | ||||
| 2MASS 00503322 | T7 | 960–1000 | 4.8–5.0 | 0 | |||
| 2MASS 02432453 | T6 | 1040–1100 | 4.8–5.1 | 0 | 825–1150 | 950–1170 | 4.5 |
| 2MASS 04150935 | T8 | 740–760 | 4.9–5.0 | 0 | 600–750 | 690–850 | 5.0 |
| 2MASS 0727+1710 | T7 | 900–940 | 4.8–5.0 | 0 | 725–950 | 830–1020 | 4.5 |
| 2MASS 0937+2931 | T6p | 780–840ddTeff and for [M/H] = . See 4.2.2. | 5.3–5.5ddTeff and for [M/H] = . See 4.2.2. | 725–1000 | 700–850 | 5.5 | |
| 2MASS 09392448 | T8 | 700 | |||||
| SDSS 1110+0116 | T5.5 | 1020–1100 | 4.9–5.2 | 0 | 4.5 | ||
| 2MASS 11142618 | T7.5 | 700 | |||||
| 2MASS 12170311 | T7.5 | 860–880 | 4.7–4.9 | 0 | 725–925 | 820–1000 | 4.5 |
| 2MASS 1231+0847 | T5.5 | 1040–1100 | 5.2–5.5 | 0 | 5.0 | ||
| SDSS 13460031 | T6.5 | 960–1020 | 5.0–5.2 | 0 | 875–1200 | 950–1180 | 4.5 |
| Gliese 570D | T7.5 | 780–820 | 5.1 | 0 | 784–824eeTeff and from Geballe et al. (2001). | 5.0–5.3eeTeff and from Geballe et al. (2001). | |
| SDSS 1624+0029 | T6 | 980–1040 | 5.3–5.4 | 0 | 800–1100 | 920–1100 | 5.0 |
| SDSS 1758+4633 | T6.5 | 960–1000 | 4.7–4.9 | 0 | 4.5 | ||
| 2MASS 22284310 | T6 | 1080–1140 | 4.6–5.0 | 0 | |||
| Evolutionary ModelsaaEstimates derived from the solar metallicity evolutionary models of Burrows et al. (1997) and Teff and determinations from Table 4. | Golimowski et al. Luminosities | Vrba et al. Luminosities | ||||||||
|---|---|---|---|---|---|---|---|---|---|---|
| Source | SpT | M | R | Age | M | R | M | R | ||
| (M☉) | (R☉) | (Gyr) | (L☉) | (M☉) | (R☉) | (L☉) | (M☉) | (R☉) | ||
| (1) | (2) | (3) | (4) | (5) | (6) | (7) | (8) | (9) | (10) | (11) |
| 2MASS 0034+0523 | T6.5 | 0.039–0.055 | 0.081–0.090 | 3.4–6.9 | ||||||
| 2MASS 00503322 | T7 | 0.022–0.043 | 0.090–0.104 | 0.5–2.5 | ||||||
| 2MASS 02432453 | T6 | 0.024–0.041 | 0.092–0.106 | 0.4–1.7 | 0.0210.002 | 0.0860.005 | 0.0230.003 | 0.0910.005 | ||
| 2MASS 04150935 | T8 | 0.022–0.044 | 0.085–0.101 | 1.0–4.9 | 0.0200.001 | 0.0830.002 | 0.0280.002 | 0.0990.003 | ||
| 2MASS 0727+1710 | T7 | 0.022–0.035 | 0.093–0.104 | 0.5–2.2 | 0.0200.002 | 0.0830.003 | 0.0240.002 | 0.0920.004 | ||
| 2MASS 0937+2931 | T6p | 0.047–0.063 | 0.078–0.084 | 5.5–10 | 0.1180.018 | 0.1140.008 | 0.0610.009 | 0.0810.006 | ||
| SDSS 1110+0116 | T5.5 | 0.028–0.050 | 0.087–0.101 | 0.5–3.4 | ||||||
| 2MASS 12170311 | T7.5 | 0.022–0.038 | 0.091–0.103 | 0.7–2.9 | 0.0200.001 | 0.0940.002 | 0.0210.001 | 0.0960.002 | ||
| 2MASS 1231+0847 | T5.5 | 0.038–0.071 | 0.078–0.093 | 1.6–9.1 | ||||||
| SDSS 13460031 | T6.5 | 0.031–0.056 | 0.082–0.097 | 1.0–4.9 | 0.0510.006 | 0.1060.006 | 0.0490.006 | 0.1030.006 | ||
| Gliese 570D | T7.5 | 0.041–0.043 | 0.087–0.089 | 3.7–4.5 | bbLbol from Geballe et al. (2001). | 0.0370.003 | 0.0900.004 | |||
| SDSS 1624+0029 | T6 | 0.054–0.060 | 0.080–0.084 | 4.3–5.8 | 0.0650.007 | 0.0840.005 | 0.0730.009 | 0.0890.005 | ||
| SDSS 1758+4633 | T6.5 | 0.019–0.030 | 0.097–0.111 | 0.3–0.9 | ||||||
| 2MASS 22284310 | T6 | 0.018–0.034 | 0.096–0.115 | 0.2–0.9 | ||||||