11email: melandri@mporzio.astro.it 22institutetext: Dipartimento di Fisica, Università di Cagliari, S. P. Monserrato, 09042 Cagliari - Italy 33institutetext: INAF - Istituto di Astrofisica Spaziale e Fisica Cosmica, Via Fosso del Cavaliere 100, 00133, Roma - Italy 44institutetext: Istituto de Astrofisica de Andalucia (IAA-CSIC), Camino Bajo de Huetor 24, 18.008 Granada - Spain 55institutetext: Subaru Telescope - National Astronomical Observatory of Japan, Hilo, HI 96720 - USA 66institutetext: Department of Physics - Tokyo Institute of Technology, Meguro, Tokyo 152-0033 77institutetext: Department of Astronomy and Astrophysics, 525 Davey Lab, Pennsylvania State University, University Park, PA 16802-6305, USA
Multi-wavelength analysis of the field of the dark burst GRB 031220
We have collected and analyzed data taken in different spectral bands (from X-ray to optical and infrared) of the field of GRB 031220 and we present results of such multiband observations. Comparison between images taken at different epochs in the same filters did not reveal any strong variable source in the field of this burst. X-ray analysis shows that only two of the seven Chandra sources have a significant flux decrease and seem to be the most likely afterglow candidates. Both sources do not show the typical values of the colour but they appear to be redder. However, only one source has an X-ray decay index (1.3 0.1) that is typical for observed afterglows. We assume that this source is the best afterglow candidate and we estimate a redshift of 1.90 0.30. Photometric analysis and redshift estimation for this object suggest that this GRB can be classified as a Dark Burst and that the obscuration is the result of dust extinction in the circum burst medium or inside the host galaxy.
Key Words.:
Gamma rays:bursts – Gamma rays: observations – X-rays: general – Galaxies: photometrye-mail: melandri@mporzio.astro.it
1 Introduction
The lack of optical afterglow for a large fraction (about 50%) of well localized X-ray afterglows and, sometimes, together with the detection of radio afterglow, leads to the definition of the phenomenological class of the so called Dark Bursts. The nature of this class of events, bursts with no apparent optical afterglow, is still not clear but recent works have suggested some possible scenarios. In some cases the non-detection of the optical transient could be simply due to the lack of suitable instrumentation: the slowness of the response or the depth of the surveying combined with some dim or rapid decaying event could bias the determination of the truly Dark Bursts population (Berger et al. 2002, Fynbo et al. 2001). It is also possible that this kind of bursts have an intrinsically fainter optical afterglow compared to the afterglow of other GRBs at all wavelengths (De Pasquale et al. 2003, Jakobsson et al. 2004) and this could happen if the afterglow decelerated in a low density medium (Sari et al. 1998). If instead GRBs are associated with the death of massive stars (Paczyński 1998, MacFadyen & Woosley 1999, Wheeler et al. 2000) then the optical flux of the afterglow could be blocked by a large fraction of interstellar dust along the line of sight (Stratta et al. 2004) or the single event could be the result of a highly absorbed star formation burst placed in a dusty molecular cloud (Reichart & Price 2002, Lazzati et al. 2002). From X-ray analysis (Galama & Wijers 2001) there is evidence for high column densities of gas close to GRBs, but the measured optical extinction is smaller than expected because the hard -ray radiation of the burst destroys the dust in their enviroment. In this obscured scenario, the failed detection of the optical transient could be easily ascribed to extinction by the dust of the host galaxy. Moreover, is now well assessed that GRBs are the most energetic events in the universe and they have a large redshift distribution () (e.g., Schaefer, Deng & Band 2001; Bagoly et al. 2003). So a fraction of Dark Bursts could be originated at high-z (, Lamb & Reichart 2000, Wijers et al. 1998) and their emission could be dumped by the Lyman absorption redshifted to the optical-infrared bands. Obviously, also a combination of these effects can determine the dark nature of these events. However, for a few events (potentially Dark Bursts) of which the distance has been determinated, the contribution of high redshift effects to the optical darkness of this events is very little or negligible and they are probably the result of dust extinction in the circum burst medium (Djorgovski et al. 2001, Piro et al. 2002).
2 GRB 031220
GRB 031220 was detected by HETE2111http://space.mit.edu/HETE/Bursts/GRB031220/ satellite on 2003 December 20.1458 UT (HETE2 trigger 2976) in the 6-120 keV band with a count rate of 466 counts . The center coordinates of the Soft X-ray Camera (SXC) error circle are RA: , DEC: (J2000). The peak energy () for this burst was 49.24 keV with a fluence of and lasted– 23.7 seconds (HETE2 trigger 2976).
The first observation in the optical band of the field of this GRB was performed by the ROTSE-IIIb telescope hours after the burst and did not reveal any new source up to an unfiltered magnitude of 19.2 (Rykoff et al., 2004). For comparison the magnitude of GRB 030329 afterglow faded to a magnitude in the optical band hours after the burst (Price & Peterson 2003, Smith et al. 2003). The HETE2 error circle (20.77 arcmin of diameter) was imaged with many different optical telescopes since early times until some months after the burst (Kosugi et al. 2003, Antonelli et al. 2003, Gorosabel et al. 2004) but no optical afterglow has ever been identified. The SXC error box was completely covered also by the Chandra X-ray Observatory with two set of observations.
3 Follow up observation and data analysis
3.1 X-ray data
| Source name | Right Ascension | Declination | First Observation | Second Observation | |
|---|---|---|---|---|---|
| Count rate (10-3count s-1) | Count rate (10-3count s-1) | ||||
| 1 | CXOU J043944.3+072036 | 0.8 0.2 | |||
| 2 | CXOU J043939.7+072318 | 1.3 0.2 | 0.8 0.3 | ||
| 6 | CXOU J043946.4+072220 | 2.6 0.3 | 2.5 0.4 | ||
| 7 | CXOU J043946.1+072256 | 0.8 0.2 | 0.4 0.2 | ||
| 17 | CXOU J043954.8+072149 | 0.7 0.2 | 0.4 0.3 | ||
| 27 | CXOU J044003.7+072055 | (2.1 0.3) | Extended object | ||
| 37 | CXOU J043857.8+072449 | Border of the chip | Spurious detection | ||
| 55 | CXOU J043929.2+072314. | 0.5 0.2 | — | ||
| 58 | CXOU J044012.5+071945 | 0.6 0.2 | — | ||
| 66 | CXOU J043927.2+072351 | 0.3 0.1 | — | ||
| 78 | CXOU J043934.4+072124 | 0.3 0.2 | — | ||
| 82 | CXOU J043855.2+072457 | 0.3 0.1 | — |
X-ray observations were carried out with the Chandra space observatory in two different epochs: 5.62 (De Pasquale et al., 2003) and 28.47 (Gendre et al., 2004) days after the burst. Observations were performed using ACIS_I detectors and exposure times were 40 and 20 kiloseconds respectively. The data reduction was performed using the version 3.0 of the CIAO software. All the events flagged as bad by the calibration chain have been discarded and only the grades 0, 2, 3, 4 and 6 (within the provided good time intervals according to the CIAO cookbook222see the Chandra Proposer Observatory Guide available from the Chandra web site for details.) have been kept. The event file has been checked for flaring background activity and no such event has been found. Then, the event file has been filtered for energies between 0.2 and 8.0 keV and this filtered event file has been used for detection with the wavelet tool wavdetect.
During the first Chandra observation, eleven sources were detected inside the HETE2 error box plus one source (source # 37) near the border of the chip. Sources position extracted from De Pasquale et al. (2003) and Gendre et al. (2004) are reported in Table 1. Five of these sources (sources # 55, # 58, # 66, # 78, and # 82) were too faint to be detectable during the second Chandra observation. Source # 37, reported by De Pasquale et al. (2003), is not detected in our refined analysis (Gendre et al. 2004). This source was spurious, its false detection was mainly due to the vicinity of a CCD edge. On the remaining six sources, five were detected. The only exception is source # 1, which disapeared. We indicate in Table 1 the observed count rate of each source during the first and second observation. The unabsorbed flux in units of erg s-1 cm-2 can be obtained by multiplying the values indicated in Table 1 by (0.2-8.0 keV band) or (2.0-10.0 keV band). To derive these conversion factors, we used a power law model with a photon index of 2.
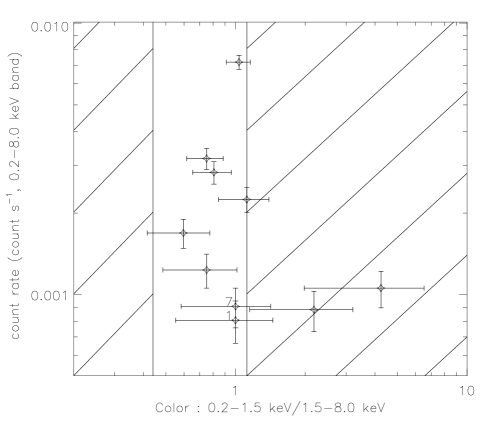
Due to the poor signal of possible afterglow candidates we could not extract source spectra in order to analyze them (e.g. Ballet 2003). Thus we used soft (0.2-1.5 keV) and hard (1.5-8.0 keV) X-ray bands to derive candidates colours. Results for the first Chandra observation are plotted in Fig. 1 together with the valid colour range expected from typical afterglow. All candidates are compatible with a power law with photon index and a Galactic column density of hydrogen atoms of (Dickey & Lockman 1990).
We used the data from the two Chandra observations to look for variability. Among the six sources detected in the first Chandra observation and bright enough to be detected in the second observation only 2 of them show a flux decrease by more than a factor of 2 (at a 2 level of significance) : source # 1 is not detected and source # 7 is marginally detected. The corresponding flux variation factor is 2.6 and 2.3 for sources #1 and #7 respectively (Gendre et al., 2004). The remaining sources are constant (within error bars). Note that source # 27 appears to be extended in the second Chandra observation, and thus its count rate is not totaly reliable. It is compatible with the one measured in the first Chandra observation. We then built light curves (in the 2.0-10.0 keV band), using the value of the prompt emission, recorded by the French Gamma Telescope (FREGATE) on board HETE2 (the flux was in the 2.0-10.0 keV band, Atteia, private communication), and each Chandra observation as a single bin in the light curve. In Fig. 2 we show the light curve of the afterglow candidate source # 1 together with the best fitted power law relationship (with a decay index of ). The light curve of the afterglow candidate source # 7 is flatter, with a decay index of . The source #7 decay index within the two chandra observations is .

3.2 Optical data
| Date | T | Filter | Exp | Seeing | Obs |
| (UT) | (days) | (s) | (′′) | ||
| Dec 20.4722 | 0.3264 | 5x600 | 0.9 | 111Subaru Telescope + FOCAS | |
| Dec 21.4636 | 1.3088 | 5x600 | 0.9 | a | |
| Dec 28.0375 | 7.8917 | 3600 | 1.1 | 222TNG Telescope + DOLORES | |
| Dec 30.9636 | 10.8178 | 3600 | 1.7 | 333TNG Telescope + NICS | |
| Jan 04.8695 | 15.7237 | 4980 | 0.9 | 444CA3.5m Telescope + OMEGA-Prime | |
| Jan 05.8773 | 16.7315 | 4500 | 1.0 | d | |
| Jan 06.9488 | 17.8030 | 4440 | 0.9 | d | |
| Mar 07.7858 | 78.6400 | 4080 | 1.0 | d | |
| Mar 08.8796 | 79.7338 | 2700 | 1.1 | d | |
| Mar 20.8082 | 91.6622 | ch a,b,c,d∗ | 3600 | 1.4 | 555CA2.2m Telescope + BUSCA |
| Mar 21.8016 | 92.6558 | ch a,b,c,d | 3600 | 1.4 | e |
| Mar 22.8034 | 93.6576 | ch a,b,c,d | 3600 | 2.5 | e |
| Mar 23.8067 | 94.6609 | ch a,b,c,d | 3600 | 2.1 | e |
Optical and infrared observations of GRB 031220 field are listed in Table 2. Different epoch images, in different spectral bands, taken with different telescopes and instrumentation (as reported in Table 2) have been collected and analyzed.
3.2.1 Subaru observations
The Subaru observation consists of two data sets of I-band images taken at two different epochs, approximately 8 and 32 hours after the burst. Images have been acquired with the FOCAS instrument operating in imaging mode on the Subaru 8.2m telescope on Mauna Kea (Hawaii). The two sets of images start at 11:20 UT on Dec 20 (Kosugi et al. 2004) and 11:07 UT on Dec 21 respectively. The field was covered with 5 pointings of 600 seconds for each data set obtained moving the center position of each exposure in order to cover most of the SXC error circle of GRB 031220 (20.77 arcmin of diameter). The field of view for a single image is 6 arcmin but all the Chandra sources listed in Table 1 are present in each set of images.
3.2.2 TNG observations
Two observations were taken with the Telescopio Nazionale Galileo (TNG) at La Palma (Canary Islands, Spain): a first exposure (3600 seconds) in the R band started at 00:54 UT on 28 Dec with the DOLORES instrument operating in imaging mode (Antonelli et al. 2003) and a second exposure (3600 seconds) in the K’ band started at 23:07 UT on 30 Dec with the NICS instrument.
3.2.3 Calar Alto observations
Three sets of observations were taken at different epochs at the Calar Alto Observatory in Spain. First and second sets were taken on the first days of January (4, 5 and 6) and March (6 and 7) respectively with the OMEGA-prime wide-field near infrared camera (JHK’ bands on January and JH bands on March) at the Calar Alto 3.5m telescope. A further set of images were taken at the end of March with the BUSCA camera ( 12 arcmin square of field of view) that is a CCD system which allows simultaneous direct imaging of the same sky area in four colours, corresponding to the U, B, R and I band. The effective wavelengths for BUSCA filters are reported in the caption of Table 2.
3.3 Image photometry

The Chandra source # 37 is far from other candidates, it is not present in all images and the refined analysis of the X-ray data after the second Chandra observation excluded it as a possible variable source in the field (Gendre et al., 2004). For this reason our analysis has been limited to the other six Chandra sources, for which we show in Fig. 3 the derived spectral energy distribution.
The first step of our analysis was to investigate of the field of GRB 031220 in order to check the possible presence of new variable sources, namely a possible optical afterglow without X-ray emission. In order to do this, we make comparison between the two Subaru observations (taken at and hours after the burst) and then between Subaru observations and R band observation from TNG (taken days after the burst) or BUSCA I band observation (taken months after the burst). First of all, a visual comparison between two exposures of the same portion of the field has been made looking for any possible transient object. Then, for each image a list of objects has been extracted using Sextractor (Bertin & Arnouts 1996) and compared each other in order to investigate all the objects present in the field. This deeper inspection did not reveal variable sources at a significance level of 2 .
Then the photometric analysis of the six brightest Chandra sources listed in Table 1 has been performed. Optical fields have been calibrated using USNO catalogues (as BUSCA filters are not standard we have assumed the correspondence , , , ) whereas for infrared fields 2MASS catalog has been used. The photometric analysis of each single image has been performed in the IRAF 333IRAF is the Image Reduction and Analysis Facility distributed by the National Optical Astronomy Bservatories (NOAO), which are operated by AURA Inc., under cooperative agreement with US National Science Foundation. enviroment using the DAOPHOT package (Stetson 1987). The magnitudes for all afterglow candidates, listed in Table 3, have been estimated making differential aperture photometry with the PHOT routine. In particular, the magnitudes of a set of selected and not saturated stars have been estimated, compared with known catalog values for these stars and finally used to evaluate the magnitudes of all the candidates. Using this procedure we can use small apertures for each candidate in order to avoid contaminations in the measured magnitudes and colours from near objects. All the magnitudes calculated and listed in Table 3 have been corrected in each filter for the corresponding Galactic extinction, , reported in the same table ( = 0.146, Schlegel et al. 1998).
| Source | # 1 | # 2 | # 6 | # 7 | # 17 | # 27 | |||
| Filter (Obs) | Mag | Err | |||||||
| (e) | — | — | 22.95 0.12 | 23.33 0.17 | — | 20.23 0.02 | 0.72 | 25.2 | -0.533 |
| (e) | 23.77 0.36 | — | — | — | — | 19.85 0.10 | 0.63 | 24.7 | +0.085 |
| (b) | 23.61 0.11 | — | 20.22 0.05 | 23.09 0.11 | 22.71 0.07 | 19.03 0.05 | 0.38 | 24.0 | -0.209 |
| (e) | 23.43 0.19 | 24.20 0.33 | 20.19 0.12 | 22.34 0.13 | — | 19.18 0.11 | 0.38 | 24.8 | -0.143 |
| (a) | 23.00 0.26 | 24.13 0.26 | 19.89 0.26 | 21.83 0.26 | 22.40 0.25 | 19.12 0.25 | 0.29 | 26.5 | -0.448 |
| (a) | 23.43 0.26 | 24.23 0.27 | 19.93 0.25 | 21.81 0.25 | 22.46 0.25 | 19.11 0.25 | 0.29 | 26.5 | -0.448 |
| (e) | 23.04 0.21 | — | 20.19 0.20 | 22.06 0.21 | — | 19.37 0.20 | 0.29 | 23.5 | -0.448 |
| (d) | 20.52 0.09 | 21.40 0.42 | 17.94 0.04 | 19.59 0.05 | 21.23 0.15 | 17.22 0.23 | 0.13 | 22.0 | -0.896 |
| (d) | 20.41 0.26 | 21.53 0.42 | 17.80 0.23 | 19.52 0.24 | 21.15 0.34 | 17.22 0.20 | 0.13 | 21.7 | -0.896 |
| (d) | 19.55 0.14 | 21.15 0.34 | 17.11 0.12 | 18.69 0.12 | 19.87 0.14 | 16.45 0.12 | 0.08 | 21.4 | -1.360 |
| (c) | 18.57 0.14 | — | 16.41 0.08 | 17.75 0.10 | 18.70 0.19 | — | 0.08 | 20.9 | -1.846 |
| (d) | 18.61 0.27 | 18.79 0.27 | 16.40 0.25 | 17.82 0.26 | 18.54 0.56 | 15.70 0.25 | 0.05 | 20.6 | -1.846 |
| 5.04 0.17 | — | 3.81 0.09 | 5.34 0.14 | 4.01 0.20 | — | ||||
| 1.95 0.16 | — | 1.53 0.09 | 1.84 0.11 | 2.53 0.24 | — |
4 Redshift estimation
Photometric redshifts have been estimated for all the Chandra sources by adopting a minimization technique of the observed Spectral Energy Distribution (SED) on a spectral library drawn from the Rocca-Volmerange synthesis models (Le Borgne & Rocca-Volmerange 2002, Fioc & Rocca-Volmerange 1997) as described by Fontana et al. (2000). This method takes into account the star formation history of each galaxy type, the reddening produced by internal dust and Lyman absorption produced by intergalactic dust. This is a widely used and well tested technique for redshift determination (Fernandez-Soto et al. 1999, Csabai et al. 2000, Rowan-Robinson 2003).
We further tested this method with a GRB event that is at high redshift, applying this tecnique to GRB 000131, the burst with the highest known redshift (, Andersen et al. 2000). We used the result of broad band photometry extrapolated by the author and we obtained a redshift of for this event, in good agreement with Andersen’s one.
Do to the lack of a clearly fading afterglow we can assume that our estimated magnitudes reported in Tab.3 have to be ascribed to the host galaxy of GRB 031220. Because of the photometric redshift determination algorithm requires input magnitudes in the AB system we converted the measured magnitudes from the Vega system to AB system. We used the relation , where are the corrections applied and listed in Table 3. The results of redshifts determination procedure are summarized in Table 4 and shown in Fig. 4: left plot of the figure shows the AB magnitudes of the six Chandra candidates in different photometric bands with the corresponding best fit curve; in the right plot is visible the reduced distribution versus the photometric redshift . As reported in Table 4, for our two potential afterglow candidates, source # 1 and source # 7, we estimated a redshift of ( = 0.22 for 7 degrees of freedom) and ( = 2.60 for 7 degrees of freedom) respectively. In the same table we have reported the minimum of the reduced distribution, the probability and the rest-frame colour excess for each candidate. The estimate of the colour excess with this algorithm is obtained assuming a Small Magellanic Cloud (SMC) extinction law.
To be sure that we can really exclude high redshifts, we apply the fit procedure on this two candidates forcing the redshift to be . After the test, for these two objects we obtain a reduced distribution very broad: in particular we found for source # 1 and for source # 7 and the correspondent values of were 2.79 and 13.60 respectively (for 7 degrees of freedom).
| Candidate | ||||
|---|---|---|---|---|
| 1 | 1.90 0.30 | 0.22 | 0.98 | 0.10 |
| 2 | 3.45 0.90 | 1.17 | 0.31 | 0.00 |
| 6 | 0.62 0.15 | 1.16 | 0.32 | 0.85 |
| 7 | 1.57 0.45 | 2.60 | 0.01 | 0.03 |
| 17 | 3.15 0.55 | 0.04 | 0.99 | 0.00 |
| 27 | 2.50 0.10 | 0.66 | 0.70 | 0.00 |

5 Discussion
We analyzed the field of GRB 031220. We find seven X-ray sources inside the HETE2 error circle and only two of them (source # 1 and source # 7) are showing a fading behaviour.
Taking into account the prompt and the two Chandra observations, source # 1 has a X-ray decay index of , that is typical for observed afterglows at early time (De Pasquale et al. 2005), and source #7 got a decay index of . One can note that the afterglow light curve cannot be always extrapolated backward up to the prompt emission, which can lie above or below the extrapolated light curve (see e.g. Costa et al. 1997) Thus, taking only into account the two Chandra observations, source #1 has a decay index of at least 1.1 (90% confidence level) and source #7 a shallow decay of (90% confidence level). After 5 days, the observed usual decay is 1.9 (Gendre et al. 2005), clearly not consistent with the observed shallow decay of source #7. This shallow decay is also not consistent with the decay inferred from the optical variation (, Gorosabel et al., 2004). It may be due to some flaring activities, like GRB 970508 (Piro et al. 1998), but most of the afterglows present only a smooth power law decay with sometime a possible jet break (De Pasquale et al. 2005, Gendre et al. 2005). From all of these considerations, we propose that source #1 is the afterglow of GRB 031220 rather than source #7, while we cannot formally exclude that source #7 is related to GRB 031220.
The estimation of for source # 1 () is compatible with the value of found using the Boer & Gendre relationship (Gendre & Boer 2005) and also with the pseudo redshift of estimated from the prompt emission (Atteia 2003). It should be note that the Boer & Gendre redshift estimator is based on the flux estimation and the error quoted include the error due to the uncertainty on the flux calculation. Nevertheless source # 1 and source # 7 got a similar flux so the redshift estimator is very similar for the 2 sources.
The more significant afterglow candidate found by the X-ray data analysis (source # 1) has peculiar value of colour, that is . This value is still compatible with the optical transients colour-colour selection criteria of Gorosabel et al. (2002) but it is not typical. This potential disagreement with the colours expected for GRB afterglows (Gorosabel et al. 2002) is likely because the and -band fluxes of object # 1 is (if not totally) dominated by a constant host galaxy component. Thus, our estimated colour should be considerd like an upper limit for the afterglow and most properly referred to the host galaxy of this GRB. Is interesting to note that the colour of source # 1 is redder that the host galaxy sample by Le Floc’h et al. (2003), explainable by a high dust content in this GRB host galaxy candidate. From the literature the mean of colour distribution for optically obscured burst is (Le Floc’h et al. 2003). The colour found for our source indicates that this burst should be a high obscured or a high redshift event. As an example, the first well localized burst with no optical afterglow (GRB 970828, ), have and this value is well explained by dust extinction within the host galaxy (Djorgovski et al. 2001). Also the dark GRB 000210 (Piro et al. 2002) shows and the darkness is explained by the effect of local absorber within the host galaxy (Gorosabel et al. 2003). Nevertherless, the burst with the highest spectroscopic redshift (, GRB 000131, Andersen et al. 2000) has a similar value of colour of . Then, with the only colour information it is impossible to discriminate between the possibility of high obscured or high redshift event. However, the results obtained forcing the fit procedure with high values of redshift, described at the end of previous section, permit us to exclude high redshift for this event.
De Pasquale et al. (2003) shows that the X-ray flux of optically dark bursts is on average weaker than the flux of bright bursts. They also find that about 20% of the dark bursts show an optical to X-ray flux much lower than that observed in optically bright events, corresponding to a , where is defined as the ratio between the optical and X-ray spectral index. Moreover, in a recent work, Jakobsson et al. (2004) shows that optically dark bursts display the trend to be located in a well defined area on a plane versus , where and are the optical (in the R band) and the X-ray flux respectively. This area is located below the constant line and this value describe the transition between dark and luminous optical burst (Jakobsson et al. 2004). For GRB 031220 we do not see an optical fading afterglow but only the host galaxy and our measured magnitudes should be considered like upper limits for this burst. Using the value of the magnitude measured in the R (or I) band and the X-ray flux found in our analysis for source # 1 we can extropolated X-ray and optical flux at 11 hours after the burst assuming a decay index of .. We obtain an X-ray flux of ( identical value for source # 7 ) whereas the upper limit for the optical flux is . If instead we assume the magnitude of source # 7 we find an upper limit for the optical flux of . As one can see in Fig.1 of Jakobsson et al. (2004) source # 1 is located close to the transition area defined by , inside the belongings region for the Dark Bursts, whereas source # 7 is outside this region. This information, together with the fact that we did not reveal any optical afterglow emission, allows us to classify this burst as a Dark event.
On the basis of the colour excess found in our analysis we can estimate the rest-frame column density of hydrogen atoms () for source # 1. Assuming a SMC-like interstellar medium () we obtained for source # 1. Instead, for source # 7 we obtained . The estimate of for source # 1 is an indication of the presence of medium in the vicinity of this source (or inside the host galaxy) with a density comparable with the observed column density inside the disk and the bulge of our Galaxy.
6 Conclusions
We have performed a multiwavelength analysis of all the afterglow candidates of GRB 031220 inside the HETE error circle. A deep inspection of optical and infrared images taken at different epochs did not reveal any new variable sources without X-ray emission. In the optical vs. X-ray diagram our best afterglow candidate is located in the region of dark events and show redder colour than typical optical transients. For these reasons we can infer that this GRB belongs to the class of Dark Bursts.
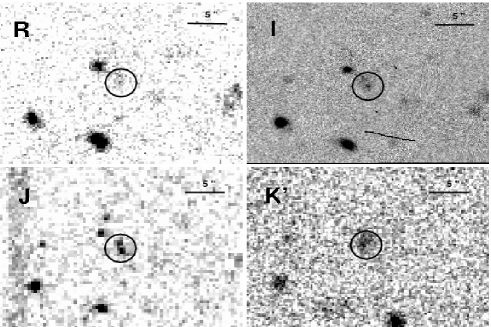
If Chandra source # 1 is the host galaxy of GRB 031220 it is evident that the optical-infrared flux extinction observed could not be ascribed to high redshift, because at the Lyman break is at . The host galaxy of this burst (Fig.5) shows a red colour ( 5) and should be classified as an Extreme Red Object (ERO). The infered rest-frame column density derived for this source permit us to conclude that the darkness of GRB 031220 is the result of dust extinction in the circum burst medium or inside the host galaxy.
Acknowledgements.
This study is partially supported by the Italian Space Agency (ASI) the through the grant accorded to A.M. We thank H. Tananbaum and the Chandra planning team for the successful implementation of the follow-up observation. This study is partially based on data taken at the 2.2m and 3.5m telescopes of the Centro Astronómico Hispanico Alemán de Calar Alto, operated by the Max Plank Institute of Hidelberg and Centro Superior de Investigaciones Científicas and partially supported by the Spanish Ministry of Science and Education through programmes ESP2002-04124-C03-01 and AYA2004-01515 (including FEDER funds). This research is also partially supported by the EU FP5 RTN “Gamma ray bursts: an enigma and a tool”, through the grant accorded to B.G.References
- (1) Andersen M. I. et al., 2000, A&A 364, L54
- (2) Antonelli L. A. et al., 2003, GCN 2503
- (3) Atteia J. L., 2003, A&A 407, L1
- (4) Bagoly Z. et al., 2003, A&A 398, 919
- (5) Ballet J., 2003, C. Motch & J.-M. Hameury eds, EAS Publications Series 7, 125
- (6) Berger E. et al., 2002, ApJ 581, 981
- (7) Bertin E. & Arnouts S., 1996, A&AS 144, 363
- (8) Costa, E., et al., 1997, Nature, 387, 783
- (9) Csabai I. et al., 2000, AJ 119, 69
- (10) De Pasquale M. et al., 2003, ApJ 592, 1018
- (11) De Pasquale M. et al., 2003, GCN 2502
- (12) De Pasquale M., et al., 2005, submitted to A&A, astro-ph/0507708
- (13) Dickey J. M. & Lockman F. J., 1990, ARA&A, 28, 215
- (14) Djorgovski S. G. et al., 2001, ApJ 562, 654
- (15) Fernandez-Soto A. et al., 1999, ApJ 513, 34
- (16) Fioc M. & Rocca-Volmerange B., 1997, A&A 326, 950
- (17) Fynbo J. U. et al., 2001, A&A 369, 373
- (18) Fontana A. et al., 2000, AJ 120, Issue 5, 2206
- (19) Galama T. & Wijers R. A. M. J., 2001, ApJ 549, L209
- (20) Gendre B. et al., 2004, GCN 2523
- (21) Gendre B. & Boer M, 2005, A&A 430, 465
- (22) Gendre B., Corsi, A., Piro, L., 2005, submitted to A&A
- (23) Gorosabel J. et al., 2004, GCN 2513
- (24) Gorosabel J. et al., 2003, A&A 400, 127
- (25) Gorosabel J. et al., 2002, A&A 384, 11
- (26) Kosugi G. et al., 2003, GCN 2497
- (27) Jakobsson P. et al., 2004, ApJ 617, L21
- (28) Lamb D. Q. & Reichart D. E., 2000, ApJ 536, 1
- (29) Lazzati D. et al., 2002, MNRAS 330, 583
- (30) Le Borgne D. & Rocca-Volmerange B., 2002, A&A 386, 446
- (31) Le Floc’h E. et al., 2003, A&A 400, 499
- (32) MacFadyen A. I. & Woosley S. E., 1999, ApJ 524, 262
- (33) Maiolino R. et al., 2001a, A&A 365, 28
- (34) Paczyński B., 1998, ApJ 494, L45
- (35) Piro, L., et al., 1998, A&A, 331, L41
- (36) Piro L. et al., 2002, ApJ 577, 680
- (37) Price P. A. & Peterson B. A., 2003, GCN 1987
- (38) Reichart D. E. & Price P. A., 2002, ApJ 565, 174
- (39) Rykoff E. S. et al., 2004, GCN 2495
- (40) Rowan-Robinson M., 2003, MNRAS 345, 819
- (41) Sari R., Piran T. & Narayan R., 1998, ApJ 497, L17
- (42) Schaefer B. E., Deng M. & Band D .L., 2001, ApJ 563, L123
- (43) Schlegel D. J. et al., 1998, ApJ 500, 525
- (44) Smith D. A. et al., 2003, ApJ 596, L151
- (45) Stetson P. B., 1987, PASP, 99, 191
- (46) Stratta G. et al., 2004, ApJ 608, 846
- (47) Wheeler J. C. et al., 2000, ApJ 537, 810
- (48) Wijers R. A. M. J., Bloom J. S., Bagla J. S. & Natarajan P., 1998, MNRAS 294, L13